www.atmos-chem-phys.net/13/7473/2013/ doi:10.5194/acp-13-7473-2013
© Author(s) 2013. CC Attribution 3.0 License.
Atmospheric
Chemistry
and Physics
Geoscientific
Geoscientific
Geoscientific
Geoscientific
Seasonal cycle and modal structure of particle number size
distribution at Dome C, Antarctica
E. J¨arvinen1, A. Virkkula1,2, T. Nieminen1, P. P. Aalto1, E. Asmi2, C. Lanconelli3, M. Busetto3, A. Lupi3, R. Schioppo4, V. Vitale3, M. Mazzola3, T. Pet¨aj¨a1, V.-M.Kerminen1, and M. Kulmala1
1University of Helsinki, Department of Physics, P.O. Box 64, 00014 Univ. of Helsinki, Finland 2Finnish Meteorological Institute, P.O. Box 503, 00560 Helsinki, Finland
3Institute of Atmospheric Sciences and Climate of the Italian National Research Council (ISAC-CNR), Via Gobetti, 101,
40129 Bologna, Italy
4ENEA-UTA Unit`a Tecnica Antartica, via Anguillarese 301, S.Maria di Galliera, Rome, Italy
Correspondence to: E. J¨arvinen ([email protected])
Received: 25 January 2013 – Published in Atmos. Chem. Phys. Discuss.: 4 March 2013 Revised: 19 June 2013 – Accepted: 24 June 2013 – Published: 5 August 2013
Abstract. We studied new particle formation and modal
be-havior of ultrafine aerosol particles on the high East Antarc-tic plateau at the Concordia station, Dome C (75◦06′S, 123◦23′E). Aerosol particle number size distributions were measured in the size range 10–600 nm from 14 December 2007 to 7 November 2009. We used an automatic algorithm for fitting up to three modes to the size distribution data. The total particle number concentration was low with the median of 109 cm−3. There was a clear seasonal cycle in the total particle number and the volume concentrations. The concen-trations were at their highest during the austral summer with the median values of 260 cm−3and 0.086 µm3cm−3, and at their lowest during the austral winter with corresponding val-ues of 15 cm−3and 0.009 µm3cm−3. New particle formation events were determined from the size distribution data. Dur-ing the measurement period, natural new particle formation was observed on 60 days and for 15 of these days the particle growth rates from 10 to 25 nm in size could be determined. The median particle growth rate during all these events was 2.5 nm h−1and the median formation rate of 10 nm particles was 0.023 cm−3s−1. Most of the events were similar to those observed at other continental locations, yet also some vari-ability in event types was observed. Exceptional features in Dome C were the winter events that occurred during dark periods, as well as the events for which the growth could be followed during several consecutive days. We called these latter events slowly growing events. This paper is the first one to analyze long-term size distribution data from Dome
C, and also the first paper to show that new particle forma-tion events occur in central Antarctica.
1 Introduction
The climatic effects of atmospheric aerosol particles are tied strongly with their concentration, size distribution, chemi-cal composition and dynamichemi-cal behaviour in the atmosphere (Forster et al., 2007; Quaas et al., 2009; Ghan et al., 2012). A key process in this respect is atmospheric new particle for-mation, including nucleation from precursor gases and subse-quent growth of nucleated clusters to larger sizes (Kulmala et al., 2004; Wang and Penner, 2009; Kazil et al., 2010; Makko-nen et al., 2012). The formation rate of new aerosol particles is linked closely with the gaseous sulfuric acid concentration (e.g. Kulmala et al., 2006; Pet¨aj¨a et al., 2009; Kerminen et al., 2010; Sipil¨a et al., 2010), which is related to sulfur dioxide originating mostly from anthropogenic sources.
et al., 1997; Asmi et al., 2010; Yu and Luo, 2010; Udisti et al., 2012), even though some long-range transported pollu-tant aerosols from other continents have been observed (e.g., Fiebig et al., 2009). Studying new particle formation events in the Antarctica gives us information on natural aerosol pro-cesses and how natural propro-cesses affect the formation rate of new aerosol particles.
Aerosol number concentrations, size distributions and chemical composition have been studied at several stations around Antarctica, and long-term records of particle num-ber concentrations have been reported, e.g. from Neumayer (Weller et al., 2011) and the South Pole (e.g., Samson, 1990). Particle number size distributions have been measured mainly during campaigns at coastal stations (e.g., Ito, 1993; Koponen et al., 2003; Virkkula et al., 2007; Asmi et al., 2010; Pant et al., 2011; Belosi et al., 2012) and on the up-per plateau at the South Pole (e.g., Park et al., 2004). Hara et al. (2011) presented number size distributions and aerosol volatility measured at the Japanese Antarctic station Syowa, on the coast of Queen Maud Land in 2003–2005. Norwegian researchers recently started long-term size distribution mea-surements at the Troll station, more to the inland of Queen Maud Land (Hansen et al., 2009), but there are no long-term size distribution measurements from the upper plateau. The measurements presented here are the first step towards fill-ing in this gap: particle number size distributions have been measured at the Concordia station at Dome C on the upper plateau of East Antarctica since December 2007.
New particle formation has been observed at several sta-tions in coastal Antarctica (Ito, 1993; Koponen et al., 2003; Asmi et al., 2010). The motivation of this study was to observe and analyse new particle formation events in the inland Antarctica. In this work we will present seasonal variation of the particle number and volume concentration and modal structure of particle number size distributions, as well as analyses of new particle formation events during the first continuous period from December 2007 until November 2009.
2 Instrumentation and data analysis methods
2.1 Size distribution measurements
We measured particle number size distributions at the Italian–French Concordia station at Dome C (75◦06′S, 123◦23′E). The station is located on the upper plateau of East Antarctica at 3200 m above sea level and 1100 km away from the nearest coast. The measurement period was from 14 December 2007 to 7 November 2009.
The sampling site is the same as was used by Udisti et al. (2012) and Becagli et al. (2012) for taking filter samples for chemical analyses. This sampling site is located about 1 km southwest of the station main buildings, upwind in the direction of the prevailing wind. All motorized activity is
for-bidden south and within 300 m north of the sampling site (Udisti et al., 2012). The northeastern direction was declared as the contaminated sector (10–90◦) due to diesel generator and motor vehicle emissions at the station. Consequently, the data were omitted from further analysis when the measured winds were from the contaminated sector. Due to contami-nation, 6.6 percent of the measured data were removed from the analysis.
Snow mobiles and other traffic were active from early November to February and thus did not create major gaps to the winter measurements. However, there are minor gaps in the measured data due to power failures. Longer gaps in the data exist for the early spring 2008 and for winter 2009.
Particle number size distributions in the size range 10-600 nm were measured with a Differential Mobility Particle Sizer (DMPS) that consisted of a Hauke-type medium-size DMA (Winklmayr et al., 1991) in a closed-loop arrangement and a TSI Model 3010 condensation particle counter (CPC) that detects particles larger than 10 nm. The DMPS setup was similar to that used at Aboa by Virkkula et al. (2007). The time resolution of the raw data was 10 min. The size distri-bution data in this study are presented in the UTC time but the new particle formation plots are presented in local time (UTC+8 h).
In an ideal setup, there would be an independent CPC for measuring total particle number concentrations and a DMPS from which the total number concentration can be calculated. The agreement of these two would increase the quality of the data. However, in the measurements discussed here there was no additional CPC available, so we cannot calculate the de-gree of closure between two independent measurement meth-ods.
2.2 Data processing methods
2.2.1 Mode fitting
modes is used when referring to the modes obtained by the algorithm.
Later in this work the terms nucleation mode, Aitken mode and accumulation mode ranges refer to the measured data in pre-selected size ranges: nucleation mode range (<25 nm), Aitken mode range (25–100 nm) and accumulation mode range (>100 nm) (Dal Maso et al., 2005).
2.2.2 New particle formation event classification
New particle formation event days – simply event days be-low – were determined folbe-lowing the procedure introduced by Dal Maso et al. (2005). We counted as an event day those days when growth of the newly formed particles could be re-liably followed as well the days when growth was clearly de-tected but could not be followed due to for example changes in the air masses. We divided the event days into class 1 events and into class 2 events. From a class 1 event, we could determine the growth rate in contrast to class 2 events. Fur-thermore we divided the class 1 events into normal events that remind events typically observed at continental sites (for example in Hyyti¨al¨a, Finland, e.g. Dal Maso et al., 2005) and into slowly growing events, when the growth could be fol-lowed for several days.
Event days were carefully checked to verify that the ob-served events were natural events and not due to contami-nation from the station. For this reason, the wind direction and speed were tracked two days before the event started. If the wind direction was from the polluted sector or the wind speed was lower than 2 m s−1 for more than one hour during the 48 h period after the event started, the event was excluded from the analysis. Altogether 21 new particle mation events were excluded. Examples of new particle for-mation events and the wind speed and direction during the events are shown in figures introduced in Sect. 3.
The lower limit of the instrument, 10 nm of the particle diameter, created a challenge of interpreting both the event starting time and the event duration. In addition, it was not certain whether new particle formation actually initiated on-site or whether we detected solely an appearance of a grow-ing mode originatgrow-ing from particle formation that had oc-curred away from our station.
2.2.3 Growth rate calculations
Determining growth rates was not straightforward due to the unique nature of Antarctic events and we used several meth-ods to determine growth rate depending on the type of event. For most of the normal events the method developed by Hir-sikko et al. (2005) was used for determining growth rates. This method determines the particle growth by following the size class maximum. First, the times of the concentration maxima in each size class are defined. Then a line is fitted to the size class maximum times as function of size class di-ameter, and the slope of this line gives the growth rate. The
method is limited for events in which the growth can be fol-lowed to larger sizes.
In case the of the normal events for which the method by Hirsikko et al. (2005) did not work, and in the case of slowly growing events, the growth rates were determined by mode-fitting method or by fitting a curve to the calculated geometric mean diameter. The mode-fitting method is based on the log-normal modes fitted to each number size distribu-tion using the algorithm of Hussein et al. (2005). The method works by selecting the geometric mean diameter of the grow-ing nucleation mode based on visual inspection of the daily contour plots of the particle size distributions. The growth rate is then obtained by a linear least-squares fit to these se-lected nucleation mode mean diameters as function of time. Further details of this method can be found in Dal Maso et al. (2005), Yli-Juuti et al. (2011) and Kulmala et al. (2012). The method for calculating the growth rate from the geomet-ric mean diameter was similar to the method described above but used calculated geometric mean from measured data in-stead of mode data. In some cases two different methods of determining growth rate could be used for the same day and we had to choose the method that was qualitatively the best. The methods used for calculating the growth rate on each event day are given in Table 3. The errors of the growth rates were determined as the standard error of the linear fit.
2.2.4 Formation rate, vapor concentration and source rate
The formation rate of nucleation mode particles (in this case particles between 10 and 25 nm) was calculated from the measured number concentration in this size range by taking into account particle losses due to coagulation and conden-sational growth out of the size range. The formation rate of 10 nm particles,J10, can be written as (Dal Maso et al., 2005)
J10=
dN
dt +CoagS·N+ GR 1dp
·N, (1)
whereN is the particle number concentration of 10–25 nm particles, CoagS is the coagulation sink due to pre-existing aerosol particles and GR is the particle growth rate over the size range of width 1dp. Coagulation sink for nucleation
mode particles is calculated from the measured size distri-butions according to the method presented in Kulmala et al. (2012).
The condensational growth rate explained by certain vapor concentrationCvcan be calculated using the formula
(Niem-inen et al., 2010) GR=2·Kn·β
3·pv
·
8kT
π
·
1+dv dp
2
·
1
mp
+ 1 mv
1/2
·mv·Cv, (2)
wheremv,dvandρvare the vapor molecule mass, diameter
grow-ing particle andT the ambient temperature. Kn andβare the Knudsen number and the Fuchs–Sutugin transition regime correction factor for mass flux, respectively. Equation (2) can be used to calculate the vapor concentration required to ex-plain the observed particle growth rates. Assuming molecu-lar properties of sulfuric acid for the condensing vapor, the concentration of 107cm−3corresponds to the growth rate of 0.4 nm h−1for nucleation mode (10–25 nm) particles.
The source rateQv for the condensing vapor can be
cal-culated from the equation describing the evolution of vapor concentration:
dCv
dt =Qv−CS·Cv. (3)
In steady-state (dCv/dt=0) the vapor source rate is
Qv=CS·Cv. (4)
Here the condensation sink CS onto aerosol particles is cal-culated from the measured particle size distributions accord-ing to Kulmala et al. (2012).
2.2.5 Back-trajectory analysis
Air parcel 96 h back trajectories were calculated using us-ing the Hybrid Sus-ingle-Particle Lagrangian Integrated Tra-jectory (HYSPLIT) Model (Draxler and Rolph, NOAA Air Res. Lab., Silver Spring, Maryland, http://www.arl.noaa.gov/ ready/hysplit4.html). A GDAS meteorological dataset was used in the calculations. Back trajectories were calculated for arriving at three different heights: 100 m, 500 m and 1000 m above the ground level.
3 Results and discussion
3.1 General features and seasonal cycle
Over 81 000 size spectra were measured during the measure-ment period, from which over 76 000 size spectra were used in the data analysis. We calculated the statistics separately for the summer (December–February), autumn (March–May), winter (June–August) and spring (September–November) seasons. In summer, sunlight was present all the time, whereas the winter months were completely dark. The av-erage temperature in winter was−63◦C and in summer it was−36◦C.
A clear seasonal cycle of the particle number concentra-tions was seen in the number size distribution data (Figs. 1 and 2). The particle number concentrations were at their lowest in July and August and at the highest in January. In Fig. 1 the short peaks in the particle number size distribution are mainly contamination from the station (in non-cleaned dataset). However, we observed also natural peaks in the par-ticle number concentration, which indicated new parpar-ticle for-mation. Altogether during the measurement period, we ob-served 60 natural new particle formation days, from which
we could analyze particle formation and growth rates on 15 days as explained in detail in Sect. 3.2.
After cleaning the size distribution data, the total con-centration of measured particles larger than 10 nm varied from 4 to 1300 cm−3 and the median total concentration was 94 cm−3. The median particle concentrations were 20, 41 and 6 cm−3 in the nucleation, Aitken and accumulation modes, respectively. The geometric mean diameter of the measured particles varied from (5th and 95th percentile) 20 to 64 nm and the volume concentration varied from 0.004 to 0.140 µm3cm−3 (median value 0.033 µm3cm−3). The par-ticle number concentrations observed at Dome C are lower than those in coastal Antarctica. For instance at Neumayer, the median number concentration of 25 yr of CPC data was 258 cm−3 (Weller et al., 2011), which is 64 % higher than our measured median total concentration. Other coastal mea-surements in the summer have shown concentrations in the range of 300–1000 cm−3 (Ito, 1993; Gras, 1993). At the
South Pole, reported aerosol number concentrations were about 100–300 cm−3in summer and below 20 cm−3in win-ter (Shaw, 1988; Park et al., 2004). These values are close to the mean and average values measured at Dome C (Table 1). The seasonal cycle in the particle number concentration was similar to those observed at other Antarctic sites: high concentrations in summer and low in winter. The median number concentration was 260 cm−3 and 15 cm−3 in sum-mer and in winter, respectively (Table 1). At Neumayer the annual maximum number concentration of 1000 cm−3 was reported in March and the minimum number concentration of<100 cm−3was reported in June/July.
Weller et al. (2011) also detected a diurnal cycle in parti-cle number concentrations at Neumayer. For partiparti-cles larger than 7 nm, this cycle was present for the months September through April but absent from May through August. The ob-servations by Weller et al. (2011) do not differ much from our observations: at Dome C the diurnal cycle of particles larger than 10 nm was strongest in spring (September–November), not quite as strong in summer (December–February), and al-most absent in both autumn and winter (Fig. 3). Weller et al. (2011) noted that the observed diurnal cycle is consis-tent with a photo-chemically induced process. The vicinity of the sea with higher aerosol and precursor gas concentrations is probably also affecting the diurnal cycles at Neumayer, whereas at Dome C diurnal cycles are most probably only of photochemical origin.
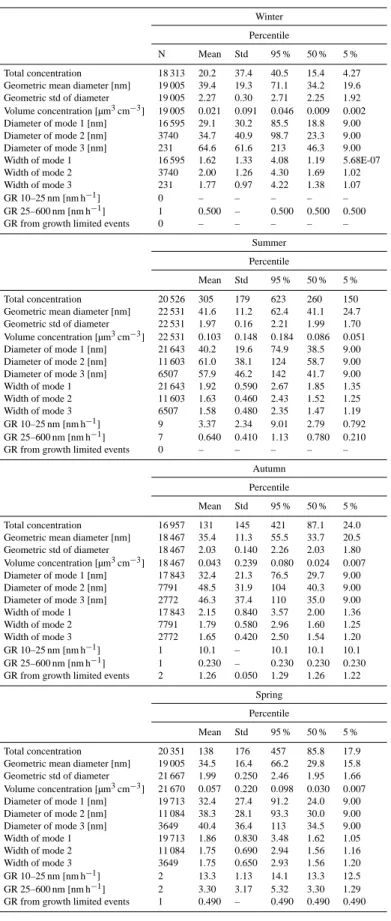
Table 1. Descriptive statistics of the total particle number concentration, geometric mean diameter and its geometric standard deviation, the
particle volume concentration, modal mean diameters and their geometric standard devation, and growth rates during the four seasons.
Winter
Percentile
N Mean Std 95 % 50 % 5 %
Total concentration 18 313 20.2 37.4 40.5 15.4 4.27 Geometric mean diameter [nm] 19 005 39.4 19.3 71.1 34.2 19.6 Geometric std of diameter 19 005 2.27 0.30 2.71 2.25 1.92 Volume concentration [µm3cm−3] 19 005 0.021 0.091 0.046 0.009 0.002 Diameter of mode 1 [nm] 16 595 29.1 30.2 85.5 18.8 9.00 Diameter of mode 2 [nm] 3740 34.7 40.9 98.7 23.3 9.00 Diameter of mode 3 [nm] 231 64.6 61.6 213 46.3 9.00 Width of mode 1 16 595 1.62 1.33 4.08 1.19 5.68E-07 Width of mode 2 3740 2.00 1.26 4.30 1.69 1.02 Width of mode 3 231 1.77 0.97 4.22 1.38 1.07 GR 10–25 nm [nm h−1] 0 – – – – –
GR 25–600 nm [nm h−1] 1 0.500 – 0.500 0.500 0.500
GR from growth limited events 0 – – – – –
Summer
Percentile
Mean Std 95 % 50 % 5 %
Total concentration 20 526 305 179 623 260 150 Geometric mean diameter [nm] 22 531 41.6 11.2 62.4 41.1 24.7 Geometric std of diameter 22 531 1.97 0.16 2.21 1.99 1.70 Volume concentration [µm3cm−3] 22 531 0.103 0.148 0.184 0.086 0.051
Diameter of mode 1 [nm] 21 643 40.2 19.6 74.9 38.5 9.00 Diameter of mode 2 [nm] 11 603 61.0 38.1 124 58.7 9.00 Diameter of mode 3 [nm] 6507 57.9 46.2 142 41.7 9.00 Width of mode 1 21 643 1.92 0.590 2.67 1.85 1.35 Width of mode 2 11 603 1.63 0.460 2.43 1.52 1.25 Width of mode 3 6507 1.58 0.480 2.35 1.47 1.19 GR 10–25 nm [nm h−1] 9 3.37 2.34 9.01 2.79 0.792
GR 25–600 nm [nm h−1] 7 0.640 0.410 1.13 0.780 0.210 GR from growth limited events 0 – – – – –
Autumn
Percentile
Mean Std 95 % 50 % 5 %
Total concentration 16 957 131 145 421 87.1 24.0 Geometric mean diameter [nm] 18 467 35.4 11.3 55.5 33.7 20.5 Geometric std of diameter 18 467 2.03 0.140 2.26 2.03 1.80 Volume concentration [µm3cm−3] 18 467 0.043 0.239 0.080 0.024 0.007
Diameter of mode 1 [nm] 17 843 32.4 21.3 76.5 29.7 9.00 Diameter of mode 2 [nm] 7791 48.5 31.9 104 40.3 9.00 Diameter of mode 3 [nm] 2772 46.3 37.4 110 35.0 9.00 Width of mode 1 17 843 2.15 0.840 3.57 2.00 1.36 Width of mode 2 7791 1.79 0.580 2.96 1.60 1.25 Width of mode 3 2772 1.65 0.420 2.50 1.54 1.20 GR 10–25 nm [nm h−1] 1 10.1 – 10.1 10.1 10.1 GR 25–600 nm [nm h−1] 1 0.230 – 0.230 0.230 0.230 GR from growth limited events 2 1.26 0.050 1.29 1.26 1.22
Spring
Percentile
Mean Std 95 % 50 % 5 %
Table 2. Descriptive statistics for data that came from the polluted sector.
Percentile
N Mean Std 95 % 50 % 5 %
Total concentration [cm−3] 5412 910 4250 2620 245 18.2 Geometric mean diameter [nm] 5411 37.1 16.2 62.2 34.7 18.4 Geometric std of diameter 5411 2.05 0.260 2.48 2.04 1.68 Volume concentration [µm3cm−3] 5413 0.210 0.634 0.941 0.070 0.008
Fig. 1. Time series of (a) the particle number size distribution, (b) total particle number concentration, (c) total particle number concentrations
in the nucleation, Aitken mode and accumulation mode size ranges, and (d) the total particle volume concentration.
work, yet the general level can be compared. They did not weigh the samples but analyzed them for the concentrations of major ionic constituents. In addition, they did not present the total concentrations but the concentrations of sea salt and its contribution to the sum of analyzed ions for particles with Dp<10 µm. The 3 yr average concentration of sea salt was
10.7 ng m−3 in summer and 58.8 ng m−3 in winter. The re-spective average contributions were 11.2 % and 84.3 %, so it can be calculated that in the data of Udisti et al. (2012), the average mass concentrations were∼96 ng m−3 in summer
and∼70 ng m−3in winter. The average volume
concentra-tions calculated from our DMPS data were 0.103 µm3cm−3 and 0.021 µm3cm−3in summer and winter, respectively (Ta-ble 1). If it is assumed that the particle density is that of water, 1 g cm−3, the mass concentrations were 103 ng m−3 and 21 ng m−3 in summer and winter, respectively. With the density of ammonium sulfate, 1.8 g cm−3, the concen-trations would be 185 ng m−3 in summer and 38 ng m−3 in
typ-Table 3. Particle growth rates (GR) and the standard error of the growth rate in the 10–25 nm size range, the derived formation rate (J10) and vapor concentrations (CV) required to explain the observed growth (the vapor is assumed to have properties of sulfuric acid) and condensation sink (CS) values during the particle formation. The methods used to determine growth rate were to fit a curve to the geometric mean diameter (A), to use the method presented by Hirsikko et al. (2005) (B), and to fit a curve to calculated mode data (C).
Date Method GR J10 CV CS
(nm h−1) (cm−3s−1) (107molec cm−3) (10−4s−1)
9.1.2008 B 4.6±1.3 0.023 10.5 2.1
10.1.2008 B 2.4±1.0 0.020 5.5 3.8
26.2.2008 B 3.4±1.9 0.022 7.9 1.7
3.3.2008 B 10.1±1.5 0.084 23.3 1.9
9.5.2008 A 1.3±0.4 0.0012 3.0 0.3
3.10.2008 A 0.5±0.02 0.0022 1.1 0.3
29.11.2008 B 12.5±1.6 0.083 28.8 1.7
29.11.2008 B 14.1±2.1 0.11 32.5 2.2
11.12.2008 C 4.6±0.6 0.030 10.6 2.3
20.12.2008 C 0.8±0.07 0.053 1.8 2.5
23.12.2008 C 3.1±0.9 0.016 7.1 1.8
30.1.2009 B 1.6±0.2 0.041 3.6 2.5
22.2.2009 B 1.7±0.3 0.0043 3.9 1.0
24.2.2009 B 2.5±0.2 0.017 5.7 1.7
11.3.2009 B 1.2±0.3 0.071 2.8 1.5
Average 4.3 0.038 9.9 1.8
Median 2.5 0.023 5.7 1.8
Std 4.4 0.034 10.0 0.9
Fig. 2. The annual cycle of (a) total number concentration and (b)
volume concentration. The red bars present the median value of vol-ume concentration, the blue box the 25th and 75th percentiles and the black bars the 5th and 95th percentiles.
Fig. 3. The diurnal cycle of total number concentration in (a)
sum-mer, (b) winter, (c) autumn and (d) spring. Red bars present the median value of total concentration, blue box the 25th and 75th per-centile and black bars the 5th and 95th perper-centile.
Fig. 4. The seasonal fractals of particle number size distributions (a)
in winter (June–August) and (b) in summer (December–February). The black line represents the median concentration, the solid blue line the 25th percentile, the dashed blue line the 5th percentile, the solid red line the 75th percentile and the dashed red line the 95th percentile.
seasonal cycle with a summer maximum and winter mini-mum.
To further visualise the differences in the size distributions between the summer and winter, simple descriptive statistics were calculated, i.e., cumulative concentrations in each size channel of the data (Fig. 4). Figure 4 shows clearly that the modes of the size distributions were smaller in winter than in summer. In winter the mode of the median size distribution was at about 20 nm and in summer at about 40 nm. We also found that in summer particle number concentrations were higher in every size class.
3.2 Modal structure of measured particle size spectra
We studied the modal structure of the particle size distri-butions by using the automatic mode-fitting algorithm dis-cussed above. We compared the modes calculated with the algorithm to measured particle size distribution data (Fig. 5). The cumulative sum of the fitted modes matched the mea-sured size distribution well, both in the case where there are three modes present as well as when only one mode was ob-served.
We wanted to study the occurrence of the fitted modes and at which sizes the modes are fitted (median diameter of modes). If one mode was present, the median diameter of the fitted mode was 19 nm in the winter and 39 nm in the summer. When two or more modes were present, particles were found in smaller sizes. This indicates that the strongest new particle formation events occurred in summer and, as explained above, the growth did not reach sizes of the accu-mulation mode. Also in winter when the second and the third mode had the same median values, particles were found in smaller sizes when three modes were observed than when only one or two modes were observed.
Figure 6 shows the relative frequency of the modes cal-culated by the automatic algorithm and how they fit to the nucleation mode, Aitken mode and the accumulation mode size range. We calculated the relative frequency by summing
Fig. 5. Measured particle number size distribution (grey dots) and
calculated modes with mode fitting algorithm (Hussein et al., 2005). In (a) three modes were present on 3 March 2008 and in (b) one mode was present on 6 January 2008.
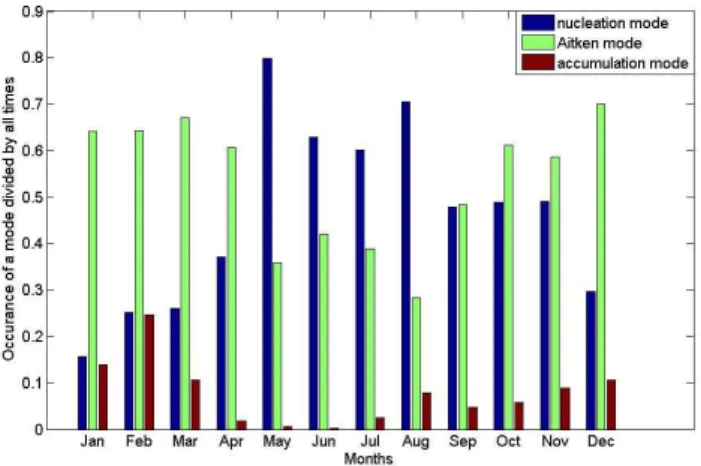
Fig. 6. Fraction of times, when one or more modes were found in
the nucleation, Aitken or accumulation mode size ranges. If two or more modes were found in the same size range, the fractions of modes were added together.
up the occurrence of the modes in the nucleation, Aitken and accumulation size range in each month and dividing it with the number of modes in each month. When the particle number concentration was low (in winter), most of the time only one mode was present. When the new particle forma-tion took place or particle number concentraforma-tions were high, usually three modes were found. The automatic algorithm fitted most of the modes in nucleation mode or Aitken size range. We found that most of the modes were in the nucle-ation size range from May to August when the total concen-trations were the lowest, whereas other months most of the modes were in the Aitken size range. The occurrence of fit-ted modes in the accumulation size range was the highest during winter months when nucleation was most frequently observed and the particles were also able to grow to bigger sizes. This all indicates that the particles in the high Antarc-tic east-plateau air are small and that they are growing either slowly or not at all.
3.3 New particle formation and growth
Fig. 7. Event classification from the whole period given as the
monthly percentage of the class 1 event days (dark blue), class 2 event days (light blue), apple event days (green), undefined days (orange) and non-event days (dark red).
et al., 2008), undefined days and non-event days (Fig. 7). Before the analysis the contamination events were excluded from the event days (Fig. 8). We observed event days mainly in the Antarctic summer, and the event frequency was peak-ing in November and February. In 22 February percent of the days were event days. The month with the lowest occurrence of events was July when we observed events in 4 percent of the days. Most of the events belonged to the class 2, which means that the particle growth rate could not be determined. We observed class 1 events during all the summer months and also in March, May, October and November. The high-est fraction of class 1 events was observed in November and December, roughly 7 % of all the days were event days. The fraction of undefined days varied from 0 to 29 percent, the highest percentage being in November. The fraction of non-event days varied from 46 to 95 percent.
To further analyze the different events, we divided the class 1 events into “normal” events and “slowly growing” events. By normal event we mean similar kinds of events that have been observed practically all over the world in dif-ferent environments (Kulmala et al., 2004), whereas slowly growing event are characterized by the continuous and slow particle growth of up to several days. Nine of the 13 normal events (for an example see Fig. 9) were observed during the Antarctic summer. The continuous growth of the nucleated particles during several hours suggests that the new particle formation occurs in an area that is from tens of kilometres up to hundreds of kilometres wide, depending on the wind conditions. Since the distance from Dome C to the nearest coastline is several hundred kilometres, this means that the newly formed particles were growing when the measured air masses were already over the plateau of Antarctica.
Apple events took place in most of the months, excluding winter months and we observed them during 0 to 7 percent of
Fig. 8. Examples of quality check of the event analysis. In cases (a)
and (b) the upper figure shows particle number size distributions and fitted mode (black dots) during two days before an event and the event day, and the lower figure represents the wind direction (dots) and wind speed (blue line) from the same period. The shaded area represents the contaminated wind direction sector. Dashed lines rule the area of wind direction where most of the clean events come. Event (a) was a real event and event (b) was excluded.
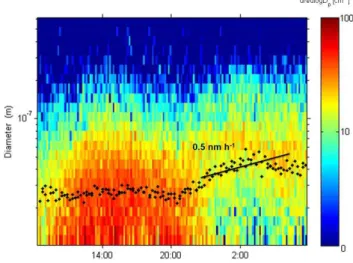
Fig. 9. New particle formation event on 29 November 2008. Black
dots represent the calculated geometric mean diameter and red dots the maximum of mode. Black lines are the fitted slopes where growth rate was determined. Slope (a) is fitted to the geometric mean and slope (b) to the maximum of modes. The methods rep-resented here work in the different parts of the growth. The growth rate (b) was used in to describe the early growth of the particles and the growth rate (a) the later growth. The time axis is in UTC+8 h.
At Dome C there were two kinds of events that have not been often observed at other locations. These were the slowly growing events mentioned above and wintertime events (Fig. 10). From the slowly growing events, particle growth rates could be calculated and the growth could be fol-lowed for up to three days. The winter events took place in the Antarctic winter when sunlight was not present and parti-cle concentrations were extremely low. Some previous stud-ies have also reported on night-time events taking place in the absence of solar radiation (e.g. Junninen et al., 2008; Suni et al., 2008), but the exact mechanisms and vapors involved are yet unclear (Ortega et al., 2012). Also the duration of the night-time events reported by Junninen et al. (2008) and Suni et al. (2008) were shorter than the winter events observed in our study. While it is possible that the particle formation in Antarctic dark winter has a connection to these night-time dark events, it seems still more likely that the mechanism in this specific environment is unique.
We studied the beginning times of the observed class 1 and class 2 events in local time. We used as a local time UTC+ 8 h. About 38 % of the observed events started during morn-ing hours (06:00–10:00), similarly to other observed events in boreal forests and other surroundings. In winter, two out of three events started at around 20:00, while all the other events started at 08:00. Events starting in the evening were observed also during other seasons. In summer, spring and autumn 25 %, 38 % and 36 % of the events, respectively, started after 17:00. Four nocturnal events were observed: three in spring and one in autumn.
Growth rates and statistics were calculated for all the class 1 events (Table 3) and for each event type: for normal events
Fig. 10. New particle formation event during dark time in Antarctic
winter on 11 June 2008. Black dots represent the calculated geo-metric mean diameter and black line the fitted slope where growth rate for 25–600 nm was determined. Notice the different color scale. The time axis is in UTC+8 h.
in the size ranges of 10–25 nm and 25–100 nm and for slowly growing events in the size range of 10–25 nm (Fig. 11). We were unable to determine the growth rate in the size range of 25–100 nm for either slowly growing events or winter events, since the growth could not be followed above 25 nm in those cases. The statistics were calculated season-wise.
The growth rate of all the class 1 events varied from 0.5 to 14 nm h−1 in the size range 10–25 nm, and the median
growth rate was 2.5 nm h−1 based on 15 events (Table 3).
These values are comparable to those usually observed in continental rural and clean sites (e.g. Kulmala et al., 2004; Manninen et al., 2010; Asmi et al., 2011). Most of the class 1 events were normal events. We were able to determine the growth rate statistics of normal events only for summer when the growth rate varied from 0.8 to 4.6 nm h−1with the me-dian of 2.5 nm h−1. In spring we were able to derive only two growth rates and in autumn only one growth rate from the total of 25 events observed during those seasons, but all being of unusually high values in Antarctica. The median growth rate of normal events in the size range of 25 to 100 nm was 0.8 nm h−1. For the slowly growing events the median growth rate was 1.0 nm h−1, indicating low concentrations of condensable gases. The mean standard error of the derived growth rates was 21 %, which means that exact quantifica-tion of growth rates is difficult, but nevertheless we are able to prove that faster growth of the early nucleation mode is present.
The formation rates of 10 nm particles, J10, of the class
Fig. 11. Seasonal growth rate statistics for (a) the growth rates of
normal events in the size range of 10–25 nm, (b) the growth rates of normal events in the size range of 25–600 nm and (c) the growth rates determined from the slowly growing events. The seasons were winter (June, July, August), spring (September, October, Novem-ber), summer (December, January, February) and autumn (March, April, May). Concerning the normal events in the size class of 10 to 25 nm, the growth rate statistics for spring were determined from two cases, for summer from 10 cases and for autumn from one case. Concerning the normal events in the size class of>25 nm, the growth rate statistics for winter were determined from one case, for spring from two cases, for summer from seven cases and for autumn from one case. Concerning the slowly growing events, the growth rate for spring was determined from one case and for autumn from two cases.
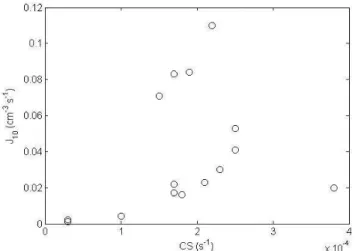
Aboa or at a boreal forest site in Hyyti¨al¨a, Finland (Table 4). The value of the condensation sink varied from 0.00003 to 0.00038 s−1 with the median of 0.00018 s−1 in Dome C. These values are similar to those observed in Aboa, but about a magnitude lower than those observed in Hyyti¨al¨a (Table 4). Figure 12 shows the relation between the average values of J10and CS during the class 1 events. There seems to an
over-all tendency of more intense new particle formation at higher values of the condensation sink. Since the condensation sink is closely related to the aerosol surface area and submicron aerosol mass concentration, this connection might suggest that the air masses having more particulate matter have also more vapors participating in new particle formation.
It is unknown which vapors condenses onto newly formed aerosol particles and make them grow (e.g. Riipinen et al., 2011). Since sulfuric acid is very likely involved in new par-ticle formation and early growth, we used Eq. (2) here to es-timate how high sulfuric acid concentration would be needed for explaining the observed growth. The calculated vapor concentrations in the 15 class 1 events varied from 1.1 to 32×107cm−3with the median of 5.7×107cm−3. Mauldin et al. (2001, 2004) measured sulfuric acid concentration at the South Pole in the Antarctic summer. The median concen-tration was 2.7×105cm−3. If sulfuric acid concentrations at
Dome C are similar to those in the South Pole, this compound can explain only a small fraction of the particle growth rate in there.
Fig. 12. The formation rate of 10 nm particles as a function of the
condensation sink for the class1 events.
3.4 Origins and atmospheric pathways of particles reaching Dome C during nucleation events
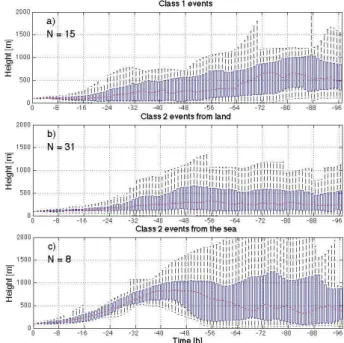
In order to study the origin and possible transport pathways of particles reaching the Dome C station during class 1 and class 2 nucleation events, we calculated 4-day back trajec-tories that arrived at the station at the starting times of all the class 1 and class 2 events. The trajectories were calcu-lated for three heights: 100 m, 500 m and 1000 m above the ground level. All of the calculated back trajectories for the class 1 event days came from inland, as well as the major-ity of all the calculated class 2 back trajectories. Most of the inland trajectories travelled close to the South Pole. The tra-jectories travelled a median distance of 1400 km during last four days before arriving at the measurement station.
It has been shown that a strong inversion is present at Dome C station throughout the year, except in December and January (Busetto et al., 2013; Genthon et al., 2010; Hudson and Brandt, 2005). In order to determine whether the mea-sured air masses came from the inversion layer, we studied the vertical profiles of the back trajectories calculated to ar-rive at height 100 m (Fig. 13). The majority of the class 1 event back trajectories (Fig. 13a) and class 2 event back tra-jectories from the sea (Fig. 13c) originated at altitudes higher than 400 m that is above the inversion layer (Busetto et al., 2013). The shapes of the vertical profiles of the back tra-jectories are explainable with the circulation induced by the Antarctic drainage flow (James, 1989), resulting in that the origin of the particles measured during the class 1 events and some of the class 2 events were from the upper troposphere. In such circulation, air from upper troposphere is transported down to boundary layer in the central parts of Antarctica and then transported towards the coast by katabatic winds.
Table 4. The comparison of growth rate (GR), formation rate (J10) and condensation sink (CS) between Dome C, Aboa and Hyyti¨al¨a. The Aboa values represent the medians and ranges during the new particle formation events in January, 2010 (Kyr¨o et al., 2013). The GR values from Hyyti¨al¨a are the median and 10th to 90th percentile range of 809 new particle formation events, the value of CS value is the geometric mean of CS during these events, andJ10 represents the median 10 nm particle formation rate (Dal Maso et al., 2007).
Dome C Aboa Hyyti¨al¨a
GR (nm h−1) 2.5 5.5 (1.8–8.8) 2.5 (1.1–5.3) J10(cm−3s−1) 0.023 0.2 (0.003–0.3) 0.4
CS (s−1) 0.00018 0.00040 0.0017
from the inversion layer. Since the air mass travelled a dis-tance of ∼1000 km, we can rule out that the events were caused by contamination from the station that would have stayed in the inversion layer. However it is possible that the some of the class 2 events occurred locally somewhere fur-ther, and that we observed at Dome C those parts of the events that were preserved in the inversion layer. A further study of the origin of the particles observed at nucleation event days is not possible in the framework of this study. Based on older studies, we can speculate that the majority of the compounds reaching Dome C originate from the sea. Cosme et al. (2005) reported that oceans contribute more than 90 % of the sulphate measured at Vostok station, close to Dome C. They also reported that volcanoes and anthro-pogenic sources contribute relatively more to the sulphate in inland than at coast. This might also be the case at Dome C due to the Antarctic circulation, supported by Fig. 13a and c.
4 Conclusions
We observed a clear seasonal cycle in the particle number concentrations, similar to that reported for other Antarctic stations. However, this study was the first one that presents the seasonal cycle of the frequency of the main three modes of the aerosol submicron number size distributions: the nu-cleation, Aitken and accumulation mode. An automatic algo-rithm was used to calculate modes from the particle size dis-tribution data. The automatically fitted modes were located mainly in the nucleation and Aitken size ranges. Overall, the great majority of the particles were found in sizes below 100 nm of particle diameter, which is probably due to small amount of condensable vapours.
New particle formation events were observed in every month, and this phenomenon was most frequent during the summer months. A new finding was the winter events, which was not expected as there is no sunlight during winter. The apparent growth of particles during the winter events was limited, so we were not able to determine particle growth rates at sizes below 25 nm. Another interesting finding was
Fig. 13. Calculated 4-day back trajectories for class 1 events (a),
class 2 events arriving from land (b) and class 2 events arriving from the sea (c). Time is hours to the past from the beginning of the event and height is in a.g.l. The red horizontal lines mark the median height, the edges of the blue boxes the 25th and 75th percentile and the black pillars the 5th and 95th percentile. The numberN indi-cates the number of trajectories used for statistics calculations. All the trajectories in (a), (b) and (c) are calculated to arrive at height 100 m a.g.l.
the presence of slowly growing events, for which a contin-uous particle growth was evident during several consecutive days.
Analyzing the new particle formation events and cal-culating growth rates was not straight forward. Our size-distribution measurements started from 10 nm, which means that the beginning of the nucleation was not detected. The median growth rate we determined for the class 1 events in the size range of 10 to 25 nm, as well as the frequency of event days during the summer, was similar to that measured at coastal station Aboa (Asmi et al., 2010). This indicates that there is not a very significant difference in the growth rates between these two sites, which is somewhat surprising, con-sidering that Aboa is close to the ocean that is the source of most condensable compounds in the region, whereas Dome C is high above the ocean and far away from the coast. In future, to better classify new particle formation events and calculate growth rates, it is crucial to be able to measure par-ticle properties at sizes smaller than 10 nm.
au-tumn until spring. In Ny- ˚Alesund this background is cen-tered between about 100 and 200 nm of particle diameter, consisting mainly of long-range transported primary parti-cles from anthropogenic sources. In Dome C the background is centered below 30 nm, suggesting that these particles have been formed in the atmosphere before entering the continen-tal Antarctica. At both sites, late spring and summer are char-acterized by active new particle formation with subsequent particle growth up to the sizes of cloud condensation nuclei (>50–100 nm). In Ny- ˚Alesund this process starts when the anthropogenic background is still present, eventually replac-ing the background particles altogether durreplac-ing the summer. In air masses entering Dome C, new particle formation and growth simply strengthen toward the summer, taking place more frequently close to the measurement site, and produc-ing both more numerous and larger particles than in winter.
Acknowledgements. This research was supported by the Academy of Finland (Center of Excellence program, project number 127534, and Finnish Antarctic Research Program, decision nrs. 264375 and 264390), by the Nordic Top-level Research Initiative (TRI) Cryosphere–Atmosphere Interactions in a Changing Arctic Climate (CRAICC) and by the Italian “Programma Nazionale di Ricerche in Antartide” (PNRA) and developed as a sub-project 2010/A3.05 “Effetti radiativi diretti di aerosol e nubi sul clima alle alte latitudini: una prospettiva bipolare (DECA-POL)”.
Meteorological data used in this study were obtained from the “RMO – Osservatorio Climatologico” of the Programma Nazionale di Ricerche in Antartide (PNRA) (http://www.climantartide.it).
Edited by: J. B¨ack
References
Asmi, E., Frey, A., Virkkula, A., Ehn, M., Manninen, H. E., Ti-monen, H., Tolonen-Kivim¨aki, O., Aurela, M., Hillamo, R., and Kulmala, M.: Hygroscopicity and chemical composition of Antarctic sub-micrometre aerosol particles and observations of new particle formation, Atmos. Chem. Phys., 10, 4253–4271, doi:10.5194/acp-10-4253-2010, 2010.
Asmi, E., Kivek¨as, N., Kerminen, V.-M., Komppula, M., Hyv¨arinen, A.-P., Hatakka, J., Viisanen, Y., and Lihavainen, H.: Secondary new particle formation in Northern Finland Pallas site between the years 2000 and 2010, Atmos. Chem. Phys., 11, 12959–12972, doi:10.5194/acp-11-12959-2011, 2011.
Becagli, S., Scarchilli, C., Traversi, R., Dayan, U., Severi, M., Frosini, D., Vitale, V., Mazzola, M., Lupi, A., Nava, S., and Ud-isti, R.: Study of present-day sources and transport processes af-fecting oxidised sulphu r compounds in atmospheric aerosols at Dome C (Antarctica) from year-round sampling campaigns, At-mos. Environ., 52, 98–108, 2012.
Belosi, F., Contini, D., Donateo, A., Santachiara, G., and Prodi, F.: Aerosol size distribution at Nansen Ice Sheet Antarctica, Atmos. Res., 107, 42–50, 2012.
Busetto, M., Lanconelli, C., Mazzola, M., Lupi, A., Petkov, B., Vi-tale, V., Tomasi, C., Grigioni, P., and Pellegrini, A.:
Parameteri-zation of clear sky effective emissivity under surface-based tem-perature inversion at Dome C and South Pole, Antarctica, Antarc-tic Science, Cambridge Univ Press, 1–14, 2013.
Charlson, R. J. and Wigley, T. M. L.: Sulphate aerosol and climatic change, Sci. Am., 270, 48–57, 1994.
Cosme, E., Hourdin, F., Genthon, C., and Martinerie, P.: Ori-gin of dimethylsulfide, non-sea-salt sulfate, and methanesul-fonic acid in eastern Antarctica, J. Geophys. Res., 110, D03302, doi:10.1029/2004JD004881, 2005.
Dal Maso, M., Kulmala, M., Riipinen, I., Wagner, R., Hussein, T., Aalto, P. P., and Lehtinen, K. E. J.: Formation and growth of fresh atmospheric aerosols: eight years of aerosol size distribution data from SMEAR II, Hyyti¨al¨a, Finland, Boreal Env. Res., 10, 323– 336, 2005.
Dal Maso, M., Sogacheva, L., Aalto, P. P., Riipinen, I., Komp-pula, M., Tunved, P., Korhonen, L., Suur-Uski, V., Hirsikko, A., Kurt´en, T., Kerminen, V.-M., Lihavainen, H., Viisanen, Y., Hans-son, H.-C., and Kulmala, M.: Aerosol size distribution measure-ments at four Nordic field stations: identification, analysis and trajectory analysis of new particle formation bursts, Tellus B, 59, 350–361, 2007.
Ehn, M., Vuollekoski, H., Pet¨aj¨a, T., Kerminen, V.-M., Vana, M., Aalto, P. P., de Leeuw, G., Ceburnis, D., Dupuy, R., O’Dowd, C. D., and Kulmala, M.: Growth rates during coastal and marine new particle formation in western Ireland, J. Geophys. Res., 115, D18218, doi:10.1029/2010JD014292, 2010.
Fiebig, M., Lunder. C. R., and Stohl, A.: Tracing biomass burning aerosol from South America to Troll Research Station, Antarctica, Geophys. Res. Lett., 36, L14815, doi:10.1029/2009GL038531, 2009.
Forster, P., Ramaswamy, V., Artaxo, P., Berntsen, T., Betts, R., Fa-hey, D. W., Haywood, J., Lean, J., Lowe, D. C., Myhre, G., Nganga, J., Prinn, R., Raga, G., Schulz, M., and Van Dorland, R.: Cheanges in Atmospheric Constituents and in Radiative Forcing. In: Climate Change 2007: The Physical Science Basis. Contri-bution of Working Group I to the Fourth Assessment Report of the Intergovernmental Panel on Climate Change, edited by: S. Solomon, D. Qin, M. Manning, Z. Chen, M. Marquis, K. B. Av-eryt, M. Tignor and H. L. Miller, Cambridge University Press, Cambridge, United Kingdom and New York, NY, USA, 2007. Genthon, C., Town, M. S., Six, D., Favier, V., Argentini,
S., and Pellegrini, A.: Meteorological atmospheric bound-ary layer measurements and ECMWF analyses during sum-mer at Dome C, Antarctica, J. Geophys. Res., 115, D05104, doi:10.1029/2009JD012741, 2010.
Ghan, S. J., Liu, X., Easter, R. C., Zaveri, R., Rasch, P. J., and Yoon, J.-H.: Toward a minimal representation of aerosols in climate models: Comparative decomposition of aerosol direct, semidi-rect, and indirect effects, J. Climate, 25, 6461–6476, 2012. Gras, J. L.: Condensation nucleus size distribution at Mawson,
Antarctica: Microphysics and chemistry, Atmos. Environ., 27, 1417–1425, 1993.
Hansen, G., Aspmo, K., Berg, T., Edvardsen, K., Fiebig, M., Kallen-born, R., Krognes, T., Lunder, C., Stebel, K., Schmidbauer, N., Solberg, S., and Yttri, K. E.: Atmospheric monitoring at the Norwegian Antarctic station Troll: measurement programme and first results, Polar Res., 28, 353–363, 2009.
of ultrafine particle volatility in the coastal Antarctic troposphere, Atmos. Chem. Phys., 11, 9803–9812, doi:10.5194/acp-11-9803-2011, 2011.
Hirsikko, A., Laakso, L., H˜orrak, U., Aalto, P. P., Kerminen, V.-M., and Kulmala, M.: Annual and size dependent variation of growth rates and ion concentrations in boreal forest, Boreal Env. Res., 10, 357–369, 2005.
Hudson, S. R. and Brandt, R. E.: A Look at the Surface-Based Tem-perature Inversion on the Antarctic Plateau, J. Climate, 18, 1673– 1696, 2005.
Hussein, T., Dal Maso, M., Pet¨aj¨a, T., Koponen, I., Paatero, P., Aalto, P., H¨ameri, K., and Kulmala M.: Evaluation of an auto-matic algorithm for fitting the particle number size distributions, Boreal Env. Res., 10, 337–355, 2005.
Ito, T.: Size distribution of Antarctic submicron aerosols, Tellus, 45B, 145–159, 1993.
James, I. N.: The Antarctic drainage flow: Implications for hemi-spheric flow on the Southern Hemisphere. Antarct. Sci., 1, 279– 290. 1989.
Junninen, H., Hulkkonen, M., Riipinen, I., Nieminen, T., Hirsikko, A., Suni, T., Boy, M., Lee, S.-H., Vana, M., Tammet, H., Kermi-nen, V.-M., and Kulmala, M.: Observations on nocturnal growth of atmospheric clusters, Tellus B, 60, 365–371, 2008.
Kazil, J., Stier, P., Zhang, K., Quaas, J., Kinne, S., O’Donnell, D., Rast, S., Esch, M., Ferrachat, S., Lohmann, U., and Feichter, J.: Aerosol nucleation and its role for clouds and Earth’s ra-diative forcing in the aerosol-climate model ECHAM5-HAM, Atmos. Chem. Phys., 10, 10733–10752, doi:10.5194/acp-10-10733-2010, 2010.
Kerminen, V.-M., Pet¨aj¨a, T., Manninen, H. E., Paasonen, P., Niem-inen, T., Sipil¨a, M., JunnNiem-inen, H., Ehn, M., Gagn´e, S., Laakso, L., Riipinen, I., Vehkam¨aki, H., Kurten, T., Ortega, I. K., Dal Maso, M., Brus, D., Hyv¨arinen, A., Lihavainen, H., Lepp¨a, J., Lehtinen, K. E. J., Mirme, A., Mirme, S., H˜orrak, U., Berndt, T., Stratmann, F., Birmili, W., Wiedensohler, A., Metzger, A., Dommen, J., Baltensperger, U., Kiendler-Scharr, A., Mentel, T. F., Wildt, J., Winkler, P. M., Wagner, P. E., Petzold, A., Minikin, A., Plass-D¨ulmer, C., P¨oschl, U., Laaksonen, A., and Kulmala, M.: Atmospheric nucleation: highlights of the EUCAARI project and future directions, Atmos. Chem. Phys., 10, 10829–10848, doi:10.5194/acp-10-10829-2010, 2010.
Koponen, I., Virkkula, A., Hillamo, R., Kerminen, V.-M., and Kul-mala, M.: Number size distributions and concentrations of the continental summer aerosols in Queen Maud Land, Antarctica, J. Geophys. Res., 108, 4587, doi:10.1029/2003JD003614, 2003. Kulmala, M., Vehkam¨aki, H., Pet¨aj¨a, T., Dal Maso, M., Lauri, A., Kerminen, V.-M., Birmili, W., and McMurry P. H.: Formation and growth rates of ultrafine atmospheric particles: A review of observations, J. Aerosol Sci., 35, 143–176, 2004.
Kulmala, M., Lehtinen, K. E. J., and Laaksonen, A.: Cluster activa-tion theory as an explanaactiva-tion of the linear dependence between formation rate of 3 nm particles and sulphuric acid concentration, Atmos. Chem. Phys., 6, 787–793, doi:10.5194/acp-6-787-2006, 2006.
Kulmala, M., Pet¨aj¨a, T., Nieminen, T., Sipil¨a, M., Manninen, H. E., Lehtipalo, K., Dal Maso, M., Aalto, P. P., Junninen, H., Paasonen, P., Riipinen, I., Lehtinen, K. E. J., Laakso-nen, A., and KermiLaakso-nen, V.-M.: Measurement of the nucleation of atmospheric aerosol particles, Nat. Protoc., 7, 1651–1667,
doi:10.1038/nprot.2012091, 2012.
Kyr¨o, E.-M., Kerminen, V.-M., Virkkula, A., Dal Maso, M., Parsh-intsev, J., Ru´ız-Jimenez, J., Forsstr¨om, L., Manninen, H. E., Riekkola, M.-L., Heinonen, P., and Kulmala, M.: Antarctic new particle formation from continental biogenic precursors, Atmos. Chem. Phys., 13, 3527–3546, doi:10.5194/acp-13-3527-2013, 2013.
Makkonen, R., Asmi, A., Kerminen, V.-M., Boy, M., Arneth, A., Hari, P., and Kulmala, M.: Air pollution control and decreas-ing new particle formation lead to strong climate warmdecreas-ing, At-mos. Chem. Phys., 12, 1515–1524, doi:10.5194/acp-12-1515-2012, 2012.
Manninen, H. E., Nieminen, T., Asmi, E., Gagn´e, S., H¨akkinen, S., Lehtipalo, K., Aalto, P., Vana, M., Mirme, A., Mirme, S., H˜orrak, U., Plass-D¨ulmer, C., Stange, G., Kiss, G., Hoffer, A., T¨oro, N., Moerman, M., Henzing, B., de Leeuw, G., Brinken-berg, M., Kouvarakis, G. N., Bougiatioti, A., Mihalopoulos, N., O’Dowd, C., Ceburnis, D., Arneth, A., Svenningsson, B., Swi-etlicki, E., Tarozzi, L., Decesari, S., Facchini, M. C., Birmili, W., Sonntag, A., Wiedensohler, A., Boulon, J., Sellegri, K., Laj, P., Gysel, M., Bukowiecki, N., Weingartner, E., Wehrle, G., Laakso-nen, A., Hamed, A., Joutsensaari, J., Pet¨aj¨a, T., KermiLaakso-nen, V.-M., and Kulmala, M.: EUCAARI ion spectrometer measurements at 12 European sites – analysis of new particle formation events, Atmos. Chem. Phys., 10, 7907–7927, doi:10.5194/acp-10-7907-2010, 2010.
Mauldin III, R., Eisele, F., Tanner, D., Kosciuch, E., Shetter, R., Lefer, B., Hall, S., Nowak, J., Buhr, M., Chen, G., Wang, P., and Davis, D.: Measurements of OH, H2SO4, and MSA at the South Pole during ISCAT, Geophys. Res. Lett., 28, 3629–3632, 2001. Mauldin, R. L., Kosciuch, E., Henry, B., Eisele, F., Shetter, R.,
Lefer, B., Chen, G., Davis, D., Bandy, A. and Thornton, D.: Measurements of OH, HO2+ RO2, H2SO4, and MSA at the South Pole during ISCAT 2000, Atmos. Environ., 38, 5423– 5437, 2004.
Nieminen, T., Lehtinen, K. E. J., and Kulmala, M.: Sub-10 nm par-ticle growth by vapor condensation – effects of vapor molecule size and particle thermal speed, Atmos. Chem. Phys., 10, 9773– 9779, doi:10.5194/acp-10-9773-2010, 2010.
O’Dowd, C. D., Lowe, J. A., Smith, M. H., Davison, B., Hewitt, C. N., and Harrison, R. M.: Biogenic sulphur emissions and inferred non-sea-salt-sulphate cloud condensation nuclei in and around Antarctica, J. Geophys. Res., 102, 12839–12854, 1997. Ortega, I. K., Suni, T., Boy, M., Gr¨onholm, T., Manninen, H. E.,
Nieminen, T., Ehn, M., Junninen, H., Hakola, H., Hell´en, H., Valmari, T., Arvela, H., Zegelin, S., Hughes, D., Kitchen, M., Cleugh, H., Worsnop, D. R., Kulmala, M., and Kerminen, V.-M.: New insights into nocturnal nucleation, Atmos. Chem. Phys., 12, 4297–4312, doi:10.5194/acp-12-4297-2012, 2012.
Park, J., Sakurai, H., Vollmers, K., and McMurry, P. H.: Aerosol size distributions measured at the South Pole during ISCAT, Atmos. Environ., 38, 5493–5500, 2004.
Pant, V., Siingh, D., and Kamra, A. K.: Size distribution of at-mospheric aerosols at Maitri, Antarctica, Atmos. Environ., 45, 5138–5149, 2011.
doi:10.5194/acp-9-7435-2009, 2009.
Quaas, J., Ming, Y., Menon, S., Takemura, T., Wang, M., Penner, J. E., Gettelman, A., Lohmann, U., Bellouin, N., Boucher, O., Sayer, A. M., Thomas, G. E., McComiskey, A., Feingold, G., Hoose, C., Kristj´ansson, J. E., Liu, X., Balkanski, Y., Donner, L. J., Ginoux, P. A., Stier, P., Grandey, B., Feichter, J., Sednev, I., Bauer, S. E., Koch, D., Grainger, R. G., Kirkev˚ag, A., Iversen, T., Seland, Ø., Easter, R., Ghan, S. J., Rasch, P. J., Morrison, H., Lamarque, J.-F., Iacono, M. J., Kinne, S., and Schulz, M.: Aerosol indirect effects – general circulation model intercom-parison and evaluation with satellite data, Atmos. Chem. Phys., 9, 8697–8717, doi:10.5194/acp-9-8697-2009, 2009.
Riipinen, I., Pierce, J. R., Yli-Juuti, T., Nieminen, T., H¨akkinen, S., Ehn, M., Junninen, H., Lehtipalo, K., Pet¨aj¨a, T., Slowik, J., Chang, R., Shantz, N. C., Abbatt, J., Leaitch, W. R., Kerminen, V.-M., Worsnop, D. R., Pandis, S. N., Donahue, N. M., and Kul-mala, M.: Organic condensation: a vital link connecting aerosol formation to cloud condensation nuclei (CCN) concentrations, Atmos. Chem. Phys., 11, 3865–3878, doi:10.5194/acp-11-3865-2011, 2011.
Samson, J. A. , Barnard, S. C., Obremski, J. S., Riley, D. C., Black, J. J., and Hogan, A. W.: On the systematic variation in surface aerosol concentration at the South Pole, Atmos. Res., 25, 385– 396, 1990.
Shaw, G. E.: Antarctic aerosols: a review, Rev. Geophys., 26, 89– 112, 1988.
Sipil¨a, M., Berndt, T., Pet¨aj¨a, T., Brus, D., Vanhanen, J., Stratmann, F., Petakoski, J., Mauldin, L., Hyv¨arinen, A.-P., Lihavainen, H., and Kulmala, M.: The Role of Sulphuric Acid in Atmospheric Nucleation, Science, 327, 1243–1246, 2010.
Suni, T., Kulmala, M., Hirsikko, A., Bergman, T., Laakso, L., Aalto, P. P., Leuning, R., Cleugh, H., Zegelin, S., Hughes, D., van Gorsel, E., Kitchen, M., Vana, M., H˜orrak, U., Mirme, S., Mirme, A., Sevanto, S., Twining, J., and Tadros, C.: Formation and characteristics of ions and charged aerosol particles in a na-tive Australian Eucalypt forest, Atmos. Chem. Phys., 8, 129–139, doi:10.5194/acp-8-129-2008, 2008.
Tunved, P., Str¨om, J., and Krejci, R.: Arctic aerosol life cycle: link-ing aerosol size distributions observed between 2000 and 2010 with air mass transport and precipitation at Zeppelin station, Ny- ˚Alesund, Svalbard, Atmos. Chem. Phys., 13, 3643–3660, doi:10.5194/acp-13-3643-2013, 2013.
Udisti, R., Dayan, U., Becagli, S., Busetto, M., Frosini, D., Legrand, M., Lucarelli, F., Preunkert, S., Severi, M., Traversi, R., and Vi-tale, V.: Sea spray aerosol in central Antarctica. Present atmo-spheric behaviour and implications for paleoclimatic reconstruc-tions, Atmos. Environ., 52, 109–120, 2012.
Vana, M., Ehn, M., Pet¨aj¨a, T., Vuollekoski, H., Aalto, P., De Leeuw, G., Ceburnis, D., O’Dowd, C. D., and Kulmala, M.: Characteris-tic features of air ions at Mace Head on the west coast of Ireland, Atmos. Res., 90, 278–286, 2008.
Virkkula, A., Hirsikko, A., Vana, M., Aalto, P., Hillamo, R., and Kulmala M.: Charged particle size distribution and analysis of particle formation events at the Finnish Antarctic research station Alboa, Boreal Env. Res., 12, 397–408, 2007.
Wang, M. and Penner, J. E.: Aerosol indirect forcing in a global model with particle nucleation, Atmos. Chem. Phys., 9, 239–260, doi:10.5194/acp-9-239-2009, 2009.
Weller, R., Minikin, A., Wagenbach, D., and Dreiling, V.: Char-acterization of the inter-annual, seasonal, and diurnal variations of condensation particle concentrations at Neumayer, Antarc-tica, Atmos. Chem. Phys., 11, 13243–13257, doi:10.5194/acp-11-13243-2011, 2011.
Winklmayr, W., Reischl, G. P., Lindner, A. O., and Berner, A.: New electromobility spectrometer for the measurement of aerosol size distributions in the size range from 1 to 1000 nm, J. Aerosol Sci., 22, 289–296, 1991.
Yli-Juuti, T., Nieminen, T., Hirsikko, A., Aalto, P. P., Asmi, E., H˜orrak, U., Manninen, H. E., Patokoski, J., Dal Maso, M., Pet¨aj¨a, T., Rinne, J., Kulmala, M., and Riipinen, I.: Growth rates of nucleation mode particles in Hyyti¨al¨a during 2003– 2009: variation with particle size, season, data analysis method and ambient conditions, Atmos. Chem. Phys., 11, 12865–12886, doi:10.5194/acp-11-12865-2011, 2011.