Geometry Design Optimization of
Functionally Graded Scaffolds for Bone
Tissue Engineering: A Mechanobiological
Approach
Antonio Boccaccio1*, Antonio Emmanuele Uva1, Michele Fiorentino1, Giorgio Mori2,
Giuseppe Monno1
1Dipartimento di Meccanica, Matematica e Management, Politecnico di Bari, 70126, Bari, Italy,
2Dipartimento di Medicina Clinica e Sperimentale, Universitàdi Foggia, 71122, Foggia, Italy
Abstract
Functionally Graded Scaffolds (FGSs) are porous biomaterials where porosity changes in space with a specific gradient. In spite of their wide use in bone tissue engineering, possible models that relate the scaffold gradient to the mechanical and biological requirements for the regeneration of the bony tissue are currently missing. In this study we attempt to bridge the gap by developing a mechanobiology-based optimization algorithm aimed to determine the optimal graded porosity distribution in FGSs. The algorithm combines the parametric finite element model of a FGS, a computational mechano-regulation model and a numerical optimization routine. For assigned boundary and loading conditions, the algorithm builds iteratively different scaffold geometry configurations with different porosity distributions until the best microstructure geometry is reached, i.e. the geometry that allows the amount of bone formation to be maximized. We tested different porosity distribution laws, loading con-ditions and scaffold Young’s modulus values. For each combination of these variables, the explicit equation of the porosity distribution law–i.e the law that describes the pore dimen-sions in function of the spatial coordinates–was determined that allows the highest amounts of bone to be generated. The results show that the loading conditions affect significantly the optimal porosity distribution. For a pure compression loading, it was found that the pore dimensions are almost constant throughout the entire scaffold and using a FGS allows the formation of amounts of bone slightly larger than those obtainable with a homogeneous porosity scaffold. For a pure shear loading, instead, FGSs allow to significantly increase the bone formation compared to a homogeneous porosity scaffolds. Although experimental data is still necessary to properly relate the mechanical/biological environment to the scaf-fold microstructure, this model represents an important step towards optimizing geometry of functionally graded scaffolds based on mechanobiological criteria.
OPEN ACCESS
Citation:Boccaccio A, Uva AE, Fiorentino M, Mori G, Monno G (2016) Geometry Design Optimization of Functionally Graded Scaffolds for Bone Tissue Engineering: A Mechanobiological Approach. PLoS ONE 11(1): e0146935. doi:10.1371/journal. pone.0146935
Editor:Jie Zheng, University of Akron, UNITED STATES
Received:November 2, 2015
Accepted:December 25, 2015
Published:January 15, 2016
Copyright:© 2016 Boccaccio et al. This is an open access article distributed under the terms of the
Creative Commons Attribution License, which permits unrestricted use, distribution, and reproduction in any medium, provided the original author and source are credited.
Data Availability Statement:All relevant data are within the paper.
Funding:The authors have no support or funding to report.
Competing Interests:The authors have declared that no competing interests exist.
Abbreviations:t, length of the side of the basis of the scaffold prismatic model; h, height of the scaffold prismatic model; VTOT, total volume of the scaffold
Introduction
Functionally Graded Scaffolds (FGSs) for bone tissue engineering are porous biomaterials where the porosity changes with a specific gradient in space. The gradation of porosity enables FGSs to combine together the best mechanical properties of the denser material with those of the more porous one and the resulting material exhibits performances higher than those of the single constitutive materials. Low porosity regions offer high mechanical strength, high poros-ity regions promote, instead, cell adhesion and support cell growth, proliferation and differenti-ation [1–2].
Such scaffolds have been successfully utilized in the most variegated domains including the repair of long bone [1,3] and osteochondral [4–5] defects, the maxillofacial [6–7] and the spinal [8] surgery, the cranial reconstruction [9] and the drug delivery systems [1,10]. A large number of studies [11–13] are reported in the literature on the manufacturing processes that can be adopted to fabricate these biomaterials. Among the others, the strategy based on the integration of additive manufacturing or rapid prototyping techniques with computer-aided design models seems to be one of the most efficient [2,14]. The possibility of building any scaffold architecture with any type of porosity gradation and the experimental evidence that the geometry of porous scaffolds significantly influences the cellular response and the rate of bone tissue regeneration [15–17] led research community to find the possible models that relate the scaffold gradient to the mechanical and biological requirements for the regeneration of the bony tissue [2]. How-ever, to date such models have not been developed yet.
In this article, we attempt to bridge the gap and propose a mechanobiology-driven optimi-zation algorithm that, based on the boundary and loading conditions acting on the scaffold, identifies the best porosity distribution that allows the bone formation to be maximized. Other studies reported in the literature utilized optimization techniques to determine the best scaffold geometry [18–23] but none of them adopted mechanobiological criteria and determined the optimal porosity gradient in FGSs. In a previous study [24], the algorithm was utilized to deter-mine the optimal pore dimension in regular structured open-porous scaffolds with homoge-neous porosity. In the present study, the model was further developed to include a functionally graded porosity. In particular, three different variables have been investigated: the porosity dis-tribution law, the loading conditions and the scaffold Young’s modulus; for each combination of the three variables, the algorithm determines the explicit equation of the porosity distribu-tion law (i.e. the law that describes the pore dimensions in funcdistribu-tion of the spatial coordinate), that allows the largest volume of the scaffold to be occupied by bone.
Materials and Methods
Parametric model of an open-porous functionally graded scaffold
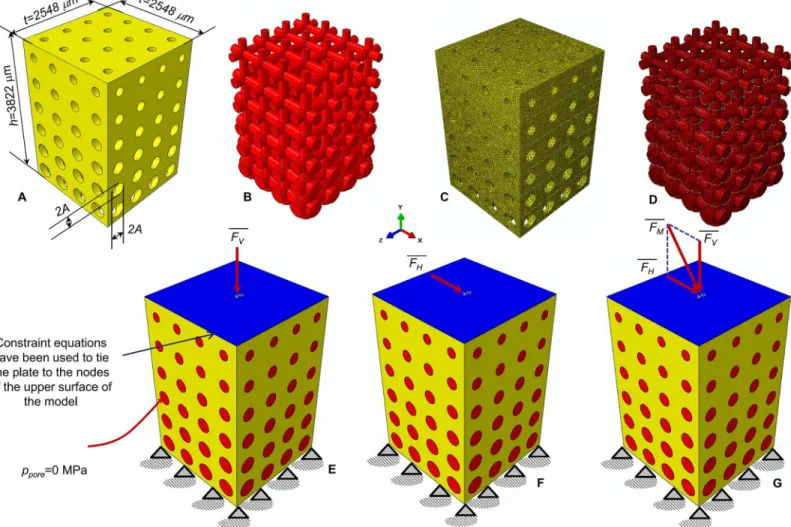
The parametric finite element model of an open-porous functionally graded scaffold was cre-ated in ABAQUS CAE1Version 6.12 (Dassault Systèmes, France). The model has a prismatic geometry with a squaret×t= 2548μm × 2548μm base and ah= 3822μm height. The scaffold
(represented in yellow,Fig 1A) includes circular pores with a parametric radiusAthat was assumed to change only along theydirection and remain constant alongxandzdirection (Fig 1A and 1B). According to Byrne et al. [25], the scaffold pores were hypothesized to be occupied by granulation tissue (represented in red,Fig 1B). The finite element mesh includes tetrahedral biphasic poro-elastic elements. 4-node linear coupled pore pressure elements (C3D4P) avail-able in ABAQUS were utilized to model both, the scaffold (Fig 1C) and the granulation tissue (Fig 1D). The approximate element size was fixed equal to 40μm.
and producing a vertical distributed load;FH, shear
force acting on the scaffold and producing a horizontal distributed load;FM, mixed
compression-shear force acting on the scaffold; ppore, pore
pressure acting on the outer surfaces of the granulation tissue; E, scaffold Young’s modulus; A, pore radius;Ai(i= 1, 2, 3, 4), pore radius at specificy
locations;ymax,ymin,yint,yint1,yint2, specificy
locations where the pore radius was determined;m,
mi(i= 1, 2, 3), gradient of porosity distribution laws;
S, biophysical stimulus regulating the differentiation process;ɣ, octahedral shear strain;ʋ, interstitial fluid
flow;ε
I,εII,εIII, principal strains; a, empirical constant
a= 3.75%; b, empirical constantb= 3μms-1;n
resorb,
nmature,c, boundaries of the mechano-regulation
diagram; Alower, lower bound of the pore radius
variability range; Aupper, upper bound of the pore
radius variability range; Vi_bone, volume of the generic
element where the formation of mature bone is predicted to take place; nb, number of elements
where the formation of mature bone is predicted to take place; VBONE, total volume of the elements
where the formation of mature bone is predicted to take place; BO%, percentage of scaffold volume that
is occupied by bone;Ω, objective function to optimize; PVPD, Percent Variation of the Pore Dimension;AH,
AL, highest and lowest value ofAalong they-axis,
respectively; BO%_tri-linear, percentage of volume
occupied by bone predicted for the tri-linear porosity distribution law; BO%_constant, percentage of volume
Material properties implemented in the finite element model of the granulation tissue are the same as those utilized in previous studies [24,26–27]. In detail, the Young’s modulus was set equal to 0.2 MPa; the permeability to 1×10⁻¹⁴m4/N/s; the Poisson’s ratio to 0.167; the porosity to 0.8; the bulk modulus grain to 2300 MPa; the bulk modulus fluid to 2300 MPa. In order to evaluate the effect of the scaffold mechanical properties on the optimal porosity distri-bution, three different values of the Young’s modulusEwere hypothesized: 500, 1000 and 1500 MPa which are the same as those utilized in a previous study [24].
The nodes of the bottom surface of the model were clamped (Fig 1E, 1F and 1G) while those of the upper surface were tied to a rigid plate (represented in blue,Fig 1E, 1F and 1G). For the outer nodes of the granulation tissue the pore pressure was fixed equal to 0 MPa which indi-cates that the liquid can freely exudate while applying the load. Three different loading condi-tions were hypothesized in the study: (a) a compression forceFVproducing a vertical
distributed load ofFV/ (t×t) = 1 MPa (Fig 1E); (b) a shear forceFHproducing an horizontal
distributed load ofFH/ (t×t) = 0.5 MPa (Fig 1F); (c) a mixed compression-shear forceFM Fig 1. Parametric finite element model of the functionally graded scaffold utilized in the study.CAD model (A-B) and finite element mesh (C-D) of the scaffold (A, C) and granulation tissue (B, D). Circular pores with variable radiusAhave been modelled. The nodes of the bottom surface of the model were clamped (E-G) while those of the upper surface were tied to a rigid plate (represented in blue). Three different loading conditions were hypothesized: a compression forceFV(E); a shear forceFH(F); a mixed compression-shear forceFM(G). The pore pressurepporeon the outer surfaces of the granulation
tissue was set equal to zero to simulate the free exudation offluid.
given by the sumFM¼FVþFH(Fig 1G). The choice of settingFH= 0.5 ×FVwas done
because scaffolds are primarily designed to undergo to compression loading [25]. In all the hypothesized loading conditions, force was ramped over a time period of 1 s that is the possible time in which, a human body motion (such as to assume the erect position or to perform any motion of anatomical regions where a FGS can be implanted), can be completed. The same time interval was utilized in previous studies [24,28–29].
Porosity distribution laws
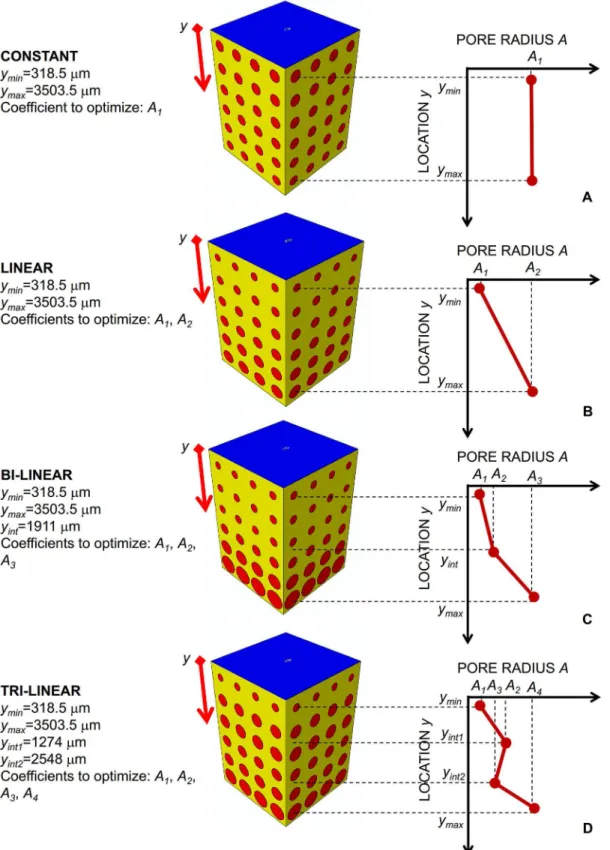
The dimension of the circular pores was controlled by the parametric radiusA(Fig 1) that was hypothesized to change along they-direction according to different porosity distribution laws. The coefficients of these distribution laws and hence their gradients were determined via the optimization algorithm described below. The porosity distribution laws considered in the study are the following: constant, linear, bi-linear and tri-linear.
• Constant law. All the pores have the same dimensions (Fig 2A). In this case, the optimization algorithm determines just one coefficient, i.e.A1, that is the pore radius of all the scaffold
pores.
• Linear law. The dimensions of pore change linearly withy. Two coefficients have to be deter-mined by the optimization algorithm:A1andA2that are the pore radii aty=yminandy=
ymax, respectively (Fig 2B).
• Bi-linear law. The pore radiusAchanges in the ranges [yminyint] and [yintymax] with two
dif-ferent linear laws that assume the same value fory=yint. The coefficients to optimize are
three:A1,A2andA3(Fig 2C).
• Tri-linear law. The dimensions of the pore change in the intervals [yminyint1], [yint1yint2],
[yint2ymax] with three different linear laws. The laws defined in the first and second and those
defined in the second and third interval assume the same value fory=yint1and fory=yint2,
respectively. In this case, the optimization algorithm determines four coefficients:A1,A2,A3
andA4(Fig 2D).
The specific values ofymax,ymin,yint,yint1andyint2are reported inFig 2. It is worthy to note
that, once the coefficientsAi(i= 1, 2, 3, 4) have been determined, the explicit equation of the
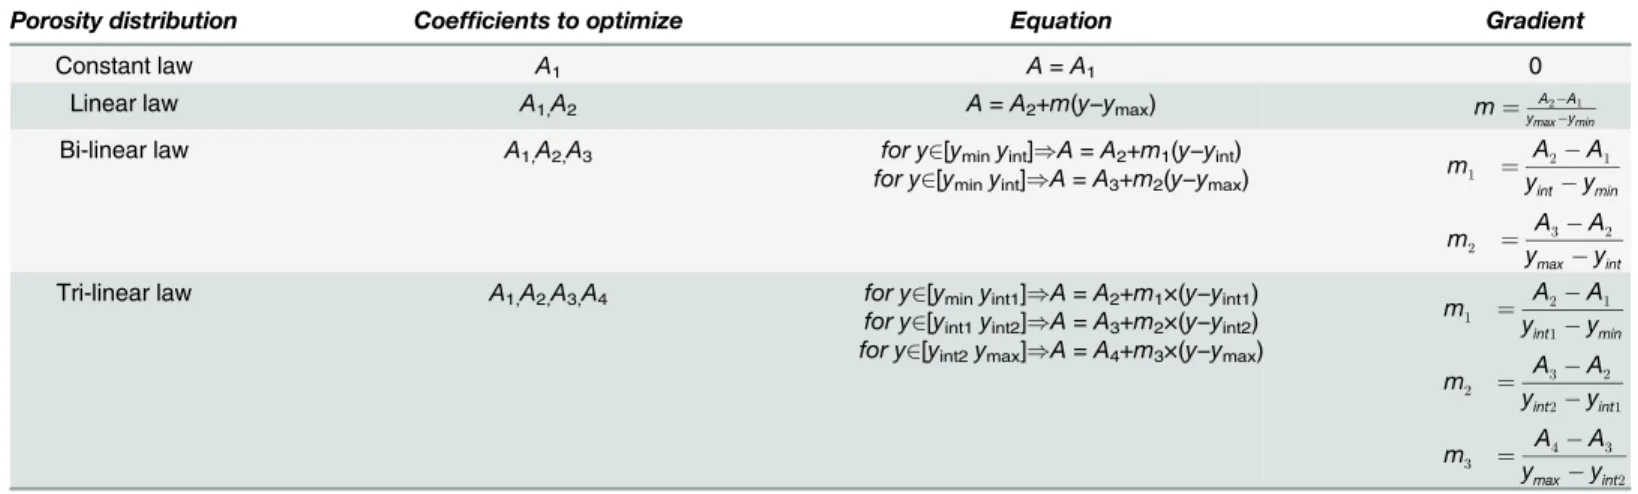
best porosity distribution, i.e. the equation that describes how the pore radiusAchanges with y, can be obtained by simply implementing the obtained coefficients in the relationships reported inTable 1.
Computational mechano-regulation model
Once the mesenchymal stem cells invade the scaffold and spread through its pores, the bone regeneration process starts. After dispersal, cells will differentiate. The biophysical stimulusS that regulates the differentiation process was hypothesized to be a function of the octahedral shear strainɣand interstitial fluid flowʋin the extracellular environment of the cells. In detail, letεI,εII, andεIIIbe the principal strains, the octahedral shear strainɣcan be defined as:
g¼
1
2
ffiffiffiffiffiffiffiffiffiffiffiffiffiffiffiffiffiffiffiffiffiffiffiffiffiffiffiffiffiffiffiffiffiffiffiffiffiffiffiffiffiffiffiffiffiffiffiffiffiffiffiffiffiffiffiffiffiffiffiffiffiffiffiffiffiffiffiffiffiffiffiffiffiffi ðε
I εIIÞ
2
þ ðε
II εIIIÞ
2
þ ðε
III εIÞ
2
q
ð1Þ
Fig 2. Porosity distribution laws analyzed in the study.(A) constant; (B) linear; (C) bi-linear; (D) tri-linear. The specific coefficientsAi(i= 1, 2, 3, 4) of
these laws were determined via the optimization algorithm.
Prendergast et al. [31], as:
S¼g
aþ v
b ð2Þ
Mesenchymal stem cells differentiate into different cell phenotypes according to the follow-ing inequalities:
if S>c)fibrogenesis)fibroblasts)fibrous tissue formation
if 1<S<c)condrogenesis)chondrocytes ) cartilagineous tissue formation
if nmature<S<1)osteogenesis)osteoblasts ) immature bone tissue formation
if nresorb<S<nmature)osteogenesis)osteoblasts ) mature bone tissue formation
if 0<S<n
resorb)osteoclasts ) bone resorbtion
ð3Þ 8 > > > > > > > < > > > > > > > :
wherenresorb= 0.01,nmature= 0.53 andc= 3 represent boundaries of the mechano-regulation
diagram the values of which are the same as those utilized in other studies [28,32–33].
Optimization algorithm
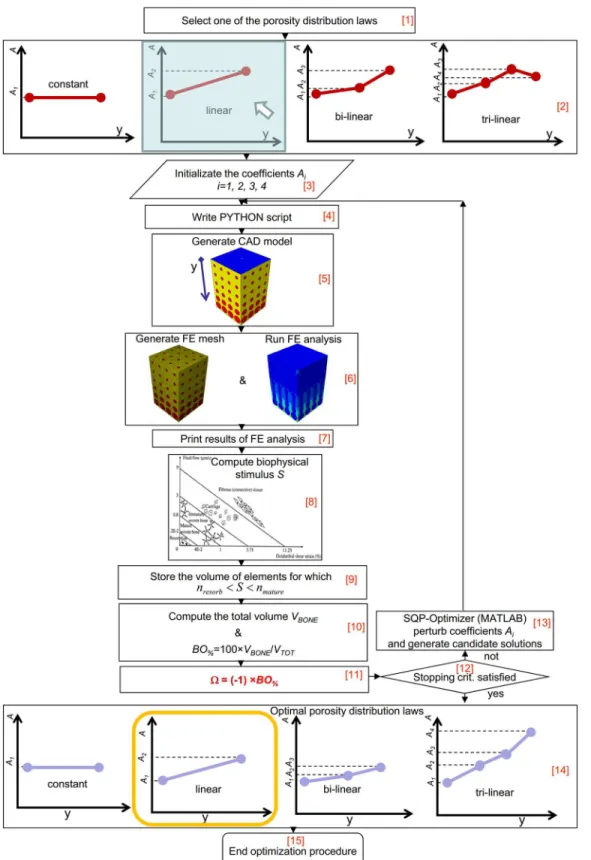
The FGS parametric finite element model, the computational mechano-regulation model above described and a numerical optimization routine were combined together in an algorithm written in Matlab1
(v. R2011b) (Fig 3) that aims to determine, for each of the hypothesized scaffold Young’s moduli, loading conditions and porosity distribution laws, the equations of the best porosity distribution that allows the bone formation to be maximized. Considering that 3 scaffold Young’s modulus values (i.e. 500, 1000 and 1500 MPa), 3 loading conditions (i.e.FV,FH, andFM) and 4 porosity distribution laws (i.e. constant, linear, bi-linear and
tri-lin-ear) have been hypothesized, it follows that a total of 3 × 3 × 4 = 36 optimization analyses have been performed in the study.
As a first step, the algorithm requires to select (Block [1]) one of the porosity distribution laws (Block [2]). The initialization of coefficientsAifollows (Block [3]), the user can assign toAiinitial
values that fall within the interval [AlowerAupper], whereAlower= 5μm andAupper= 300μm have
been taken the same as those utilized in a previous study [24]. The algorithm implements the specified initial values ofAiinto a PYTHON script (Block [4]) that is given in input to ABAQUS.
The PYTHON script, based on the valuesAi, defines in function of the coordinate locationythe
Table 1. Porosity distribution laws implemented in the study.
Porosity distribution Coefficients to optimize Equation Gradient
Constant law A1 A=A1 0
Linear law A1,A2 A=A2+m(y−ymax) m¼ A2 A1
ymax ymin Bi-linear law A1,A2,A3 for y2[yminyint])A=A2+m1(y−yint)
for y2[yminyint])A=A3+m2(y−ymax) m1 ¼ A2 A1
yint ymin
m2 ¼
A3 A2
ymax yint
Tri-linear law A1,A2,A3,A4 for y2[yminyint1])A=A2+m1×(y−yint1) for y2[yint1yint2])A=A3+m2×(y−yint2) for y2[yint2ymax])A=A4+m3×(y−ymax)
m1 ¼
A2 A1
yint1 ymin
m2 ¼
A3 A2
yint2 yint1
m3 ¼
A4 A3
ymax yint2
Fig 3. Schematic of the algorithm implemented in Matlab environment to optimize the porosity distribution law in functionally graded scaffolds.
dimension of each pore. The module ABAQUS CAE builds the CAD model of the functionally graded scaffold (Block [5]) with the computed pore dimensions, and after applying the boundary and (one of) the (three) loading conditions above described, generates the finite element mesh (Block [6]). The finite element analysis follows that accounts for geometrical and material non-linearities (Block [6]). For each element occupying the scaffold pores, i.e. the elements repre-sented in red inFig 1D, ABAQUS prints (Block [7]) the values of the principal strainsεI,εIIand εIIIand of the interstitial fluid flowʋthat the algorithm utilizes to compute, through the eqs (1)
and (2), the magnitude of the biophysical stimulusS(Block [8]). Then, the relationshipseq (3)
are implemented and for those elements for which the inequality
nresorb<S<nmature ð4Þ
is satisfied, i.e. for those elements where the formation of mature bone is predicted to take place, the volumeVi_boneis stored (Block [9]). Ifnbis the number of elements where inequalityeq (4)is
satisfied, the algorithm calculates the total volume of these elements as:
VBONE¼
X
nbi¼1
Vi bone ð5Þ
IfVTOTis the total volume of the scaffold modelVTOT=t×t×
h= 2548μm × 2548μm × 3822μm = 24.814 mm3, the algorithm determines the percentage of
scaffold volumeBO%that is occupied by bone as (Block [10]):
BO%¼
VBONE
VTOT
100 ð6Þ
and calculates the value of the objective functionOas (Block [11]):
O¼ ð 1Þ BO
% ð7Þ
At this point, the algorithm formulates an optimization problem that includes the coeffi-cientsAias design variables and that aims to minimize the value of the objective functionOor,
equivalently, to maximize the percentageBO%of volume occupied by bone. It can be claimed, in
fact, that the greater the efficiency of the scaffold, the larger the amount of bone produced by the scaffold itself. In an ideal scaffold, 100% of its volume is occupied by bone. The inverse prob-lem described with the eqs (6) and (7) was solved with the Sequential Quadratic Programming (SQP) method available in Matlab, an iterative method for nonlinear optimization. The number of iterations performed by the method can be controlled by means of specific stopping criteria that can be selected by the user and that include a number of tolerances. As one of these stop-ping criteria is meet, the optimization process ends and after implementing the optimal coeffi-cientsAiin the relationships ofTable 1, the optimal porosity distributions are traced in function
ofy(Blocks [14] and [15]). If no stopping criteria are satisfied, the optimization algorithm assigns new values toAithus generating new candidate solutions (Block [13]). The optimization
process terminates when one of the selected stopping criteria is satisfied (Block [12]).
The biophysical stimulusSon which the objective functionOdepends, was computed based on the hypothesis that the dispersal of mesenchymal stem cells has already taken place and that the only granulation tissue, with the mechanical properties above described, occupies the scaf-fold pores.
All the computations were performed on a HP Z620- Intel1Xeon1Processor E5-2620—
Results
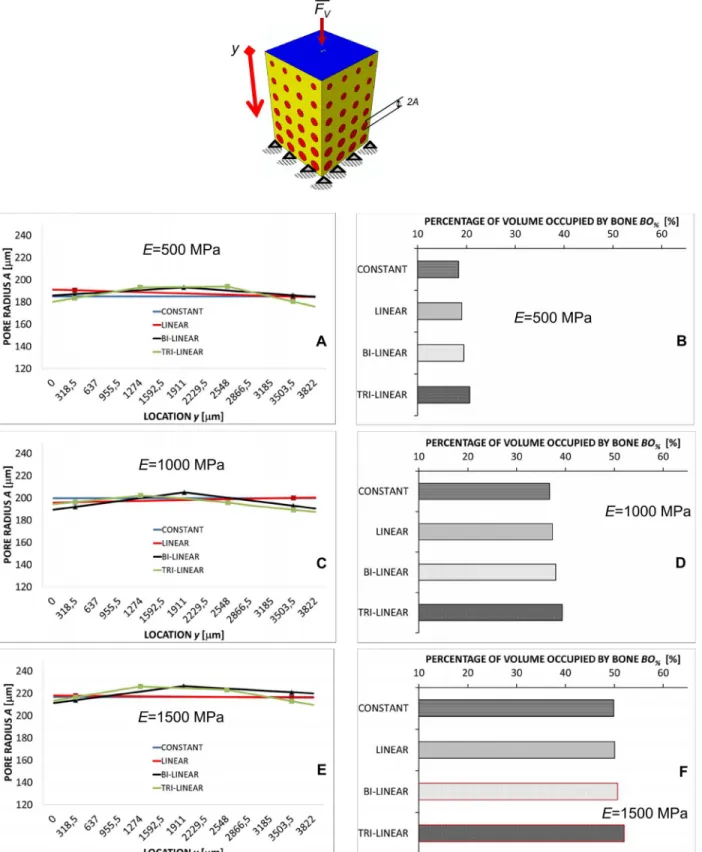
In the case of the compression loadingFVthe predicted pore dimension experiences small
changes (Fig 4A, 4C and 4E) along they-axis and is almost constant. Independently from the scaffold Young’s modulusE,Adoes not change by more than 15μm. The general trend (with
the exception for the porosity distribution obtained implementing the constant law) that can be observed is that the pore radius in the vicinity of the clamps (i.e. for high values ofy) and of the load (i.e. for small values ofy) slightly decreases. For increasing values ofE, the pore radius, on average, increases. For instance, in the case ofE= 500 MPa, the average pore radius is about 190μm, forE= 1500 MPa, instead, becomes about 220μm. The percentage of volume occupied
by boneBO%increases as we move from the constant to the tri-linear porosity distribution (Fig
4B, 4D and 4F). Furthermore, increasing values ofBO%were predicted for increasing values of
the scaffold Young’s modulus (Fig 4B, 4D and 4F).
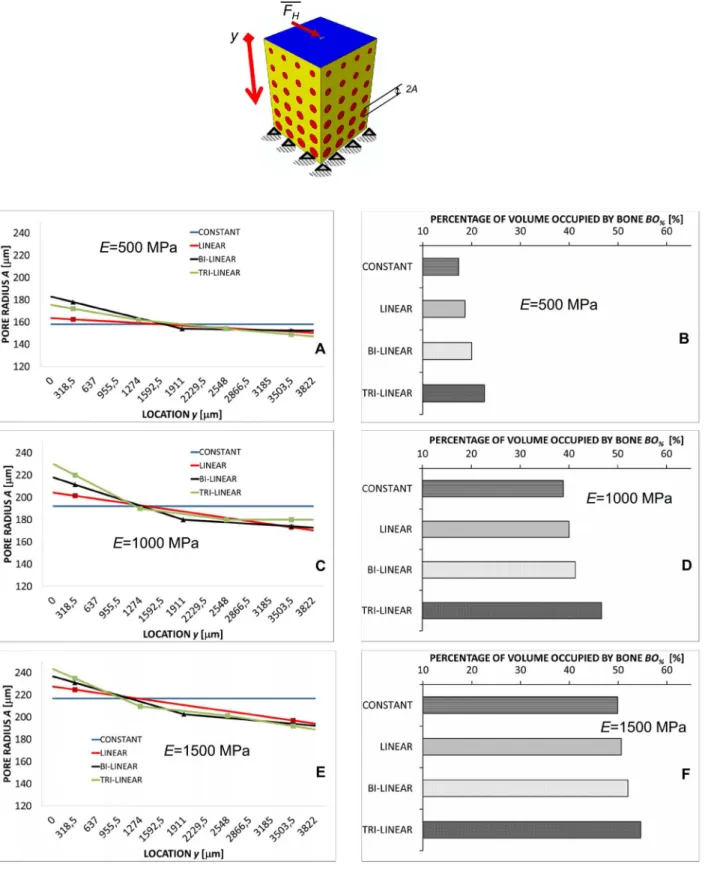
More interesting appears the porosity distribution predicted by the algorithm in the case of the shear loadFH(Fig 5) where important changes of the pore dimensions are predicted along
they-axis (Fig 5A, 5C and 5E). The highest values ofAare predicted in the vicinity of the load (i.e. for small values ofy) while the pore dimensions tend to decrease as we move towards the clamped region. Also in this caseBO%increases as we move from the constant to the tri-linear
porosity distribution, however, the change ofBO%is more significant than in the case of
com-pression load. For increasing levels ofE, the average value ofBO%increases too (Fig 5B, 5D
and 5F).
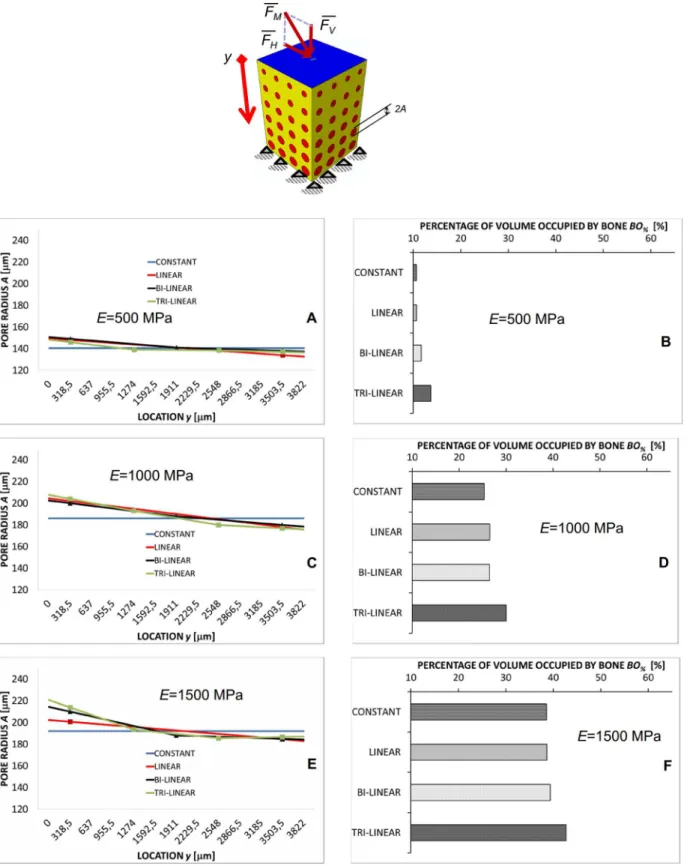
In the case of mixed loadFM, the pore radiusAexperiences changes that are less important
than those predicted in the case of shear loadFHbut that are certainly larger than those
com-puted in the case of compression loadFV(Fig 6A, 6C and 6E). As in the previous case, the pore
dimension decreases for increasing values ofy.BO%increases as we move from the constant to
the tri-linear law and its average value increases for increasing values of the scaffold Young’s modulusE(Fig 6B, 6D and 6F). For a fixed value ofEand porosity distribution law, the values ofBO%predicted in the case of mixed loadFMare smaller than those predicted for the other
hypothesized loading conditions (Figs4B, 4D, 4F,5B, 5D, 5F,6B, 6D and 6F).
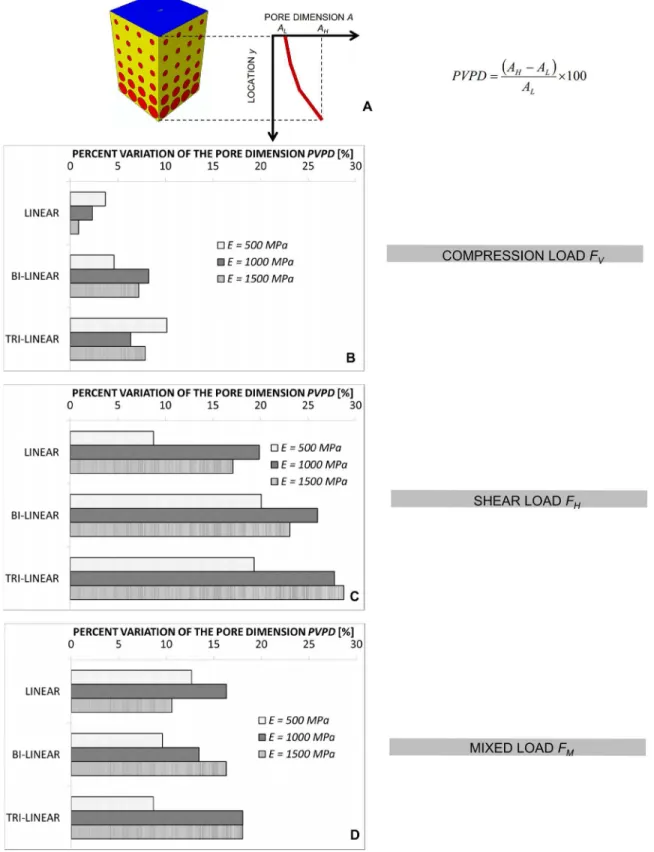
In order to quantify (i) the change of the pore dimensions withyand (ii) the“usefulness”of utilizing a functionally graded scaffold instead of a scaffold with a homogenous porosity distri-bution we introduced two parameters. The first one, denoted asPVPD, represents the Percent Variation of the Pore Dimension and is defined as:
PVPD¼ðAH ALÞ
AL
100 ð8Þ
whereAHandALare the highest and the lowest value ofAalong they-axis, respectively (Fig
7A). In general, the higher thePVPD, the larger are the changes of the pore dimensionA. The highest values ofPVPDhave been found in the case of the shear loadingFH(Fig 7) where
changes ofAalso by more than 25–30% were predicted (Fig 7C). Slightly lower are the values ofPVPDfound in the case of the mixed loadFM(Fig 7D) and yet less significant those
com-puted in the case of the compression loadFV(Fig 7B). Averagely, it appears thatPVPDdoes
not depend neither on the scaffold Young’s modulusE, nor on the porosity distribution law but does depend on the loading conditions. For the constant law, regardless of the type of load considered, the value ofPVPDis zero and is not shown inFig 7.
In general, it appears that as we move from the constant to the linear, bi-linear and, finally, tri-linear porosity distribution law the percentage of volume occupied by boneBO%increases
(Figs4B, 4D and 4F,5B, 5D and 5F,6B, 6D and 6F). In particular, the highest values ofBO%
Fig 4. Computed values ofAandBO%in the case of compression loading.Pore radiusA(A, C, E) (vs. locationy) and percentages of the scaffold
volume occupied by boneBO%(B, D, F) predicted by the optimization algorithm in the case of compression loadingFVfor different scaffold Young’s moduli
and after implementing different porosity distribution laws. The schematic figure shown on the top indicates the loading condition to which the diagrams refer. All the values ofBO%reported in the diagrams refer to the optimal configuration, i.e. the configuration for whichΩreaches its minimum value.
Fig 5. Computed values ofAandBO%in the case of shear loading.Pore radiusA(A, C, E) (vs. locationy) and percentages of the scaffold volume
occupied by boneBO%(B, D, F) predicted by the optimization algorithm in the case of shear loadingFHfor different scaffold Young’s moduli and after
implementing different porosity distribution laws. The schematic figure shown on the top indicates the loading condition to which the diagrams refer. All the values ofBO%reported in the diagrams refer to the optimal configuration, i.e. the configuration for whichΩreaches its minimum value.
Fig 6. Computed values ofAandBO%in the case of mixed load.Pore radiusA(a, c, e) (vs. locationy) and percentages of the scaffold volume occupied
by boneBO%(b, d, f) predicted by the optimization algorithm in the case of mixed loadFMfor different scaffold Young’s modulus values and after
implementing different porosity distribution laws. The schematic figure shown on the top indicates the loading condition to which the diagrams refer. All the values ofBO%reported in the diagrams refer to the optimal configuration, i.e. the configuration for whichΩreaches its minimum value.
Fig 7. Computed values ofPVPDfor different loading conditions.Percent Variation of the Pore Dimension (PVPD) for the compressionFV(B), the shear
FH(C) and the mixedFM(D) load and for all the hypothesized scaffold Young’s modulus values. (A) reference schematic utilized to calculate the parameter
PVPD. Note:AHandALare the highest and lowest value ofAthat can be located in correspondence of any value ofyand not necessarily, as reported in the
figure, of the furthest valuesy= 0μm andy=h= 3822μm.
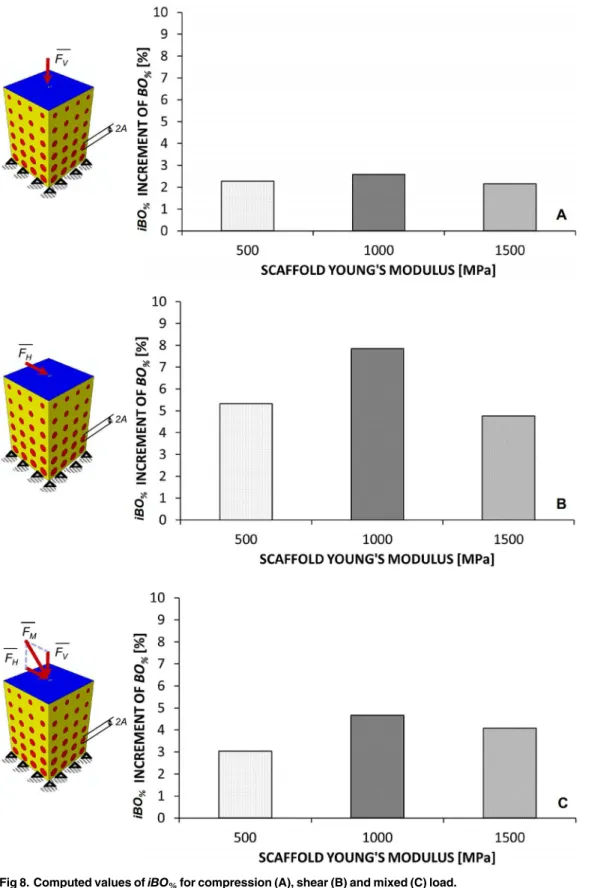
makes sense to introduce the second parameter, denoted asiBO%and defined as the increment
ofBO%when we move from the constant to the tri-linear law. IfBO%_tri-linearis the percentage
of volume occupied by bone predicted for the tri-linear porosity distribution andBO%_constant
the percentage predicted with the constant one,iBO%can be expressed as:
iBO%¼BO%tri linear BO%constant ð9Þ
As is clear, the higher the values ofiBO%, the more“useful”is the utilization of a
function-ally graded scaffold instead of a homogeneous porosity scaffold. In the limit case whereiBO%=
0%, the use of a FGS does not make sense and a homogeneous porosity scaffold has the same potentialities of generating bone as the FG one. On average, the highest values ofiBO%were
computed in the case of shear loadingFHfollowed by the mixed loadFMand the compression
loadFV, respectively (Fig 8). In particular, among the hypothesized scaffold Young’s moduli,
the highest values ofiBO%were predicted forE= 1000 MPa.
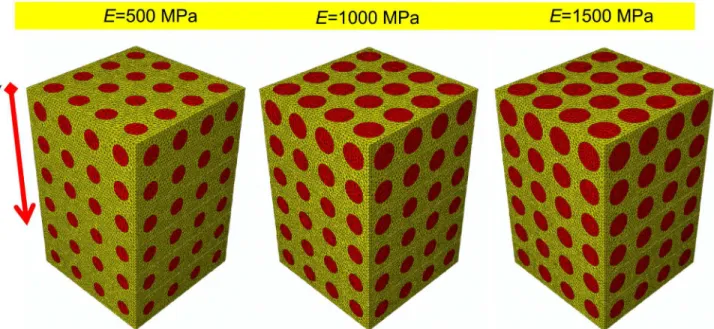
A three-dimensional view of the optimal scaffold geometry predicted for the tri-linear porosity distribution (that is the law with which the highest values ofBO%have been obtained)
and the shear loadingFHis shown inFig 9. As it can be seen, the pore dimensions change
sig-nificantly along they-axis and, on average, increase for increasing values ofE.
Discussion
This article presented an optimization algorithm based on mechanobiological criteria and aimed to determine the best porosity distribution in functionally graded scaffolds for bone tis-sue engineering.
Fourporosity distribution laws, threeloading conditionsand threescaffold Young’s moduli were hypothesized. For each combination of these three variables, the optimal microstructure geometry was determined. It was shown that all these variables have a critical effect on the amounts of bone predicted to form within the scaffold pores.
Regarding theporosity distribution law, it was found that designing FGSs with a tri-linear law allows the largest amounts of bone to be generated (Figs4–6) compared to bi-linear, linear and constant laws. In general, the use of porosity distribution laws with increasing complexity level (i.e. with increasing number of coefficientsAi) leads the scaffold geometry to be better
tai-lored to the specific boundary and loading conditions acting on the construct thus allowing the bone formation to be maximized. Increasing the complexity level of a porosity distribution means, in other words, to include a larger number of design variables and hence, to increase the probability that the optimizer will find a geometry that allows larger amounts of bone to be generated.
Fig 8. Computed values ofiBO%for compression (A), shear (B) and mixed (C) load.
and the clamped surfaces where the stress state becomes tri-axial) and then to a more or less uniform distribution of the stimulusS, which explains the approximately uniform dimensions of the pores. The mixed loadFMleads to an intermediate situation between the pure
compres-sion and the pure shear. Changes ofAas well increments ofBO%are more important than
those predicted in the case of compression forceFVbut less relevant than those computed with
the shear loadFH(Figs6–8).
Finally, regarding thescaffold Young’s modulusit appears that the average pore dimension Aincreases for increasing values ofE(Fig 9). This can be justified with the argument that as the Young’s modulus increases, the global scaffold stiffness increase too and the optimizer tends to increase the dimensions of the pores to include larger amounts of bone.
To determine the optimal porosity distribution in FGSs some assumptions were made. First of all, the temporal variable was neglected. It was assumed that the scaffold pores are occupied only by granulation tissue, the processes of diffusion of the mesenchymal stem cells and of tis-sue differentiation were not simulated and the optimization of the porosity distribution was carried out based on the values of the biophysical stimulus registered at the initial time instant. Furthermore, the algorithm does not include scaffold resorption potential [25].
Including the time variable would certainly allow to carry out more accurate predictions on the best porosity distribution but would lead to a dramatic increase of the computational time thus making the algorithm practically not implementable in a“clinical”context. Other aspects such as angiogenesis [34–36] and growth factors [37] involved in the process of bone regenera-tion were not modelled. This model neglects the effect of loads during the initial development of a tissue on a scaffold, i.e. during the phase in which cell attach to the scaffold surface. The scaffold surface is a 2D environment while the model utilized in this study is based on volumet-ric strains. A model to predict the effect of mechanical signals on cells seeded on the surface of a scaffold has been reported [38]. Another limitation of the model is that a deterministic approach was adopted to determine the biophysical stimulusS,—on the definition of which the optimal porosity distribution law is calculated,—which neglects any possible genetic
Fig 9. 3D view of the best geometrical configurations (tri-linear porosity distribution) predicted by the optimization algorithm for the shear loading condition.
variability in animal populations. A more general and complete approach would be the proba-bilistic one and would take into account this variability.
However, despite these limitations, the predictions of the model are consistent with the results of experimental studies. For instance, the patterns of bony tissue predicted in the case of a pure compression load, constant porosity distribution,E= 1000 MPa, are consistent with those of new tissue generated in circular matrix channels observed in histological analyses [39]. In vitro, it was found that, bone forms from the channel walls and tends to growth towards the center of the pore. This same behavior was observed in the numerical model (Fig 10). The grey
Fig 10. Patterns of bone predicted in the case of: (i) compression loading; (ii) scaffold Young’s modulusE= 1000 MPa; (iii) porosity distribution law: constant.Elements in gray are representative of the regions within the scaffold pores where the algorithm predicts bone formation. Interestingly, the predicted bony tissue patterns appear consistent with those of new tissue formed in three-dimensional matrix channels observed in an in vitro study [39]. Bone formation starts from the pore walls and propagates towards the pore center.
elements shown inFig 10represent the volumes of the model where the mechano-regulation model predicts the formation of bone. Furthermore, as demonstrated in previous studies a minimum pore size of about 100μm is required to guarantee a successful bone regeneration
process in scaffolds [40]. The pore dimensions predicted by the model are all above this thresh-old value and well fall within the range of the typical dimensions of the pores of scaffthresh-olds for bone tissue engineering [41]. Other studies report that the rate of bone regeneration in scaffold is a function of the scaffold mechanical properties [42]. This is also consistent with the predic-tions of the present model where the amounts of boneBO%change for changing values of the
scaffold Young’s modulus (Figs4–6and9).
Conclusions
A mechanobiology-driven optimization algorithm was presented to determine the optimal porosity distribution in functionally graded scaffolds. The results presented in this paper show that the loading conditions are pivotal in determining optimal porosity distribution. For a pure compression loading, it was predicted that the changes of the pore dimension are marginal and using a FGS allows the formation of amounts of bone slightly larger than those obtainable with a homogeneous porosity scaffold. For a pure shear loading, instead, FGSs allow to significantly increase the bone formation compared to a homogeneous porosity scaffold. Increasing pore dimensions are predicted for increasing values of the scaffold Young’s modulus. Increasing the number of coefficients that define a porosity distribution law allows to design more performing scaffolds capable of generating larger amounts of bone.
The model predictions appear reasonably consistent with what is observed in vitro.
Although experimental data is still necessary to properly relate the mechanical/biological envi-ronment to the scaffold microstructure geometry, this model represents an important step towards optimizing geometry of functionally graded scaffolds and/or stimulation regimes based on mechanobiological criteria.
Author Contributions
Conceived and designed the experiments: AB AEU MF. Wrote the paper: AB. Conceived and designed the algorithm: AB. Edited the algorithm: AEU MF. Wrote the paper: AB. Edited the manuscript: AEU MF G. Mori. Supervised the study and the article writing: G. Monno.
References
1. Mia X, Sun D. Graded/Gradient Porous Biomaterials. Materials. 2010; 3: 26–47.
2. Leong KF, Chua CK, Sudarmadji N, Yeong WY. Engineering functionally graded tissue engineering scaffolds. J Mech Behav Biomed Mater. 2008; 1: 140–152. doi:10.1016/j.jmbbm.2007.11.002PMID: 19627779
3. Tampieri A, Celotti G, Sprio S, Delcogliano A, Franzese S. Porosity-graded hydroxyapatite ceramics to replace natural bone. Biomaterials. 2001; 22: 1365–1370. PMID:11336309
4. Pan Z, Duan P, Liu X, Wang H, Cao L, He Y, et al. Effect of porosities of bilayered porous scaffolds on spontaneous osteochondral repair in cartilage tissue engineering. Regenerative Biomaterials. 2015: 9–
19.
5. Bailey BM, Nail LN, Grunlan MA. Continuous gradient scaffolds for rapid screening of cellmaterial inter-actions and interfacial tissue regeneration. Acta Biomater. 2013; 9: 8254–8261. doi:10.1016/j.actbio.
2013.05.012PMID:23707502
6. Yang J, Kang Y, Browne C, Jiang T, Yang Y. Graded Porousβ-Tricalcium Phosphate Scaffolds Enhance Bone Regeneration in Mandible Augmentation. J Craniofac Surg. 2015; 26: e148–e153. doi:
10.1097/SCS.0000000000001383PMID:25675019
8. Lu WW, Zhao F, Luk KDK, Yin YJ, Cheung KMC, Cheng GX, et al. Controllable porosity hydroxyapatite ceramics as spine cage: fabrication and properties evaluation. J Mater Sci Mater Med. 2003; 14: 1039–
1046. PMID:15348496
9. Pompe W, Worch H, Epple M, Friess W, Gelinsky M, Greil P, et al. Functionally graded materials for bio-medical applications. Mat Sci Eng A Struct. 2003; 362: 40–60.
10. Rodríguez-Lorenzo LM, Ferreira JMF. Development of porous ceramic bodies for applications in tissue engineering and drug delivery systems. Mater Res Bull. 2004; 39: 83–91.
11. Muthutantri A, Huang J, Edirisinghe M. Novel preparation of graded porous structures for medical engi-neering. J R Soc Interface. 2008; 5: 1459–1467. doi:10.1098/rsif.2008.0092PMID:18426768
12. Lee BT, Kang IC, Gain AK, Kim KH, Song HY. Fabrication of pore-gradient Al2O3–ZrO2sintered bodies by fibrous monolithic process. J Eur Ceram Soc. 2006; 26: 3525–3530.
13. Macchetta A, Turner IG, Bowen CR. Fabrication of HA/TCP scaffolds with a graded and porous struc-ture using a camphene-based freeze-casting method. Acta Biomater. 2009; 5: 1319–1327. doi:10.
1016/j.actbio.2008.11.009PMID:19112055
14. Chua CK, Leong KF, Sudarmadji N, Liu MJJ, Chou SM. Selective laser sintering of functionally graded tissue scaffolds. Mater Res Bull. 2011; 36: 1006–1014.
15. Zadpoor AA. Bone tissue regeneration: the role of scaffold geometry. Biomater Sci. 2015; 3: 231–245.
doi:10.1039/c4bm00291aPMID:26218114
16. Bidan CM, Kommareddy KP, Rumpler M, Kollmannsberger P, Bréchet YJ, Fratzl P, et al. How linear tension converts to curvature: geometric control of bone tissue growth. PLoS ONE. 2012; 7: e36336
doi:10.1371/journal.pone.0036336PMID:22606256
17. Feng YF, Wang L, Li X, Ma ZS, Zhang Y, Zhang ZY, et al. Influence of Architecture ofβ-Tricalcium Phosphate Scaffolds on Biological Performance in Repairing Segmental Bone Defects. PLoS ONE. 2012; 7: e49955 doi:10.1371/journal.pone.0049955PMID:23185494
18. Guyot Y, Papantoniou I, Chai YC, Van Bael S, Schrooten J, Geris L. A computational model for cell/ ECM growth on 3D surfaces using the level set method: a bone tissue engineering case study. Biomech Model Mechanobiol. 2014; 13: 1361–1371. doi:10.1007/s10237-014-0577-5PMID:24696122
19. Rainer A, Giannitelli SM, Accoto D, De Porcellinis S, Guglielmelli E, Trombetta M. Load-Adaptive Scaf-fold Architecturing: A Bioinspired Approach to the Design of Porous Additively Manufactured ScafScaf-folds with Optimized Mechanical Properties. Ann Biomed Eng. 2012; 40: 966–975. doi:
10.1007/s10439-011-0465-4PMID:22109804
20. Dias MR, Guedes JM, Flanagan CL, Hollister SJ, Fernandes PR. Optimization of scaffold design for bone tissue engineering: A computational and experimental study. Med Eng Phys. 2014; 36: 448–457.
doi:10.1016/j.medengphy.2014.02.010PMID:24636449
21. Coelho PG, Hollister SJ, Flanagan CL, Fernandes PR. Bioresorbable scaffolds for bone tissue engi-neering: optimal design, fabrication, mechanical testing and scale-size effects analysis. Med Eng Phys. 2015; 37: 287–296. doi:10.1016/j.medengphy.2015.01.004PMID:25640805
22. Boccaccio A, Ballini A, Pappalettere C, Tullo D, Cantore S, Desiate A. Finite Element Method (FEM), Mechanobiology and Biomimetic Scaffolds in Bone Tissue Engineering. Int J Biol Sci. 2011; 7: 112–
132. PMID:21278921
23. Wieding J, Wolf A, Bader R. Numerical optimization of open-porous bone scaffold structures to match the elastic properties of human cortical bone. J Mech Behav Biomed Mater. 2014; 37: 56–68. doi:10.
1016/j.jmbbm.2014.05.002PMID:24942627
24. Boccaccio A, Uva AE, Fiorentino M, Lamberti L, Monno G. A Mechanobiology-based Algorithm to Opti-mize the Microstructure Geometry of Bone Tissue Scaffolds. Int J Biol Sci. 2016; 12: 1–17. doi:10.
7150/ijbs.13158PMID:26722213
25. Byrne DP, Lacroix D, Planell JA, Kelly DJ, Prendergast PJ. Simulation of tissue differentiation in a scaf-fold as a function of porosity, Young’s modulus and dissolution rate: application of mechanobiological models in tissue engineering. Biomaterials. 2007; 28: 5544–5554. PMID:17897712
26. Boccaccio A, Pappalettere C, Kelly DJ. The influence of expansion rates on mandibular distraction osteogenesis: a computational analysis. Ann Biomed Eng. 2007; 35: 1940–1960. PMID:17768683
27. Boccaccio A, Prendergast PJ, Pappalettere C, Kelly DJ. Tissue differentiation and bone regeneration in an osteotomized mandible: a computational analysis of the latency period. Med Biol Eng Comput. 2008; 46: 283–298. PMID:17899238
28. Boccaccio A, Kelly DJ, Pappalettere C. A Mechano-Regulation Model of Fracture Repair in Vertebral Bodies. J Orthop Res. 2011; 29: 433–443. doi:10.1002/jor.21231PMID:20886646
30. Huiskes R, van Driel WD, Prendergast PJ, Søballe K. A biomechanical regulatory model of peripros-thetic tissue differentiation. J Mater Sci Mater Med. 1997; 8: 785–788. PMID:15348791
31. Prendergast PJ, Huiskes R, Søballe K. Biophisical stimuli on cells during tissue differentiation at implant interfaces. J Biomech. 1997; 30: 539–548. PMID:9165386
32. Lacroix D, Prendergast PJ. A mechano-regulation model for tissue differentiation during fracture heal-ing: analysis of gap size and loading. J Biomech. 2002; 35: 1163–1171. PMID:12163306
33. Boccaccio A, Lamberti L, Pappalettere C. Effects of aging on the latency period in mandibular distrac-tion osteogenesis: a computadistrac-tional mechano-biological analysis. J Mech Med Biol. 2008; 8: 203–225.
34. Checa S, Prendergast PJ. A mechanobiological model for tissue differentiation that includes angiogen-esis: A lattice-based modeling approach. Ann Biomed Eng. 2009; 37: 129–145. doi:
10.1007/s10439-008-9594-9PMID:19011968
35. Sandino C, Checa S, Prendergast PJ, Lacroix D. Simulation of angiogenesis and cell differentiation in a CaP scaffold subjected to compressive strains using a lattice modeling approach. Biomaterials. 2010; 31: 2446–2452. doi:10.1016/j.biomaterials.2009.11.063PMID:19969348
36. Mehdizadeh H, Sumo S, Bayrak ES, Brey EM, Cinar A. Three-dimensional modeling of angiogenesis in porous biomaterial scaffolds. Biomaterials. 2013; 34: 2875–2887. doi:10.1016/j.biomaterials.2012.12. 047PMID:23357368
37. Bailón-Plaza A, Van Der Meulen MCH. A mathematical framework to study the effects of growth factor influences on fracture healing. J Theor Biol. 2001; 212: 191–209. PMID:11531385
38. Hendrikson WJ, van Blitterswijk CA, Verdonschot N, Moroni L, Rouwkema J. Modeling Mechanical Sig-nals on the Surface ofμCT and CAD Based Rapid Prototype Scaffold Models to Predict (Early Stage) Tissue Development. Biotechnol Bioeng. 2014; 111: 1864–1875. doi:10.1002/bit.25231PMID: 24824318
39. Rumpler M, Woesz A, Dunlop JW, van Dongen JT, Fratzl P. The effect of geometry on three-dimen-sional tissue growth. J. R. Soc. Interface. 2008; 5: 1173–1180. doi:10.1098/rsif.2008.0064PMID: 18348957
40. Karageorgiou V, Kaplan D. Porosity of 3D biomaterial scaffolds and osteogenesis. Biomaterials. 2005; 26: 5474–5491. PMID:15860204
41. Yang SF, Leong KF, Du ZH, Chua CK. The design of scaffolds for use in tissue engineering. Part 1, tra-ditional factors. Tissue Eng. 2001; 7: 679–689. PMID:11749726