Efficiency parameters estimation in gemstones cut design using
artificial neural networks
Adriano A. Mol
a, Luiz S. Martins-Filho
b,*, Jose´ Demisio S. da Silva
c, Ronilson Rocha
daCentro de Estudos em Design de Gemas e Jo´ias, Univ. do Estado de Minas Gerais, Av. Antonio Carlos 7545, 31270-010 Belo Horizonte/MG, Brazil bDepartamento de Computac¸a˜o, Univ. Federal de Ouro Preto, Campus Morro do Cruzeiro, 35400-000 Ouro Preto/MG, Brazil
cLab. Associado de Computac¸a˜o e Matema´tica Aplicada, Inst. Nacional de Pesquisas Espaciais, Caixa Postal 515, 12227-010 S. Jose´ dos Campos/SP, Brazil dDepartamento de Eng. de Controle e Automac¸a˜o, Univ. Federal de Ouro Preto, Campus Morro do Cruzeiro, 35400-000 Ouro Preto/MG, Brazil
Received 28 September 2005; received in revised form 23 March 2006; accepted 15 May 2006
Abstract
This paper deals with the problem of estimating cut results for faceted gemstones. The proposed approach applies artificial neural networks for a faceted gemstones analysis tool that could be further developed for incorporation in a computer-aided-design (CAD) context. Basic concepts concerning gemstone processing are introduced and the design of computational tools using neural networks is discussed. The model presented proposes two criteria to assess the efficiency of lapidary designs for rock crystal quartz: brilliance and yield. Closing the article, 62 different lapidary models were used to train and test the neural network tool.
Ó2006 Elsevier B.V. All rights reserved.
Keywords: Faceted gemstones; Lapidary design; Design efficiency; Artificial neural networks
1. Introduction
The minerals qualified as gemstones are remarkable and attractive in consequence of special characteristics like color, brilliance, transparency, hardness, durability and rarity. Its beauty, essentially associated with their optical features, has made these precious stones very attractive for diverse applications related to adornment objects and its rarity has assigned high exchange value to them. Man’s fascination with gemstones dates from prehistoric times and since the beginning of civilization, examples of efforts to improve the optical properties of some gemstones are found, aiming at enhancing its beauty and, consequently, its exchange value[1].
One of the most important ways to aggregate value to the gemstones is lapidary, the general denomination of the cutting and polishing processes applied to solid
materi-als. In the field related to this work, lapidary techniques are still being developed in terms of producing even more sophisticated models, seeking to control color saturation, to maximize the return of incident light from the observer perspective, to obtain interesting distortion effects of light rays inside the gem, to reduce wastage in the raw material cutting, or simply to allow the setting of the gemstone on the jewel assembly [2,3].
This article presents a study of the application of artifi-cial neural networks (ANN) on efficiency in parameters estimation and evaluation of lapidary design results consid-ering the technique of faceting. Application of ANN-based tools on materials science and engineering is becoming an interesting issue for design, characterization and evaluation problems. For instance, some useful ANN applications on materials science can be found in[5,4,6]. The results or effi-ciency of such lapidary designs can be measured in terms of optical performance and weight retention. The optical per-formance of gemstones can be judged primarily for its bril-liance, defined as the portion of incident light that returns to an observer after traveling through different paths inside
0927-0256/$ - see front matter Ó2006 Elsevier B.V. All rights reserved. doi:10.1016/j.commatsci.2006.05.012
* Corresponding author. Tel.: +55 (31) 3559 1663; fax: +55 (31) 3559 1660.
E-mail address:[email protected](L.S. Martins-Filho).
the gem. The weight retention, here called yield, is the weight ratio between the raw material and the final faceted gem obtained after the cutting and polishing tasks [7–9]. Computational tools based on artificial neural networks have been applied to different kinds of problems where it is necessary to extract knowledge from strongly nonlinear and complex systems, being the case of the relationship between the geometry of three-dimensional faceted gem and its brilliance and yield results.
This study’s subject relevance can be observed in some recent related works concerning these two main gems prop-erties. For instance, an interesting hybrid artificial intelli-gence approach for the yield improvement is described in
[10]. A computational tool for quality grading, based on
rule-based knowledge representation, fuzzy logic and genetic algorithms, provides better understanding of lapid-ary possibilities and therefore can contribute to wastage reduction when real faceting actually takes place. Another innovative work presents a detailed study of optical effects inside a polyhedral faceted gem, modeling the complex behavior of light in such materials, and proposes an effi-cient computer graphics algorithm for rendering faceted gemstones and obtaining a photo-realistic graphic repre-sentation of optical effects such as color and brightness
[11].
The international jewellery industry is the final destina-tion of most part of faceted gems, turning about 14 billion dollars per year on the international trade (estimative of
Fig. 1. Nomenclature of a faceted gemstone.
Fig. 2. Top view of typical gemstones: (a) round, (b) oval, (c) navette or marquise, (d) pear, (e) cushion, (f) square, (g) rectangular or baguette, (h) octagonal or emerald cut.
Brazilian Institute of Precious Gemstones and Metals – IBGM[12]). Developing countries such as Brazil, the major producer of rough gemstones, could improve economical turnovers with better utilization of available mineral resources. It can be verified in the European jewellery report of the Centre for the Promotion of Imports from Developing Countries – CBI [13]. The lapidary taken as an industrial design process shows ways to aggregate value to mineral production and to improve this relevant sector. The Brazilian case of under-exploitation of its actual eco-nomic potential constitutes the main motivation for this study[14].
2. Lapidary
The lapidary as procedure to process minerals for adornment purpose has its origins, according to historians, on the region of Iraq in 5th AC century. The early lapidary designs were obtained by polishing natural faces of crystals and pebbles found on alluvium deposits. Later appears the cabochon model, consisting of domed polished gemstones without facets, with smooth, rounded edges. Around the 13th DC century, better optical results are obtained with faceted lapidary models, produced using flat discs sprayed with powdered diamond and corundum to create small cuts
by abrasion. The shapes became prismatic to enhance the already known significant effects like brilliance and light dispersion. In the 20th century, lapidary designs for the diamond industry begin to be described by well-defined parameters, and started the ongoing research about the improvement of these models.
The basic nomenclature of a faceted model is shown in
Fig. 1. The model parameters are related to dimension pro-portions between the indicated elements. The cutting mod-els can present diverse characteristics in terms of shape.
Fig. 2shows some typical geometry shapes.
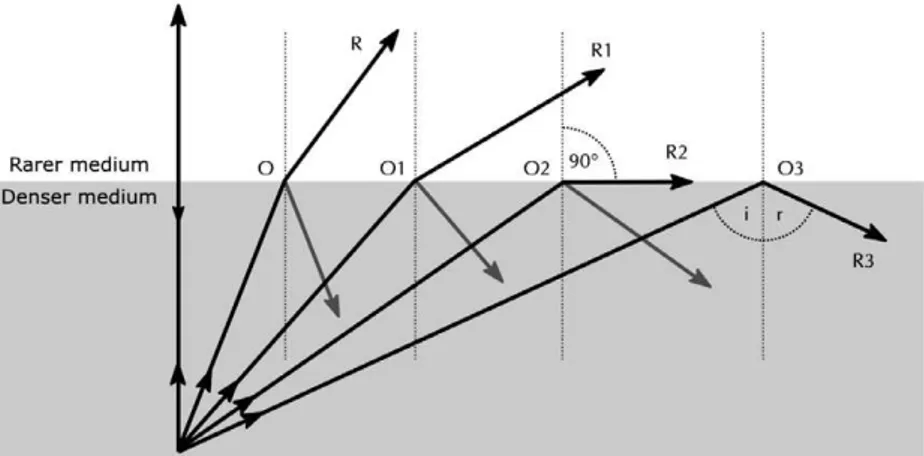
Analyzing the interaction of the light with a transparent gem, it is possible to remark the main physical phenomena
Fig. 4. Light ray path inside section of faceted gem.
in terms of geometric optics. When an incident light ray reaches the gem surface, part of it is reflected and the other part is transmitted or refracted across the air–gem inter-face. The refracted fraction of the ray travels inside the gem and so it repeats this phenomenon when it reaches another gem–air interface, at an internal surface this time.
Fig. 3 illustrates this optical phenomenon, where it is shown that there exists a certain angle value that delimi-tates the occurrence of refraction; this angle value is called critical angle. The Snell law gives the relation between the incident angle and refraction angle:
c v¼n¼
sini
sinr ð1Þ
wherecis light velocity in the air,vis the light velocity in-side the gem,nis the refraction index of the gem material, sin(i) is the sinus of incident angle, and sin(r) is the sinus of refraction angle.
Together with table size, the angles formed by the gem crown and the pavilion, with reference to the horizon plan (the girdle), define the geometry and are determinant of the brilliance criterion value, considering the refraction index of the specific gem material. Fig. 4 shows one incident angle being totally reflected back to observer eye after incising at an angle equal to pavilion angle a and being reflected at an anglev. The pavilion angles of a gemstone
should therefore be larger than the critical angle for each refraction index.
The brilliance, an essential property for a gem evalua-tion, is defined as the fraction of the incident light that returns to an external observer positioned frontally to the crown, after successive internal reflections.
Another main feature of a gem-cutting model is the yield, i.e., the weight ratio between uncut rough stone and finished faceted gem. In general, the raw material is presented to the lapidary processing in strongly irregular and diverse shapes. Consequently, for comparative crite-rion, a convention is established as a percent volume of the faceted gem inside a cube of the smallest size that may contain this gem.
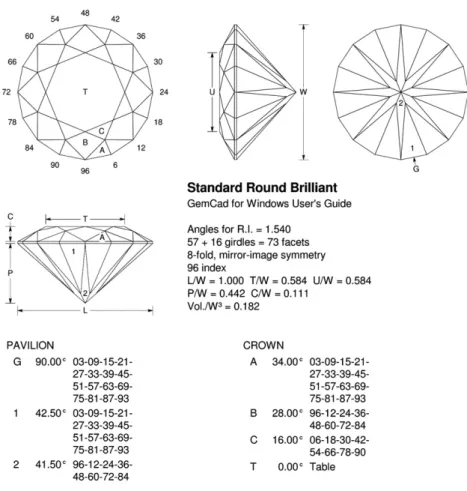
3. Description of the model
A cutting model can be defined through a diagram with the description of all geometric parameters, dimension ratios, quantity of facets, and necessary angles for each facet.Fig. 5 shows an example of a cutting diagram for a round standard brilliant generated by GemCAD software. This specialized software provides an estimation of bril-liance and material utilization for the models considered in this article. Its estimation procedure is based on inverse ray tracing considering the geometry and refraction index
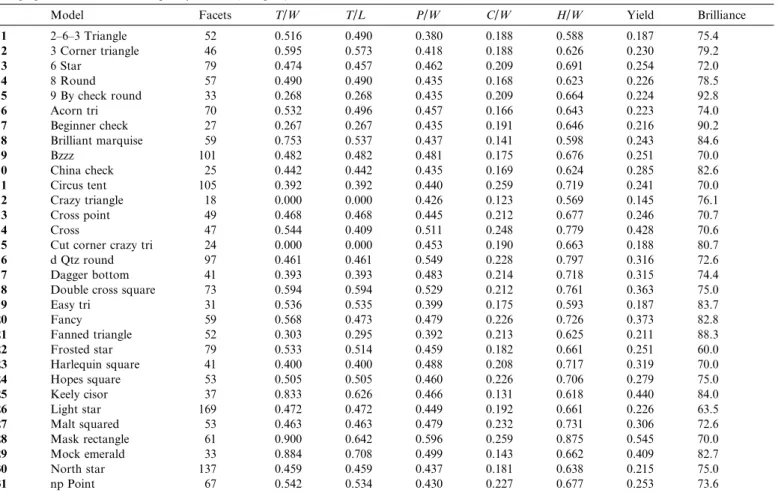
Table 1
Design parameters of studied lapidary models (first part)
Model Facets T/W T/L P/W C/W H/W Yield Brilliance
1 2–6–3 Triangle 52 0.516 0.490 0.380 0.188 0.588 0.187 75.4
2 3 Corner triangle 46 0.595 0.573 0.418 0.188 0.626 0.230 79.2
3 6 Star 79 0.474 0.457 0.462 0.209 0.691 0.254 72.0
4 8 Round 57 0.490 0.490 0.435 0.168 0.623 0.226 78.5
5 9 By check round 33 0.268 0.268 0.435 0.209 0.664 0.224 92.8
6 Acorn tri 70 0.532 0.496 0.457 0.166 0.643 0.223 74.0
7 Beginner check 27 0.267 0.267 0.435 0.191 0.646 0.216 90.2
8 Brilliant marquise 59 0.753 0.537 0.437 0.141 0.598 0.243 84.6
9 Bzzz 101 0.482 0.482 0.481 0.175 0.676 0.251 70.0
10 China check 25 0.442 0.442 0.435 0.169 0.624 0.285 82.6
11 Circus tent 105 0.392 0.392 0.440 0.259 0.719 0.241 70.0
12 Crazy triangle 18 0.000 0.000 0.426 0.123 0.569 0.145 76.1
13 Cross point 49 0.468 0.468 0.445 0.212 0.677 0.246 70.7
14 Cross 47 0.544 0.409 0.511 0.248 0.779 0.428 70.6
15 Cut corner crazy tri 24 0.000 0.000 0.453 0.190 0.663 0.188 80.7
16 d Qtz round 97 0.461 0.461 0.549 0.228 0.797 0.316 72.6
17 Dagger bottom 41 0.393 0.393 0.483 0.214 0.718 0.315 74.4
18 Double cross square 73 0.594 0.594 0.529 0.212 0.761 0.363 75.0
19 Easy tri 31 0.536 0.535 0.399 0.175 0.593 0.187 83.7
20 Fancy 59 0.568 0.473 0.479 0.226 0.726 0.373 82.8
21 Fanned triangle 52 0.303 0.295 0.392 0.213 0.625 0.211 88.3
22 Frosted star 79 0.533 0.514 0.459 0.182 0.661 0.251 60.0
23 Harlequin square 41 0.400 0.400 0.488 0.208 0.717 0.319 70.0
24 Hopes square 53 0.505 0.505 0.460 0.226 0.706 0.279 75.0
25 Keely cisor 37 0.833 0.626 0.466 0.131 0.618 0.440 84.0
26 Light star 169 0.472 0.472 0.449 0.192 0.661 0.226 63.5
27 Malt squared 53 0.463 0.463 0.479 0.232 0.731 0.306 72.6
28 Mask rectangle 61 0.900 0.642 0.596 0.259 0.875 0.545 70.0
29 Mock emerald 33 0.884 0.708 0.499 0.143 0.662 0.409 82.7
30 North star 137 0.459 0.459 0.437 0.181 0.638 0.215 75.0
of a specific gem-cutting model. Although considered fairly simple, compared to very sophisticated models such as described in [7,11], its results show similar relations between proportional variations and brilliance in macro-analysis. To provide the models for the study, designs for quartz were collected at [15], a commercial website that presented an organized and easily accessible collection. The GemCAD outputs for brilliance and yield will be used to evaluate the results obtained by the proposed neural network based tool.
According to this study assumptions concerning the fac-eted gemstone evaluation, two properties are preponderant: brilliance and yield. The gem design parameters, supposedly determinant of these evaluation aspects, can be enumerated: (i) total number of gem facetsF; (ii) dimension ratio between table and width T/W; (iii) dimension ratio between table and lengthT/L; (iv) dimension ratio between pavilion and widthP/W; (v) dimension ratio between crown and width C/W; (vi) dimension ratio between total height (crown height + girdle thickness + pavilion depth) and width H/ W[7,16]. Remark: for round models like this one showed inFig. 5,W=Land, consequently,T/W=T/L.Tables 1 and 2present the design parameters values for the studied gem models.
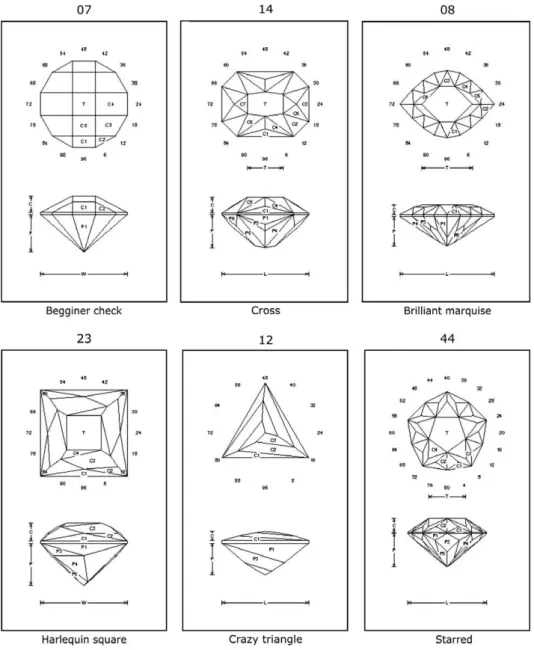
Even if not exhaustive, given the diversity of faceting possibilities, the lapidary diagrams studied comprise
vari-ous shapes and geometric features to ensure a representa-tive faceted gemstones assortment. Some examples of the considered models are shown inFig. 6.
4. Parameters estimation
The proposed tool for faceted gemstones evaluation is based on artificial neural networks, which are intrinsically parallel and distributed computation systems inspired on the biological brain functions. These systems associate input and output data through artificial neuron units, or nodes, each of which performs a linear combination of the received signals and sends the result to an activation function used to simulate the firing process of a biological neuron. They are organized in layers from which they con-nect to each of the neurons in the subsequent layer, thus leading to a neural network. Weights values are assigned to the connections among the neurons in the different lay-ers. A general scheme of a feed-forward ANN is presented in Fig. 7in which the signals propagate from the input to the output without any kind of signal feedback.
A mathematical model of the artificial neuron function was initially proposed by neuro-physiologist Warren McCulloch and mathematician Walter Pitts, in 1943 [18]. In this model, the neuron output is activated by the linear combination of the inputs (cf.Fig. 8). It can be considered
Table 2
Design parameters of studied lapidary models (second part)
Model Facets T/W T/L P/W C/W H/W Yield Brilliance
32 op Blade 77 0.482 0.482 0.437 0.150 0.607 0.202 82.1
33 Point square check 24 0.000 0.000 0.435 0.225 0.679 0.292 88.5
34 Astor star 49 0.472 0.472 0.537 0.202 0.759 0.339 89.2
35 Diagonal 1.5 15 0.856 0.571 0.500 0.338 0.858 0.767 89.4
36 Glass triangle 67 0.433 0.432 0.447 0.198 0.666 0.202 80.0
37 Diamond perception 25 0.347 0.261 0.361 0.141 0.522 0.167 84.6
38 Prop 25 0.351 0.351 0.458 0.173 0.651 0.256 93.2
39 Quartz shield 44 0.507 0.507 0.426 0.191 0.637 0.232 82.8
40 z Diamonds 13 0.892 0.595 0.500 0.254 0.774 0.651 90.7
41 Scot plaid 97 0.511 0.442 0.469 0.202 0.691 0.271 69.2
42 Simply x’ed 25 0.541 0.541 0.488 0.207 0.714 0.324 70.0
43 Spin v 37 0.458 0.397 0.475 0.276 0.771 0.297 65.0
44 Starred 71 0.471 0.471 0.428 0.176 0.624 0.199 89.8
45 Step up 49 0.493 0.493 0.452 0.153 0.625 0.249 80.0
46 Straight pedals 55 0.566 0.490 0.501 0.243 0.764 0.306 76.0
47 Strip o 59 0.614 0.512 0.485 0.236 0.741 0.343 74.0
48 Wink 51 0.768 0.578 0.485 0.215 0.720 0.353 78.2
49 Squeezed square 20 0.000 0.000 0.458 0.144 0.622 0.241 94.6
50 Square ziggie 14 0.000 0.000 0.466 0.144 0.630 0.336 86.4
51 Mock check squares 17 0.807 0.807 0.466 0.239 0.726 0.372 90.3
52 Two spin star 30 0.000 0.000 0.450 0.164 0.635 0.215 92.8
53 Glider 12 0.913 0.489 0.431 0.127 0.578 0.257 81.3
54 Huntress 43 0.457 0.443 0.447 0.164 0.631 0.222 87.9
55 Kiss 12 0.000 0.000 0.459 0.230 0.709 0.174 88.6
56 Low boy 45 0.713 0.713 0.454 0.129 0.604 0.202 75.8
57 Spike 19 0.305 0.305 0.307 0.106 0.434 0.092 93.1
58 Spiro 46 0.384 0.357 0.441 0.193 0.654 0.239 86.9
59 Tess’s pentagram 23 0.820 0.640 0.396 0.175 0.591 0.256 82.6
60 Triga light house 58 0.509 0.492 0.420 0.194 0.633 0.204 80.2
61 Thorn 17 0.840 0.674 0.383 0.130 0.532 0.179 91.2
as a transfer function producing the output value as a tion of the weighted inputs. Different mathematical func-tions may be used for the neuron activation.
The main concern in artificial neural networks is the assignment of appropriate weights to the connections. In 1958, based on the works of McCulloch and Pitts and of neuro-physiologist Donald Hebb, who first postulated a learning paradigm for the biological neurons, Frank Rosenblatt proposed a learning algorithm called the per-ceptron neural network, which in its simplest architecture is composed of a McCulloch and Pitts neuron with several inputs. This algorithm gradually finds the appropriate weights by presenting input–output pairs to the network, that is, the procedure searches for the extraction of input–output relation. When the training procedure is accomplished for an appropriate choice of training data set, the ANN is able to estimate output variables for
unknown input data. However, it may only solve classifica-tion problems of linearly separated classes.
Fig. 6. Some lapidary models studied in this work.
Several subsequent connected layers of perceptrons lead to the multilayer perceptron architecture as inFig. 7. That is, in addition to the input and output layers, the multilayer architecture may have a number of intermediate layers, called hidden layers. The use of nonlinear activation func-tions in the neurons required the development of a different learning strategy to approach nonlinear problems. A train-ing procedure for the multilayer perceptron was proposed by Rumelhart in 1986, based on the back-propagation of the error signals computed at the neural network outputs. The algorithm consists of estimating the local gradient of each neuron in each layer to proportionally adjust the weights.
In the learning process, input and output data are orga-nized in vectors. The number of neurons in the input and output layers depend on the input and output vectors dimensions, respectively. The estimation of the number of hidden neurons, however, is an unsolved issue and usually
it is achieved by experimenting different neural network architectures and choosing the one that solves the problem requiring less computation resources.
In this training algorithm, when a new input vectoriis chosen from the training data and it is presented to the neural network input, an output vector oaresults and it is compared to the desired (and known) output vector od. A possible description of the network error may be given by the squared difference:
e¼ ðodoaÞT ðodoaÞ ð2Þ
The error is a measure of how close the ANN result is from the desired value for a particular input. The purpose of the backpropagation algorithm is to minimize the sum of squared errors for the entire training data (the mean square error – mse). This problem can be described by the minimization of an objective function:
mse¼ 1
N
XN
n¼1
en¼ 1 N
XN
n¼1
ðodðnÞoaðnÞÞT ðodðnÞoaðnÞÞ ð3Þ
The backpropagation algorithm is an interactive resolu-tion approach for this optimizaresolu-tion problem. The numeri-cal resolution may require many cycles of presenting the training data and controlling the objective function decrease until it reaches a target value. Many computa-tional packages of numerical calculus offer toolboxes implementing different training algorithms based on differ-ent optimization strategies.
The main step of the algorithm is the weight adjustment process performed after calculation of the local gradient of the neuron k, as it is described in[18]. A weightwkifrom
theith input to neuronkis updated as
wki¼wkiþgdkyi ð4Þ
Fig. 8. A mathematical model of a computational neuron.
wheregis the learning rate;dkis the local gradient of
neu-ronk; andyiis the input flowing through weightwki.
The design of ANN architecture for a specific applica-tion requires the choice of the network type choice, the number of layers, the input and output variables, and the mathematical activation function of each neuron. Further-more, it is necessary to collect relevant data relative to the problem. In this paper, an ANN based solution is pursued for the problem of lapidary design. The considered data for the rock crystal quartz is composed by the 62 faceting dia-grams set discussed in Section2.
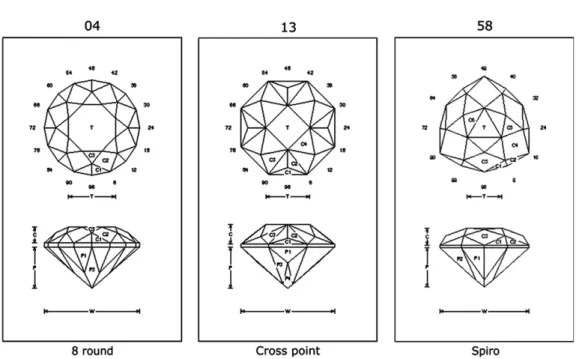
In the network training procedure, the faceting diagrams were divided in two groups: a training group with 59 mod-els, and a second group with three models for testing the resulting network. The models of testing group were cho-sen arbitrarily: numbers 4, 13 and 58, seeFig. 9. The input vectors were normalized and scaled (values between 0 and 1), and the number of neurons for each layer was defined by considering practical hints based on several ANN appli-cations described in[18].
The proposed neural network architecture was designed as a multilayer perceptron composed by an input layer with 6 nodes, one hidden layer with 12 nodes, and the output layer with 2 nodes corresponding to the brilliance and yield attributes. The activation function was chosen as the logis-tic function with output in the closed interval (0, 1)[17–19]. This function is monotonically increasing and smooth, which are essential features for the backpropagation algorithm:
y¼ 1
1þex ð5Þ
Other ANN parameters are the learning rate and the target error. In the present implementation an adaptive learning rate approach was chosen while the target error was established as 103, based on the project choices.
5. Results
The training process was followed by the test, where the trained ANN-based tool was applied to analyze the testing data set, composed of models numbers4(eight round),13
(cross point), and58(spiro). This procedure was repeated several times because the training algorithm uses random numbers generator to initialize the network state (the values of biases and connections’ weights).Table 3 shows the results for 45 training and test procedure: the error average for the six estimated parameters values (brilliance and yield of three models), the maximum value between the six parameters errors, and final value of the training performance index after 5000 epochs. For these 45 repeti-tions, the average values of mean and maximum errors obtained are 4.62% and 9.74%, respectively.
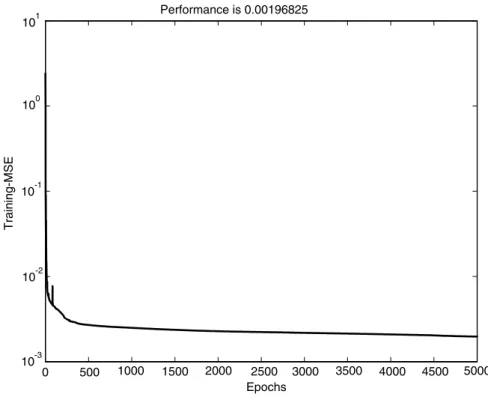
The details of one of these training and test procedures, the results of each parameter estimation and its known val-ues (brilliance and yield) for the three test group models, and the respective errors can be seen inTable 4, and the
variation of the training performance error (the mean square error – mse) during 5000 epochs (presentation of Table 3
Results of training and tests procedure: mean and maximum error, and training performance index
Training and test Mean estimation error (%) Max estimation error (%) Performance index
1 4.78 9.35 1.92
2 6.45 12.21 1.49
3 6.24 9.73 1.32
4 5.32 12.97 1.44
5 4.58 7.82 1.79
6 5.86 11.61 1.78
7 3.80 7.82 1.65
8 4.61 8.99 2.06
9 4.37 8.52 1.17
10 3.39 7.91 1.76
11 3.95 6.86 2.00
12 5.05 8.61 1.66
13 3.55 8.61 1.57
14 5.80 13.44 1.31
15 3.99 9.02 2.20
16 5.14 11.04 1.31
17 3.41 8.83 1.86
18 4.67 9.37 1.70
19 3.67 8.74 1.17
20 4.66 10.78 1.35
21 4.70 11.52 1.11
22 5.71 12.30 1.23
23 5.48 9.86 1.32
24 5.13 9.64 1.92
25 4.96 13.76 1.61
26 5.57 9.72 1.74
27 4.13 10.21 1.40
28 6.68 12.82 1.73
29 6.44 10.80 1.61
30 3.88 9.37 1.40
31 3.35 8.60 1.85
32 5.06 9.48 1.98
33 5.34 10.87 1.84
34 4.47 10.86 1.83
35 4.66 11.49 2.67
36 5.46 11.82 1.57
37 5.19 12.95 1.46
38 4.36 9.01 2.23
39 2.95 7.67 1.40
40 4.39 10.00 1.38
41 3.95 10.21 1.38
42 5.47 8.49 1.40
43 4.22 8.94 2.11
44 4.55 8.03 1.96
45 3.33 7.49 1.84
Table 4
Known and estimated values for brilliance and yield (models4,13and58), and respective errors
Model Brilliance (known) Brilliance (estimated) Error (%) Yield (known) Yield (estimated) Error (%) 4Eight round
78.5 74.7 4.81 0.226 0.233 3.15
13Cross point
70.7 71.4 0.98 0.246 0.266 8.03
the training data set) is shown inFig. 10. Observe that the mse reach a value about 103. At the end of this learning procedure, the connections weight were obtained, repre-senting the extracted knowledge of the studied problem.
For the following tests, a different strategy is considered: the called regularization method. This training strategy is applied to make the most of a limited supply of studied problem data, and the main goal is to improve the ANN generalization. The main training procedure difference con-cerns the performance function (usually the sum of squares of the network errors). The optimal performance function is obtained by adding a term that takes in account the mean of the sum of squares of the network weights and biases.
msereg¼cmseþ ð1cÞmsw ð6Þ
wherecis the performance ratio, and
msw¼1
n
Xn
j¼1
w2j ð7Þ
This training performance function allows the network to have smaller weights and biases, and the network re-sponse becomes smoother and less likely to overfit. An automated regularization, that can determine the optimal regularization parameters, based on Bayes’ theorem, is proposed in[20]. In this automated procedure, the weights and biases of the network are considered as random vari-ables with specified distributions. The parameters are re-lated to the unknown variances associated with these distributions, and they can be estimated using statistical techniques.
The results of the training and test procedure using reg-ularization can be seen in Table 5. These results present a strong convergence and repetition (without the results fluc-tuations seen in the precedent used strategy). The architec-ture considered here presents the input layer with six neurons, one hidden layer with six neurons, and the output layer with two neurons. This ANN structure was obtained using pruning methods[18,19]. For these tests, the average values of mean and maximum errors obtained are 4.05% and 11.40%.
These results show that the ANN-based computational tool was capable of extracting knowledge from the predic-tion problem concerning evaluapredic-tion parameters of faceting diagrams. The refinement of this CAD tool depends mainly of amassing a more representative and diversified sample of lapidary gemstone models, including an exhaustive array of shapes and proportions.
Considering the diversity of geometric possibilities of lapidary models, the limitations of the models data set used in the work, the physical characteristics of the problem, the important complexity of the relationship between the input
0 500 1000 1500 2000 2500 3000 3500 4000 4500 5000 10-3
10-2 10-1 100
101 Performance is 0.00196825
Epochs
Training-MSE
Fig. 10. Evolution of the performance index (mean square error of the ANN) during the training procedure.
Table 5
Generalization method: known and estimated values for brilliance and yield (models4,13and58), and respective errors
Model Brilliance (known)
Brilliance (estimated)
Error (%)
Yield (known)
Yield (estimated)
Error (%)
4Eight round
78.5 75.6 3.65 0.226 0.233 3.03
13Cross point
70.7 71.3 0.86 0.246 0.274 11.40
(F,T/W,T/L,P/W,C/W,H/W) and the output (brilliance and yield) data, the obtained results show the proposed ANN architecture may be considered as a promising com-putational tool for lapidary development.
If additional data is made available, the proposed ANN based system can be easily retrained to capture additional features from the data, thus enhancing its classification performance.
6. Conclusion
This paper presented a general study of the problem of gem lapidary as a combination of physical and geometric effects influencing the evaluated beauty of faceted gems, through the light-material interactions, the material prop-erties, and the polyhedral shapes. Considering the specific case of solid crystal quartz, an ANN-based design tool was proposed for the prediction of important evaluation properties (brilliance and yield).
The training and test procedures confirmed the work hypothesis about the exploitable adequacy of this class of artificial intelligence instrument, and it opens interesting possibilities for CAD tools development in the search for faceted gems design improvements, concerning an eco-nomic domain of indubitable relevance, specially for devel-oping countries with important minerals resources, as the case of Brazil.
Acknowledgement
The authors would like to acknowledge the financial support of CNPq, FAPEMIG, FAPESP, and CAPES (Brazil).
References
[1] E.J. Gubelin, F.-X. Erni, Gemstones: Symbols of Beauty and Power, Geoscience Press, Tucson, 2000.
[2] R. Webster, Gems: Their Sources, Descriptions and Identification, vol. 2, Butterworth, London, 2002.
[3] W.E. Dengenhard, Gems and Gemology 14 (9) (1974) 259–270. [4] K. Cai, J.T. Xia, et al., Computational Materials Science 34 (2)
(2005) 166–172.
[5] P. Fermo, F. Cariati, et al., Applied Physics A: Materials Science and Processing 79 (2004) 299–307.
[6] A. Shahsavand, A. Ahmadpour, Computers and Chemical Engineer-ing 29 (10) (2005) 2134–2143.
[7] T.S. Hemphill, I.M. Reinitz, et al., Gems and Gemology 34 (3) (1998) 58–183.
[8] K. Inoue, Journal of the Gemmological Society of Japan 20 (14) (1999) 153–167.
[9] I.M. Reinitz, M.L. Johnson, et al., Gems and Gemology 37 (3) (2001) 174–197.
[10] T. Holden, M. Serearuno, Journal of Intelligent Manufacturing 16 (1) (2005) 21–38.
[11] S. Guy, C. Soler, ACM Transactions on Graphics 23 (3) (2004) 231– 238.
[12] Brazilian Institute of Precious Gemstones and Metals, IBGM Website (in Portuguese).<http://www.ibgm.com.br>(accession 2005). [13] Centre for the Promotion of Imports from Developing Countries, EU
Market Survey 2004: Jewellery, CBI, Rotterdam, 2004.
[14] J.R. Sauer, Brazil, Paradise of Gemstones, Amsterdam Sauer, Rio de Janeiro, 1982.
[15] J. Graham, Gram faceting website. <http://www.faceters.com>
(accession 2004).
[16] J.M. Sasia´n, P. Yantzer, T. Tivol, Optics and Photonics News 14 (4) (2003) 24–31.
[17] A.K. Jain, J. Mao, K.M. Mohiuddin, IEEE Computer 29 (3) (1996) 56–63.
[18] S. Haykin, Neural Networks: A Comprehensive Foundation, Prentice Hall, New York, 1998.
[19] I.A. Basheer, M. Hajmeer, Journal of Microbiological Methods 43 (1) (2000) 3–31.