Targeted Re-Sequencing Identified rs3106189 at the 5
9
UTR of TAPBP and rs1052918 at the 3
9
UTR of TCF3 to Be
Associated with the Overall Survival of Colorectal Cancer
Patients
Jiaofang Shao1,2,3", Xiaoyan Lou3", Jun Wang3", Jing Zhang3
, Chen Chen3, Dasong Hua3, Fan Mo3, Xu Han3, Shu Zheng1*, Biaoyang Lin1,2,3,4,5*
1Cancer Institute (Key Laboratory of Cancer Prevention and Intervention, China National Ministry of Education), Second Affiliated Hospital, College of Medicine, Zhejiang University, Hangzhou, Zhejiang Province, China,2Collaborative Innovation Center for Diagnosis and Treatment of Infectious Diseases and State Key Laboratory for Diagnosis and Treatment of Infectious Diseases, The First Affiliated Hospital of Medical College, Zhejiang University, Hangzhou, China,3Systems Biology Division and Propriumbio Research Center, Zhejiang-California International Nanosystems Institute (ZCNI), Zhejiang University, Hangzhou, Zhejiang Province, China,4Swedish Medical Center, Seattle, Washington, United States of America,5Department of Urology, University of Washington, Seattle, Washington, United States of America
Abstract
Recent studies have demonstrated the power of deep re-sequencing of the whole genome or exome in understanding cancer genomes. However, targeted capture of selected genomic whole gene-body regions, rather than the whole exome, have several advantages: 1) the genes can be selected based on biology or a hypothesis; 2) mutations in promoter and intronic regions, which have important regulatory roles, can be investigated; and 3) less expensive than whole genome or whole exome sequencing. Therefore, we designed custom high-density oligonucleotide microarrays (NimbleGen Inc.) to capture approximately 1.7 Mb target regions comprising the genomic regions of 28 genes related to colorectal cancer including genes belonging to the WNT signaling pathway, as well as important transcription factors or colon-specific genes that are over expressed in colorectal cancer (CRC). The 1.7 Mb targeted regions were sequenced with a coverage ranged from 326to 456for the 28 genes. We identified a total of 2342 sequence variations in the CRC and corresponding adjacent
normal tissues. Among them, 738 were novel sequence variations based on comparisons with the SNP database (dbSNP135). We validated 56 of 66 SNPs in a separate cohort of 30 CRC tissues using Sequenom MassARRAY iPLEX Platform, suggesting a validation rate of at least 85% (56/66). We found 15 missense mutations among the exonic variations, 21 synonymous SNPs that were predicted to change the exonic splicing motifs, 31 UTR SNPs that were predicted to occur at the transcription factor binding sites, 20 intronic SNPs located near the splicing sites, 43 SNPs in conserved transcription factor binding sites and 32 in CpG islands. Finally, we determined that rs3106189, localized to the 59 UTR of antigen presenting tapasin binding protein (TAPBP), and rs1052918, localized to the 39 UTR of transcription factor 3 (TCF3), were associated with overall survival of CRC patients.
Citation:Shao J, Lou X, Wang J, Zhang J, Chen C, et al. (2013) Targeted Re-Sequencing Identified rs3106189 at the 59UTR of TAPBP and rs1052918 at the 39UTR of TCF3 to Be Associated with the Overall Survival of Colorectal Cancer Patients. PLoS ONE 8(8): e70307. doi:10.1371/journal.pone.0070307
Editor:Hiromu Suzuki, Sapporo Medical University, Japan
ReceivedMarch 14, 2013;AcceptedJune 19, 2013;PublishedAugust 5, 2013
Copyright:ß2013 Shao et al. This is an open-access article distributed under the terms of the Creative Commons Attribution License, which permits unrestricted use, distribution, and reproduction in any medium, provided the original author and source are credited.
Funding: This study was supported by grants from the Ministry of Science and Technology, China (2006DFA32950, 2006AA02A303, 2012AA02A204,2011ZX09307-001-05) and a grant from the National Science Foundation, China (81072060/H1618). The funders had no role in study design, data collection and analysis, decision to publish, or preparation of the manuscript.
Competing Interests:The authors have declared that no competing interests exist. * E-mail: [email protected] (BL); [email protected] (SZ)
"These authors are co-first authors on this work.
Introduction
With 639,000 deaths per year worldwide, colorectal cancer is the third most common form of cancer and the second leading cause of cancer-related deaths in the Western world (WHO, February 2009, http://www.who.int/mediacentre/factsheets/ fs297/en/) and in China [1,2]. To date, susceptibility to colorectal cancer has been characterized by the identification of rare inherited mutations in a small number of established genes such as mutations of theAPCgene, a gene first identified as the familial adenomatous polyposis (FAP) locus gene [3] that contributes to colorectal tumorigenesis [1,4]. SNPs (single nucleotide polymor-phisms) are the most frequent type of variation in the human
genome, occurring once every several hundred base pairs throughout the genome [5].
Recent studies have demonstrated the potential power of deep re-sequencing of candidate genes in human populations to detect rare variants and aid in the understanding of complex human traits [6]. Traditionally, cancer genome re-sequencing has been performed using exon amplification and conventional Sanger sequencing [7–9]. More recently, the whole genome or whole exome (by exome capturing) has been used due to technological advances and reduced cost in next generation sequencing [10–12]. For example, Bass et al. applied whole genome sequencing to sequence the tumors of 9 CRC patients and identified 11 in-frame
gene fusion events including the fusion of VTI1A and TCF7L2, which was found in 3 of 97 colorectal cancers [13]. The Cancer Genome Atlas Network recently performed exome capture DNA sequencing of colorectal cancers and identified frequently mutated genes including APC, TP53, KRAS, PIK3CA, FBXW7, SMAD4, TCF7L2, NRAS, ARID1A, SOX9 and FAM123B (WTX) genes [14].
Moreover, instead of capturing the whole exome, targeted capture of selected genes of interest will reduce cost and potentially move NGS into clinical practice. For example, Pritchard et al. developed Coloseq, in which selected regions of 1.1 Mb of DNA including 209 kb inMLH1,MSH2,MSH6,PMS2,EPCAM,APC, andMUTYHwere targeted, captured and subjected to NGS [15]. The authors were able to identify 28/28 (100%) pathogenic mutations in MLH1, MSH2, MSH6, PMS2, EPCAM, APC, and MUTYH [15].
We were interested in the targeted capture of genomic regions including the promoters and intronic regions of genes related to a pathway or a network of genes with certain characteristics to understand cancer biology. There are several advantages to this approach: 1) the genes can be selected based on biology or a hypothesis; 2) mutations in promoter and intronic regions, which have recently been suggested to have important regulatory roles, can be investigated; and 3) the technique is less expensive than whole genome or whole exome sequencing. Therefore, we designed custom high-density oligonucleotide microarrays (Nim-bleGen Inc.) to capture a total of approximately 1.7 Mb target regions comprising the genomic regions of 28 genes related to colorectal cancer including the exonic, intronic, 10 kb upstream and 5 kb downstream sequences followed by analysis using the Illumina Genome Analyzer. The selected genes include those belonging to the WNT signaling pathway, as well as important transcription factors or colon-specific genes that are over expressed in CRC.
Results
Targeted Re-sequencing of Genomic Regions Including Promoters of the Key WNT Pathway and Other CRC-related Genes
As the WNT signaling pathway is a critical pathway implicated in CRC [16], we selected two WNT pathway genes (http://www. genome.jp/kegg/pathway/hsa/hsa04310.html) to begin our in-vestigation. In addition, we selected 22 important transcription factors (transcription regulator activity GO:0030528) and four colon-specific or enriched genes [17] that are over expressed in cancer based on data generated in the laboratory as well as data available in the public domain (e.g. GSE8671, GSE15960, GSE24551, GSE41258 from the GEO database). The final list of the selected 28 genes is shown in Table 1 with annotations.
To reduce expenses, we first sequenced a pool of 30 CRC tissues (the CRC pool) and a pool of 30 adjacent normal tissues (the CRN pool) and then validated the SNPs identified using PCR or Sequenom’s technologies. We created a custom oligo array using NimbleGen technology to capture the target sequences. The total length of the target genomic regions designed was 1.7 Mbp. The captured DNAs were subjected to sequencing using the Illumina Genome Analyzer. After removing PCR duplicates from the raw sequences, the average coverage ranged from 32x to 45x, and the coverage by sequence length for the targeted regions of each gene ranged from 83.5 to 100%. The coverage for the different regions of the target genes differed, which might be due to the property of NimbleGen sequence capture technology, sequence complexity or other uncharacterized factors. The raw
sequencing data was deposited in the NCBI sequence read archive (SRA) under accession number SRX277359.
We tabulated the coverages of all 28 genes by comparing to regions covered by the designed probes or to the total targeted regions including promoters and 39 distal regions (Table 1) to calculate the capture efficiency of the NimbleGen approach. Measured by the targeted regions, the median coverages was 98.1 and 99.5% for the CRC and the CRN tissues respectively, and ranging from 83.5 to 100% (Table 1). In the NinbleGen probe design, the probes were not designed as overlapping oligos to cover the complete regions, but rather as probes that spaced among the target regions with specific characteristics optimized to DNA capture. The coverage calculated by the regions covered by the designed probes all exceed 100% (Table 1), suggesting that the capture probes captured adjacent sequences in addition to their complementary sequences, which resulted in that the sequenced regions actually extended beyond the regions that were covered by the probes.
The GC content was computed for each position of the reference sequences centered in an 81-bp window in order to investigate whether the coverages were affected by the GC content of the captured regions. The coverage for each position was counted after removing duplicate sequences. Sufficient coverage of .40X was achieved for regions with a GC content between approximately 15–75% (Figure 1A, 1B). We next studied whether the difference in the coverage affected the detection frequency of sequence variations. We computed the Spearman correlation for the SNP count and the corresponding coverage using R (www.r-project.org). Here, the coverage was counted after removing sequence duplicates. The correlation coefficients were20.51 and 20.38 for CRC and CRN samples, respectively, suggesting little correlation between SNP detection and read coverage. We further computed whether the SNP percentage accounted for the total SNPs with different coverages (Figure 1C). We found that the detection frequency remained flat when the sequence coverage increased from 40X to 60X for the CRC tissues. However, we found that the detection frequency in the normal tissue pools increased when the sequence coverage reached approximately 55X to 65X (Figure 1C). These differences might suggest a higher heterogeneity among the normal tissue pool than the CRC tissue pool, which may be explained by a similar tumor biology or mutation profiles among the CRC tissues. The detecting frequency dropped when the sequence coverage was greater than 65X, likely due to false high coverage generated for the repeated sequences for these regions.
After data analysis, we identified a total of 2342 sequence variations in the CRC and corresponding adjacent normal tissues. Among them, 738 were novel sequence variations based on comparisons with the current SNP database (dbSNP135; Table S1). 1226 variations were common to the CRC and normal colon tissues, while 374 and 742 variations were unique to each tissue type respectively (Figure 1D).
For the two pooled samples, the frequency of mutation rate ranged from 0.354 to 4.942 per kilobase for different genes. Most variations occurred in the intronic regions, with only 5% of the variations occurring in the exonic regions.
We randomly selected eight SNPs for validation covering variations found in intronic and in exonic regions. For validation, we used allele-specific PCR (AS-PCR) for genotyping single nucleotide polymorphisms [18,19]. Each SNP was analyzed individually with a gene specific primer pair in a separate cohort of 22 CRC samples and 24 CRC adjacent normal tissues from the corresponding patients and four healthy donors (Table S5). We found that the data for four of the SNPs were consistent between rs3106189 and rs1052918 Predict CRC Survival
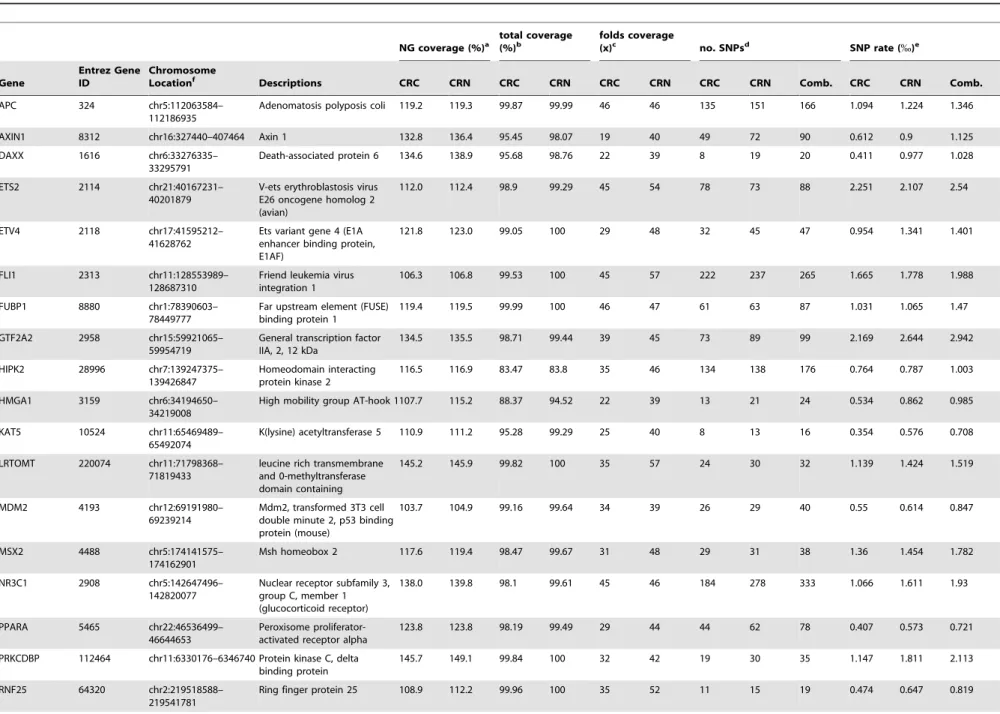
Table 1.The sequence coverage of 28 selected genes and number of SNPs in CRC and CRN identified by NGS.
NG coverage (%)a
total coverage (%)b
folds coverage
(x)c no. SNPsd SNP rate (%)e
Gene
Entrez Gene ID
Chromosome
Locationf Descriptions CRC CRN CRC CRN CRC CRN CRC CRN Comb. CRC CRN Comb.
APC 324 chr5:112063584–
112186935
Adenomatosis polyposis coli 119.2 119.3 99.87 99.99 46 46 135 151 166 1.094 1.224 1.346
AXIN1 8312 chr16:327440–407464 Axin 1 132.8 136.4 95.45 98.07 19 40 49 72 90 0.612 0.9 1.125
DAXX 1616 chr6:33276335–
33295791
Death-associated protein 6 134.6 138.9 95.68 98.76 22 39 8 19 20 0.411 0.977 1.028
ETS2 2114 chr21:40167231– 40201879
V-ets erythroblastosis virus E26 oncogene homolog 2 (avian)
112.0 112.4 98.9 99.29 45 54 78 73 88 2.251 2.107 2.54
ETV4 2118 chr17:41595212– 41628762
Ets variant gene 4 (E1A enhancer binding protein, E1AF)
121.8 123.0 99.05 100 29 48 32 45 47 0.954 1.341 1.401
FLI1 2313 chr11:128553989– 128687310
Friend leukemia virus integration 1
106.3 106.8 99.53 100 45 57 222 237 265 1.665 1.778 1.988
FUBP1 8880 chr1:78390603– 78449777
Far upstream element (FUSE) binding protein 1
119.4 119.5 99.99 100 46 47 61 63 87 1.031 1.065 1.47
GTF2A2 2958 chr15:59921065– 59954719
General transcription factor IIA, 2, 12 kDa
134.5 135.5 98.71 99.44 39 45 73 89 99 2.169 2.644 2.942
HIPK2 28996 chr7:139247375– 139426847
Homeodomain interacting protein kinase 2
116.5 116.9 83.47 83.8 35 46 134 138 176 0.764 0.787 1.003
HMGA1 3159 chr6:34194650– 34219008
High mobility group AT-hook 1107.7 115.2 88.37 94.52 22 39 13 21 24 0.534 0.862 0.985
KAT5 10524 chr11:65469489– 65492074
K(lysine) acetyltransferase 5 110.9 111.2 95.28 99.29 25 40 8 13 16 0.354 0.576 0.708
LRTOMT 220074 chr11:71798368– 71819433
leucine rich transmembrane and 0-methyltransferase domain containing
145.2 145.9 99.82 100 35 57 24 30 32 1.139 1.424 1.519
MDM2 4193 chr12:69191980– 69239214
Mdm2, transformed 3T3 cell double minute 2, p53 binding protein (mouse)
103.7 104.9 99.16 99.64 34 39 26 29 40 0.55 0.614 0.847
MSX2 4488 chr5:174141575– 174162901
Msh homeobox 2 117.6 119.4 98.47 99.67 31 48 29 31 38 1.36 1.454 1.782
NR3C1 2908 chr5:142647496– 142820077
Nuclear receptor subfamily 3, group C, member 1 (glucocorticoid receptor)
138.0 139.8 98.1 99.61 45 46 184 278 333 1.066 1.611 1.93
PPARA 5465 chr22:46536499– 46644653
Peroxisome proliferator-activated receptor alpha
123.8 123.8 98.19 99.49 29 44 44 62 78 0.407 0.573 0.721
PRKCDBP 112464 chr11:6330176–6346740 Protein kinase C, delta binding protein
145.7 149.1 99.84 100 32 42 19 30 35 1.147 1.811 2.113
RNF25 64320 chr2:219518588– 219541781
Ring finger protein 25 108.9 112.2 99.96 100 35 52 11 15 19 0.474 0.647 0.819
rs3106189
and
rs1052918
Predict
CRC
Survival
PLOS
ONE
|
www.ploson
e.org
3
August
2013
|
Volume
8
|
Issue
8
|
Table 1.Cont.
NG coverage (%)a total coverage(%)b folds coverage(x)c no. SNPsd SNP rate (%)e
Gene
Entrez Gene ID
Chromosome
Locationf Descriptions CRC CRN CRC CRN CRC CRN CRC CRN Comb. CRC CRN Comb.
SMARCA4 6597 chr19:11061606– 11177953
SWI/SNF related, matrix associated, actin dependent regulator of chromatin, subfamily a, member 4
131.7 132.0 97.11 99.35 20 42 55 78 90 0.473 0.67 0.774
SOX4 6659 chr6:21583972–
21603847
SRY (sex determining region Y)-box 4
130.3 136.6 94.54 97.33 35 43 17 15 24 0.855 0.755 1.207
STAT5A 6776 chr17:40429565– 40468958
Signal transducer and activator of transcription 5A
122.8 124.8 94.91 99.52 20 41 25 35 37 0.635 0.888 0.939
TCF3 6929 chr19:1599293–1655277 Transcription factor 3 (E2A immunoglobulin enhancer binding factors E12/E47)
121.4 124.9 95.71 98.43 12 35 108 138 153 1.929 2.465 2.733
TFDP1 7027 chr13:114229056– 114300499
Transcription factor Dp-1 120.6 121.6 98.27 99.1 32 52 27 45 50 0.378 0.63 0.7
TNKS2 80351 chr10:93548069– 93630032
Tankyrase, TRF1-interacting ankyrin-related ADP-ribose polymerase 2
142.9 148.9 97.93 99.48 42 45 34 48 57 0.415 0.586 0.695
TRIM28 10155 chr19:59045836– 59067082
Tripartite motif-containing 28 129.5 149.6 85.28 98.48 17 39 65 81 105 3.059 3.812 4.942
VAV1 7409 chr19:6762722–6862371 Vav 1 guanine nucleotide exchange factor
171.7 175.0 96.43 98.32 21 37 73 87 116 0.733 0.873 1.164
YBX1 4904 chr1:43138072–
43173073
Y box binding protein 1 116.3 117.4 98.04 98.97 45 52 25 25 31 0.714 0.714 0.886
ZNF3 7551 chr7:99651851–
99684363
Zinc finger protein 3 166.8 169.3 98.14 99.61 28 44 21 20 26 0.646 0.615 0.8
a.NG coverage (%): the percentage of regions covered by final reads out of the whole NimbleGen captured regions for each gene, including 10-kb upstream and 5-kb downstream. b.total coverage (%): the percentage of regions covered by final reads out of the whole designed regions for each gene.
c.folds coverage (x): the average read depth.
d.no. SNPs: the total SNPs identified for the gene.
e.SNP rate (%): the average count of SNP in a 1k-bp window.
f.The chromosome names and locations of the genomic regions that were captured for each gene.
doi:10.1371/journal.pone.0070307.t001
rs3106189
and
rs1052918
Predict
CRC
Survival
PLOS
ONE
|
www.ploson
e.org
4
August
2013
|
Volume
8
|
Issue
8
|
Figure 1. GC content, coverage and SNP count.(A) The GC content and coverage in CRC (colorectal cancer) tissue. (B) The GC content and coverage in CRN (colorectal normal tissue) tissue. (C) The relationship between sequence coverage and SNP detection. Red line shows the sequence coverage and percentage of SNPs detected at that coverage in CRC pool, and green line in CRN pool (D) Venn diagram of SNPs for CRC and CRN samples. (E) An overview of SNPs identified in cancer and adjacent normal tissue.
doi:10.1371/journal.pone.0070307.g001
rs3106189 and rs1052918 Predict CRC Survival
Table 2.PolyPhen, SIFT and PROVEAN prediction results for non-synonymous variations identified.
SNP position SNP ID Protein Acc. no. Variation Samplea PolyPhen SIFT (cutoff = 0.05) PROVEAN(cutoff =
22.5)
Validated by
Sequenomb Previously identifiedas CRC mutation?
chr1:78392446_GA rs1166698 NEXN NP_653174 G245R CRC; CRN Probably
damaging
Damaging Neutral + No
chr11:6340706_AG rs1051992 PRKCDBP NP_659477 L158P CRC; CRN Benign Tolerated Neutral + No
chr5:174156371_GA Novel MSX2 NP_002440 A197T –; CRN Probably
damaging
Damaging Deleterious 2 No
chr5:142779488_AG Novel NR3C1 NP_000167 F306S CRC; – Probably
damaging
Tolerated Neutral 2 No
chr5:112176756_TA rs459552 APC NP_000029 V1822D CRC; CRN Benign Tolerated Neutral 2 Yes. Confers a protective
effect with an odds ratio of 0.76 (CI = 0.60–0.97) among colon patients.
chr6:34214322_CG rs1150781 C6orf1 NP_848603 G150A CRC; CRN Benign Tolerated Neutral 2 No
chr11:65481267_TG Novel KAT5 NP_874369 V213G CRC; – Benign Tolerated Neutral 2 No
chr5:174156168_TC rs4242182 MSX2 NP_002440 M129T CRC; CRN Benign Tolerated Neutral 2 No
chr19:1615796_GA rs2074888 TCF3 NP_003191 A492V –; CRN Benign Tolerated Neutral 2 No
chr13:114288328_CT Novel TFDP1 NP_009042 Q200* CRC; – N/A N/A N/A 2 No
chr6:33283766_TC rs3130100 ZBTB22 NP_005444 T310A CRC; CRN Benign Tolerated Neutral 2 No
aTissue samples with SNP detected by NGS. CRC is the colorectal cancer tissue pool, and CRN is the colorectal cancer adjacent normal tissue pool. b‘‘
+’’indicates ‘‘validated’’ and ‘‘2’’ indicated ‘‘not tested’’ by Sequenom. doi:10.1371/journal.pone.0070307.t002
rs3106189
and
rs1052918
Predict
CRC
Survival
PLOS
ONE
|
www.ploson
e.org
6
August
2013
|
Volume
8
|
Issue
8
|
the sequencing data and the PCR validation. For example, the SNPs for the MSX2 and KAT5 were detected 100% by the sequencing-based approach and by PCR validation. For rs80186078 in the TFDP1 gene, we only detected the SNP in the CRC tissues by sequencing and validating it in both CRC and CRN tissues but not in healthy donors by the AS-PCR validation. However, we also observed an inconsistency between the sequencing of the pooled samples and the PCR validation of individual samples. For example, rs11186694 and rs17107140 were detected in both CRC and CRN samples by sequencing but could not be detected by AS-PCR in individual samples. This result suggests a false positive identification of SNPs or a failure of the AS-PCR. We did not attempt to design additional PCR primers for AS-PCR, as we determined that AS-PCR was cumbersome and lacked sensitivity [20]. Furthermore, some of the SNPs (e.g., chr11:65481267_TG) were detected in one pooled sample but were found in both CRC and normal tissues when analyzed by PCR validation of individual samples. This result suggests a false negative identification of SNPs in one of the pooled samples. However, it might not be surprising because if the allele frequency of the SNPs is low in one of the pooled samples, it might be missed by sequencing of pooled samples.
Due to the low efficiency and sensitivity of SNP validation by PCR, we decided to use the Sequenom MassARRAY iPLEX Platform for the validation studies. We chose 66 SNPs for validation in a separate cohort of 30 CRC tissues because the DNA used for sequencing was depleted. In the end, we were able to confirm the existence of 56 SNPS in the 30 CRC tissues (Table S6), suggesting a validation rate of at least 85% (56/66),
considering that some of the detection failures might be due to differences in the sample population.
Functional Consequence of the Identified Sequence Variations
We found 15 SNPs that would change protein sequences among the exonic variations in the CRC and normal colon tissues, including 14 missense mutations and 1 nonsense mutation (Figure 1E and Table 2). These missense mutations may affect the function of the mutated protein products. The novel SNP chr13:114288328_CT identified only in CRC tissues would result in a stop codon, which would cause early termination of the translation of TFDP1 (NP_009042, Q200*) and loss of the Transc_factor_DP_C domain in the truncated TFDP1 protein. The effect of this truncated TFDP1 on CRC carcinogenesis remains to be investigated.
Four of the mutations failed to be validated by Sequenom’s MassARRAY iPLEX (Table S6) and were therefore excluded from further analysis. Four of the remaining 11 missense sequence variations identified in the CRC and normal colon tissues were novel mutations. The online tools PolyPhen, SIFT and PRO-VEAN were used to predict the functional consequences (Table 2). All three programs predicted that the novel mutations for MSX2 (A197T) would affect the functional domains of the protein and might have functional consequences. The NEXN (G245R) variation was predicted to have functional consequences by the SIFT and PolyPhen programs (Table 2). PolyPhen predicted another mutation in the NR3C1 gene to be likely damaging (Table 2). We also assessed whether these 11 mutations have been
Table 3.List of synonymous SNPs with ESE/ESS motifs changed.
Gene SNP ID SNP position Samplea
Validated by Sequenomb
DAXX rs1059231 chr6:33288271_AG CRC;CRN +
HIPK2 rs7456421 chr7:139415775_CG CRC;CRN +
APC rs2229992 chr5:112162854_TC CRC;CRN 2
APC rs351771 chr5:112164561_GA CRC;CRN 2
APC rs41115 chr5:112175770_GA CRC;CRN 2
APC rs42427 chr5:112176325_GA CRC;CRN 2
APC rs866006 chr5:112176559_TG CRC;CRN 2
AXIN1 rs1805105 chr16:396264_AG CRC;CRN 2
ETS2 rs457705 chr21:40191431_TG CRC;CRN 2
ETS2 rs461155 chr21:40191638_AG CRC;CRN 2
FUBP1 Novel chr1:78422291_TG CRC;– 2
NR3C1 Novel chr5:142779439_AG CRC;CRN 2
PDIA2 rs432925 chr16:334580_GC –;CRN 2
PPARA rs150197646 chr22:46611153_TC CRC;– 2
PRKCDBP rs12570 chr11:6340525_AT CRC;CRN 2
STAT5A rs1135669 chr17:40459737_CT CRC;CRN 2
TFDP1 Novel chr13:114294549_CT CRC;CRN 2
TFDP1 rs4150756 chr13:114277541_CT CRC;– 2
TNKS2 rs3758499 chr10:93608142_GA CRC;CRN 2
TRIM28 rs2305120 chr19:59059729_GA –;CRN 2
ZSCAN21 rs11558476 chr7:99654689_GA CRC;CRN 2
aTissue samples with SNP detected by NGS. CRC is the colorectal cancer tissue, and CRN is the colorectal cancer adjacent normal tissue. b‘‘
+’’indicates ‘‘validated’’ and ‘‘2’’ indicated ‘‘not tested’’ by Sequenom. doi:10.1371/journal.pone.0070307.t003
rs3106189 and rs1052918 Predict CRC Survival
previously reported for CRC. Ten of them have not been previously reported to be associated with CRC and therefore were identified for the first time (Table 2). One of them, rs459552 in the APC gene has been reported to confer a protective effect for CRC with an odds ratio of 0.76 (CI = 0.60–0.97) among CRC patients [21].
There were 29 synonymous SNPs detected in the coding region in the CRC and CRN samples and 73 SNPs in the 59or 39UTR regions. FastSNP was used to predict the regulatory roles of these SNPs including exonic splicing enhancer (ESE), exonic splicing silencer (ESS), motif changes for synonymous SNPs (Table 3), and TF binding sites changes for UTR SNPs (Table 4). The ESE finder can identify ESEs recognized by individual SR proteins that are highly conserved splicing factors, and RESCUE-ESE can search sequences with ESE activity. In contrast, FAS-ESS can identify ESS. The prediction results from the three computational tools were combined to confirm whether the single nucleotide
variation would change the splicing motif. The transcription factor binding sites associated with the target SNPs were identified by TFSEARCH using FastSNP. A total of 21 synonymous SNPs were predicted to change the exonic splicing motifs, and 31 UTR SNPs were predicted to occur at the transcription factor binding sites and therefore might affect gene transcription. The novel SNP chr2:219524460_CA (59UTR of BCSIL) was also found in conserved transcriptional binding sites (Table S2).
To understand the functional consequences of the intronic SNPs, the online tool SNPnexus was used to annotate the SNPs. The distances to the splicing sites were computed by SNPnexus. There were 20 intronic SNPs located near the splicing sites with a distance less than 30 bp, and only one was novel. The mutations at these regions may affect splicing and transcription. C6orf1, ETV4, KAT5 and VAV1 each had two variations located near splicing sites, and TNKS2 had 3 variations located near splicing sites (Table 5). The SNP rs2271959 (chr17:41622740_GT, ETV4) was
Table 4.List of UTR SNPs with transcription factor binding sites changed using TFSEARCH.
Region Gene SNP ID SNP position Samplea
Validated by Sequenomb
39UTR ETS2 rs1051425 chr21:40195485_TC CRC;CRN +
59UTR TAPBP rs138551513 chr6:33282002_CT –;CRN +
39UTR APC rs41116 chr5:112180921_TC CRC;CRN 2
39UTR APC rs448475 chr5:112181379_CG CRC;CRN 2
39UTR APC rs397768 chr5:112181576_GA CRC;CRN 2
59UTR BCS1L Novel chr2:219524460_CA CRC;– 2
39UTR C19orf26 rs36074840 chr19:1230677_GA CRC;CRN 2
39UTR ETS2 rs711 chr21:40195059_AG CRC;CRN 2
39UTR ETS2 rs530 chr21:40195277_TA CRC;CRN 2
39UTR FLI1 rs682695 chr11:128682460_CA CRC;CRN 2
39UTR GTF2A2 rs8027421 chr15:59930865_AT –;CRN 2
39UTR GTF2A2 rs8027679 chr15:59930772_GC CRC;CRN 2
39UTR HIPK2 rs1638195 chr7:139252780_TC CRC;CRN 2
39UTR HMGA1 rs2780219 chr6:34212743_AG –;CRN 2
39UTR HMGA1 rs1150782 chr6:34213868_AG –;CRN 2
39UTR MDM2 Novel chr12:69237323_CT –;CRN 2
39UTR MDM2 Novel chr12:69235967_GA CRC;– 2
39UTR MDM2 rs1132585 chr12:69237388_AG CRC;CRN 2
39UTR MSX2 rs14459 chr5:174157711_AG CRC;CRN +
39UTR MSX2 rs2890849 chr5:174157762_GC CRC;CRN 2
39UTR NEXN rs3767028 chr1:78408536_CG –;CRN 2
39UTR RNASEH2C rs535111 chr11:65485337_AG –;CRN 2
39UTR RNASEH2C rs521678 chr11:65485727_TG CRC;CRN 2
39UTR STAT3 rs3744483 chr17:40466438_TC CRC;CRN 2
59UTR TAPBP rs146763267 chr6:33281842_GT –;CRN 2
39UTR TCF3 rs41275834 chr19:1609616_AT CRC;CRN 2
39UTR TFDP1 Novel chr13:114294912_AT –;CRN 2
39UTR TFDP1 Novel chr13:114295295_GA –;CRN 2
39UTR TFDP1 Novel chr13:114294701_GT CRC;– 2
39UTR TFDP1 Novel chr13:114295186_GA CRC;– 2
59UTR ZNF142 rs4674324 chr2:219523433_TG CRC;CRN 2
aTissue samples with SNP detected by NGS. CRC is the colorectal cancer tissue, and CRN is the colorectal cancer adjacent normal tissue. b‘‘
+’’ indicates ‘‘validated’’ and ‘‘2’’ indicated ‘‘not tested’’ by Sequenom. doi:10.1371/journal.pone.0070307.t004
rs3106189 and rs1052918 Predict CRC Survival
5 bp away from the splicing site and was detected only in CRN tissues with high confidence. There were 43 intronic, upstream or intergenic SNPs in conserved transcription factor binding sites (Table S2) and 32 in CpG islands (Table S3).
The public ChIP-seq datasets, especially the ENCODE project, provide vast TF binding or DNAase hypersensitivity sites in various cell lines. Here, we used RegulomeDB to annotate the SNPs with regulatory regions. Each SNP was given a score that represented different regulatory regions by RegulomeDB (Table S1, Table 6). The aforementioned, likely damaging, missense SNP rs1166698 (NEXN, validate by Sequenom) received a score of 1b,
which was the highest in this study, indicating that the SNP was involved in many important regulatory regions. Another 1b SNP was rs1860661, located in the intron of TCF3 and not tested by Sequenom. Among the 2342 SNPs, 1062 were situated in TF binding regions defined by ChIP-seq technology.
Analysis of Associations between SNPs and Overall Survival Time
We chose nine SNPs (Table 7) that were validated by the Sequenom MassARRAY iPLEX technology and with allele
Table 5.Intronic SNPs near splice sites (,30 nt).
SNP position Gene Acc. no. Splice-dist. (bp) SNP ID Samplea
Validated by Sequenomb
chr17:41622740_GT ETV4 NM_001986 5 rs2271959 –;CRN +
chr17:41598940_TC DHX8 NM_004941 7 rs2271957 CRC;CRN +
chr19:1624007_AG TCF3 NM_003200 8 rs55677929 CRC;CRN +
chr10:93600480_GA TNKS2 NM_025235 17 rs17107140 CRC;CRN +
chr17:41623212_GA ETV4 NM_001986 17 rs79158595 –;CRN +
chr10:93572984_CT TNKS2 NM_025235 20 rs11186694 CRC;CRN +
chr21:40193488_GA ETS2 NM_005239 22 rs117862776 –;CRN +
chr19:59059798_CT TRIM28 NM_005762 23 Novel –;CRN +
chr11:65481166_TC KAT5 NM_182710 28 rs1151500 CRC;CRN +
chr11:71804513_GA LRTOMT NM_145309 29 rs2250866 CRC;CRN +
chr5:112170870_TC APC NM_000038 8 rs62626346 –;CRN 2
chr19:6822219_TC VAV1 NM_005428 13 rs347033 –;CRN 2
chr5:142680344_CA NR3C1 NM_000176 16 rs6188 CRC;– 2
chr6:34215228_GA C6orf1 NM_178508 16 rs1150780 –;CRN 2
chr10:93617306_AG TNKS2 NM_025235 19 rs1340420 CRC;CRN 2
chr16:359953_AG AXIN1 NM_003502 20 rs2301522 –;CRN 2
chr2:219527005_CT BCS1L NM_004328 22 rs2303561 –;CRN 2
chr6:34215221_GA C6orf1 NM_178508 23 rs928482 –;CRN 2
chr19:6833989_GT VAV1 NM_005428 25 rs308199 CRC;CRN 2
chr11:65480791_AG KAT5 NM_006388 28 rs551115 CRC;CRN 2
aTissue samples with SNP detected by NGS. CRC is the colorectal cancer tissue, and CRN is the colorectal cancer adjacent normal tissue. b‘‘
+’’ indicates ‘‘validated’’ and ‘‘2’’ indicated ‘‘not tested’’ by Sequenom. doi:10.1371/journal.pone.0070307.t005
Table 6.Overview of RegulomeDB annotation.
Score SNP Counts Supporting data sets
1b 2 eQTL+TF binding+any motif+DNase Footprint+DNase peak
1d 4 eQTL+TF binding+any motif+DNase peak
1f 26 eQTL+TF binding/DNase peak
2a 10 TF binding+matched TF motif+matched DNase Footprint+DNase peak
2b 52 TF binding+any motif+DNase Footprint+DNase peak
2c 2 TF binding+matched TF motif+DNase peak
3a 47 TF binding+any motif+DNase peak
4 243 TF binding+DNase peak
5 676 TF binding or DNase peak
6 510 Other
7 770 No data
doi:10.1371/journal.pone.0070307.t006
rs3106189 and rs1052918 Predict CRC Survival
heterozygosities of greater than 0.4 for analysis of the association between SNPs and CRC patient survival. We collected samples from a set of 117 patients with detailed clinical information for this analysis using the Sequenom MassARRAY iPLEX technology. The distribution of the 117 patients’ demographic and clinico-pathologic characteristics are summarized in Table 8, and the genotype data are summarized in Table S7.
We first analyzed the Hardy-Weinberg equilibrium of each SNP and found that only SNP rs1053023 deviated from the Hardy-Weinberg equilibrium (Table 9, p,0.05); the P values for other SNPs ranged from 0.3265 to 1. The effect of the nine SNPs on overall survival time was assessed in 117 CRC patients using the Kaplan-Meier method and plotted using the Stata 12 (www.stata. com) statistical analysis program. We found that two SNPs (rs3106189 and rs1052918) were associated with overall survival of CRC patients (Figure 2) using the dominant model with hazard ratios of 0.25 (P = 0.009) and 0.28 (P = 0.024), respectively. The SNP rs3106189 was also significantly associated with CRC patient survival with the additive model (hazard ratio = 0.33, P = 0.021; Table 7). The SNP rs3106189 localized to the 59UTR of TAPBP, and the SNP rs1052918 localized to the 39UTR of the TCF3. For the SNP rs3106189, the numbers of patients with heterozygous and homozygous variants were 42 and 7 respectively. For the SNP rs1052918, the numbers of patients with heterozygous and homozygous variants were 47 and 22 respectively. Patients bearing one of the two variants seem to have higher probabilities to survive longer.
Table 7. The association of single SNP with CRC patient survival. death/total dominant additive recessive Gene ref allele SNP ID Region (a.a. substitution) WW WV VV HR (95%CI) p HR (95%CI) p HR (95%CI) p TAPBP C C/T rs3106189 5 9 UTR 20/65 12/42 1 /7 0.2489404(0.08713 63–0.7112003) 0.009 0.3289281(0.1279939–0.84 53038) 0.021 0.7882852(0.0967128– 6.425145) 0.824 TCF3 T C /T rs1052918 3 9 UTR 12/37 12/47 5 /22 0.2802584(0.09269 05–0.8473875) 0.024 0.5921091(0.2649582–1.32 3202) 0.201 1.076675(0.3393056–3 .416473) 0.9 ETV4 A A/G rs79868029 intronic 14/46 13/47 6 /13 1.746839(0.648628 7–4.704459) 0.27 1.453808(0.7773533–2.718 915) 0.241 1.720894(0.5184039–5 .7 1268) 0.375 ETV4 G A/G rs79158595 intronic 15/46 11/45 6 /14 1.238529(0.470144 3–3.26273) 0 .665 1 .249898(0.6641922–2.352 096) 0.489 1.676421(0.4922574–5 .7 0918) 0.409 DHX8 T C /T rs71361531 intronic 14/45 13/54 7 /14 1.722156(0.639915 7–4.634706) 0.282 1 .516384(0.8136795–2.825 954) 0.19 2 .006176(0.6380821–6 .3 07564) 0.234 NEXN G A /G rs1166698 coding(G|R) 14/37 15/54 3 /18 0.7786868(0.26255 01–2.309476) 0.652 0 .8774619(0.3942656–1.95 2844) 0.749 1.002838(0.227770 6–4 .415333) 0.997 HIPK2 C G /C rs7456421 coding(V|V) 1/11 11/51 23/53 1.491145(0.266263 6–8.350797) 0.649 1 .507939(0.7196225–3.159 823) 0.276 1.836416(0.6948774 –4 .853267) 0.22 STAT5A T C /T rs1053023 3 9 downstream 14/40 16/62 2 /8 0.4510602(0.17038 64–1.194082) 0.109 0 .5324628(0.2144653–1.32 197) 0.174 0.8564487(0.102282–7 .171397) 0.886 ETS2 T C /T rs1051425 3 9 UTR 0 /3 14/42 20/67 omit 2 .06858(0.7675036–5.5752 4 8) 0.151 omit ? Note: The significant P values ( # 0.05) are in bold. WW, homozygous wild-type genotype; WV heterozygous genotype; VV, homozygous variant genotype. Abbreviations: C I, confidence interval; HR, hazard ratio; omit, no results due to missing information o n the death status. doi:10.1371/journal.pone. 0070307.t007
Table 8.The clinicopathological characteristics of 117 Chinese CRC patients.
Variables
Number of
patients % (n = 117)
Age .= 60 71 60.68%
,60 46 39.32%
Gender Male 69 58.97%
Female 48 41.03%
Tumor position Colon 66 56.41%
Rectum 51 43.59%
Tumor differentiation Poor 4 3.42%
Moderate 37 31.62%
Well 53 45.30%
Not available 23 19.66%
Infiltration depth Outside of serosa 31 26.50%
Serosa 47 40.17%
Propria 21 17.95%
Mucosa 2 1.71%
Not available 16 13.68% Positive lymph node Null 60 51.28%
.0 37 31.62%
Not available 20 17.09%
Tumor stage I 18 15.38%
II 45 38.46%
III 41 35.04%
IV 13 11.11%
doi:10.1371/journal.pone.0070307.t008
rs3106189 and rs1052918 Predict CRC Survival
Discussion
In this manuscript, we describe our analysis pipeline that consists of (1) initially sequencing pooled DNA samples followed by validation and further analysis in larger cohorts of samples for cost reduction and (2) a hypothesis-driven targeted capturing and analysis of SNPs and their associations with the cancer pheno-types. Pooling genomic DNAs for sequencing has the advantage of reducing sample preparation and sequencing costs. For example, capturing 30 individual samples would require using 30 capture arrays to perform hybridization and sample recoveries, which are tedious and may potentially introduce sample-to-sample variations during the sample preparation stage. Sequencing 30 individual samples would also be substantially more costly than sequencing one pool. Although it is possible to use barcoding and multiplexing reactions and sequencing to achieve similar sequence coverage at a similar cost to pooling samples, the sample preparation complexity would be substantially higher. In a recent GWAS analysis of type 1 diabetes (T1D) published in Science, Nejentsevet al.re-sequenced exons and splice sites of 10 candidate genes in DNA pools from 480 patients and 480 controls to identify causative type 1 diabetes
(T1D) variants and then tested their disease association in over 30,000 participants [22]. The authors were able to identify four rare variants that independently lowered T1D risk [odds ratios, 0.51 to 0.74; P = 1.3610(23) to 2.1610(216)] in interferon induced with helicase C domain 1 (IFIH1) [22].
Another distinct feature of our analysis pipeline is that we sequenced the genomic regions that included exonic and intronic regions, i.e., the 10-kb promoter and the 5-kb downstream genomic regions of the selected genes. This method was in contrast with most studies that only analyzed the exonic sequences (exome capture) [23,24]. It is important to include the promoter regions in the analysis, as SNPs in the promoter regions have been associated with tumorigenesis. For example, Bondet al.showed that a single nucleotide polymorphism in the MDM2 promoter could attenuate the p53 tumor suppressor pathway and accelerate tumor formation in humans [25]. Passarelliet al. showed that SNPs in the estrogen receptor beta promoter are associated with survival of postmenopausal women with CRC [26]. Polymorphisms in the UTR regions of genes have also been found to be related to cancer. For example, Zhanget al.found that a polymorphism in
Figure 2. Colorectal cancer overall survival in relationship to SNPs.(A) Kaplan-Meier plot for rs3106189 localized to the 59UTR of TAPBP. (B)
Kaplan-Meier plot for rs1052918 localized to the 39UTR of the TCF3. Y-axis, CRC survival probability; X-axis, months from surgery. Blue lines are homozygous wildtype (wild), green are homozygous variant (var), red are heterozygous variant (het).
doi:10.1371/journal.pone.0070307.g002
rs3106189 and rs1052918 Predict CRC Survival
the 39UTR region of insulin-like growth factor I (IGF1) gene predicts survival of non-small cell lung cancer in a Chinese population [27]. Hao et al. found that a SNP (rs3213245,
277T.C) in the XRCC1 gene 59UTR contributes to diminished promoter activity and increased risk of non-small-cell lung cancer [28]. We have identified and validated using Sequenom’s platform several SNPs that localized to the 59 or 39 UTR of the genes (Table S6). For example, rs3106189 of TAPBP and rs8041394 of GTF2A2 localized to 59 UTRs, and rs1051425 of ETS2 and rs1052918 of TCF3 localized to 39UTRs (Table S6). The functional significance of these SNPs remains to be determined.
We have chosen genes related to the WNT pathway, as the Cancer Genome Atlas Network found mutations in 16 different genes in the WNT pathways including APC, CTNNB1, FAM123B and TCF7L2 [14]. We extended the analysis of the WNT pathway genes to regions beyond the exome analyzed the Cancer Genome Atlas Network, and our approach has the potential to identify those mutations that modulate gene expres-sion or splicing in additional to the identification of those structurally damaging mutations in the exons.
We identified a total of 2342 sequence variations in CRC and corresponding adjacent normal tissues. Among them, 738 were novel sequence variations based on comparison with the current SNP database (dbSNP135; Table S1). We chose 66 SNPs for validation in a separate cohort of 30 CRC tissues. We were able to confirm the existence of 56 SNPS in the 30 CRC tissues (Table S6), suggesting a validation rate of at least 85% (56/66), considering that some of detection failures might be due to differences in the sample population. This validation rate is in line with the published validation rate of 85.4% for NGS using the Illumina platform [29]. In addition, it has been reported that various validation platforms including the Sanger sequencing, Pyrosequencing, Sequenom MassArray or SNAPshot SNP Detec-tion lack the sensitivity to confirm sequence variants identified by deep sequencing in tumors, which may be contaminated with DNAs from normal tissues or which may contain multiple clones [30].
We identified 14 missense exonic mutations in the CRC and normal colon tissues (Table 2). The SNP (G245R) at the NEXN gene (Nexilin; F actin binding protein) was predicted to have functional consequences. The roles of the NEXN gene in cancer have not yet been investigated. Two novel SNPs in the nuclear receptor subfamily 3, group C, member 1 (NR3C1) and lysine acetyltransferase 5 (KAT5) genes were found only in CRC tissues but not in normal colon tissues. KAT5 (also named TIP60 or HIV-1-Tat interactive protein) is a histone acetyl transferase
(HAT), and it plays important roles in regulating chromatin remodeling and in DNA repair and apoptosis [31]. In colorectal cancers, KAT5 down regulation is associated with more advanced stages of colorectal cancer [32]. NR3C1 (alias, glucocorticoid receptor) was found to be epigenetically deregulated in colorectal tumorigenesis [33]. Furthermore, hypermethylated NR3C1 is a CRC gene with microsatellite instability [34]. These novel SNPs in the KAT5 and NR3C1 genes warrant confirmation, and additional functional studies are needed to assess the functional consequences of the mutations and their relationship to cancer, such as whether the SNPs would mimic the epigenetic regulations of these genes.
We also identified SNPs that might affect exon splicing because they localize to the ESE (exonic splicing enhancer) and ESS (exonic splicing silencer), which are critical in exon splicing. For example, we identified SNPs in the far upstream element (FUSE) binding protein 1 (FUBP1), peroxisome proliferator-activated receptor alpha (PPARA) and transcription factor Dp-1 (TFDP1) that might affect exon splicing for these genes, and these SNPs were found only in the CRC tissues (Table 3). Zhanget al.showed that a SNP (2195 C.T; dbSNP ID: rs1056932) that alters a potential binding site for an exonic splicing enhancer could affect the risk of non-Hodgkin lymphoma [35]. The functional consequences of the SNPs that localize to the ESE or ES sequences in FUBP1, PPARA and TFDP1 genes warrant further investigation.
We determined that rs3106189, localized at the 59UTR of TAP binding protein (tapasin; TAPBP), and rs1052918, localized at the 39 UTR of the TCF3, were associated with overall survival of CRC patients (Table 7 and Figure 2) with hazard ratios reaching 0.28 (P = 0.024) and 0.33 (P = 0.021) respectively. These data suggest that these two variants confer protective effects for CRC patients. Interestingly, another variant that we identified, the rs459552 in the APC gene, was previously reported to confer a protective effect for CRC with an odds ratio of 0.76 (CI = 0.60– 0.97) among CRC patients [21]. However, we did not analyze this SNP by the Sequenom technology and therefore could not assess whether the finding is also true in our data set.
TAPBP encodes a transmembrane glycoprotein that mediates the interaction between newly assembled major histocompatibility complex (MHC) class I molecules and the transporter associated with antigen processing (TAP) [36]. Downregulation of TAPBP expression has been observed for multiple cancers, including CRC, as an immune escape mechanism of human tumors [37]. Loss of TAPBP expression has been observed in 80% of high-grade intraepithelial neoplasia (HIN) compared with autologous
Table 9.The Hardy-Weinberg equilibrium of the SNPs.
SNP ID Gene Name Pearson chi2 P-value LR chi2 P-value Exact Significance
rs1053023 STAT3 5.895 0.0152 6.185 0.0129 0.0215
rs1052918 TCF3 0.958 0.3276 0.958 0.3278 0.3265
rs1051425 ETS2 1.446 0.2291 1.588 0.2076 0.3963
rs79158595 ETV4 0.319 0.5724 0.317 0.5736 0.6663
rs79868029 ETV4 0.034 0.8527 0.034 0.8529 0.8319
rs71361531 DHX8 0.127 0.7215 0.128 0.7209 0.8395
rs3106189 TAPBP 0.004 0.9505 0.004 0.9506 1
rs1166698 NEXN 0.052 0.8193 0.052 0.8193 1
rs7456421 HIPK2 0.063 0.8013 0.064 0.8008 1
doi:10.1371/journal.pone.0070307.t009
rs3106189 and rs1052918 Predict CRC Survival
colorectal mucosa, in 63% of primary adenocarcinomas in stage III and 79% of the matched lymph node metastases [38]. The ex vivo introduction of TAPBP expression in a murine lung carcinoma model increased surface MHC class I and restored susceptibility of tumor cells to antigen-specific cytotoxic T lymphocytes (CTL) killing [39]. The SNP rs3106189 is located within an H3K27Ac histone mark, which is often found near active regulatory elements, and within H3K9Ac and H3K4me3 marks (UCSC genome browser; Figure S1). Furthermore, rs3106189 is localized among binding sites for several transcription factors including interferon regulatory transcription factor 1 (IRF-1), IRF-2 and IRF-7. The exact functional consequence of the variant at the rs3106189 locus requires further study.
Transcription factor 3 (TCF3; E2A immunoglobulin enhancer binding factors E12/E47) is a member of the TCF/LEF transcription factor family that is central in regulating epidermal and embryonic stem cell identity and is involved in the WNT signaling pathway [40]. In breast cancer, TCF3 is involved in the regulation of breast cancer cell differentiation state and tumori-genicity [40]. Furthermore, overexpression of TCF3 is partially responsible for the butyrate-resistant phenotype of CRC because TCF3 suppresses the hyper-induction of Wnt activity by butyrate [41]. The functional consequence of the variant at rs1052918, which is localized at the 39 UTR of the TCF3, remains to be determined.
Materials and Methods
Ethics Statement
Informed written consent was obtained from each patient, and the ethics committee of the Second Affiliated Hospital, College of Medicine and Zhejiang University approved all aspects of the study.
Clinical Samples and Genomic DNA Isolation
Tissue samples were obtained from four control subjects (healthy individuals) and 30 colorectal cancer patients for the first cohort and 117 CRC patients for the validation study. All subjects were Chinese, and the samples were collected at the Second Affiliated Hospital, Zhejiang University. The DNA samples were isolated using the DNeasy Blood & Tissue Kit (QIAGEN Inc., Valencia CA) according to the manufacturer’s protocol.
NimbleGen Sequence Capture
Genomic DNAs from 30 colon cancer patients were mixed in equal ratios and the DNA pools were captured on a custom NimbleGen 385K array following the manufacturer’s protocol (Roche/NimbleGen, Madison, WI) with modifications at the W. M. Keck Facility at Yale University. A custom tiling 385K sequence capture array targeting genomic sequence for all the 28 genes (including 10-kb upstream and 5-kb downstream regions) was designed and manufactured by Roche NimbleGen. Briefly, the genomic DNA sample was fragmented and hybridized to the custom NimbleGen Sequence Capture array. Unbound fragments were removed, and the target-enriched DNA was eluted and amplified.
The captured DNA was sheared through sonication, and adapters were ligated to the resulting fragments. The adapter-ligated templates were fractionated by agarose gel electrophoresis, and the fragments of the desired size were excised. The extracted DNA was amplifed using ligation-mediated PCR, purifed, and hybridized to the capture array at 42.0uC using the manufacturer’s buffer. The array was washed twice at 47.5uC and three times at room temperature using the manufacturer’s buffers. Bound
genomic DNA was eluted using 125 mM NaOH for 10 min at room temperature, purifed, and amplifed through ligation-mediated PCR. The resulting fragments were purifed and subjected to DNA sequencing on the Illumina platform. Captured and non-captured amplifed samples were subjected to quantitative PCR to measure the relative fold enrichment of the targeted sequence.
Sequence Analyses by the Next Generation Sequencing Technology
Amplified DNA samples were sonicated for 10 minutes (130 w, Cole-Parmer CPX 130, Illinois USA) to generate DNA fragments with an average size of 500 base pairs (bp). The fragments were further purified and concentrated with Qiaquick PCR purification spin columns (QIAGEN Inc., Valencia CA). Genomic fragments were end-repaired with a mixture of T4 DNA polymerase, Klenow DNA polymerase and T4 PNK (Promega, Madison, WI USA), and a 39overhang A was added using Klenow exo-enzyme (Promega, Madison, WI USA). The resultant fragments were ligated with the Illumina classical adapters by DNA T4 ligase (Promega, Madison, WI USA) according to Illumina’s protocol. Adapter-linked DNA fragments were separated by agarose gel electrophoresis, and the band between 150 and 200 bp was excised from the gel. The DNA fragments were extracted from the agarose slices using the Qiaquick Gel Extraction Kit (Qiagen Inc.). Extracted DNA was enriched by an 18-cycle amplification using Illumina’s universal adapters. The DNA fragments were purified and quantified and then sequenced for 40 cycles using Illumina’s protocol.
Short Read Mapping and SNP Calling
Short-sequence reads were extracted from the image files with the Illumina GAPipeline 1.4.0 and mapped to the genome sequence using BWA (version 0.5.3) with default parameters. BWA is an efficient program for aligning relatively short nucleotide sequences against a long reference sequence allowing mismatches, thus detecting SNPs [42].
SNPs were identified by SAMtools (version 0.1.6), which migrated and improved various downstream data processing implemented in Maq/Maqview such as indexing, pileup, viewer and consensus caller. SAMtools generated the consensus sequence with the statistical model implemented in MAQ [43,44]. Potential PCR duplicates were first removed by the command ‘‘samtools rmdup’’. Raw variations were called by the command ‘‘samtools pileup’’ with default parameters and then filtered by the command ‘‘samtools.pl varFilter’’ with default options except for the following: minimum read depth (-d 5) to filter out low covered regions, maximum read depth (-D 255) to filter out randomly placed repetitive hits. Those SNPs with an SNP quality greater than 45 were considered high quality and were used for subsequent analysis.
Detecting Regions of no or Low Read Coverage
Regions of no or low read coverage can be caused by either ineffective sequence capture or inaccuracy in short reads mapping. GC content can affect Solexa base calling and PCR amplification. In addition, low complexity regions can affect short reads mapping. GC content and read coverage were computed in an 81-bp window.
Prediction of Functional Consequences of SNPs
The final filtered SNPs were annotated using ANNOVAR [45] to identify the gene region to which the SNPs located. The online rs3106189 and rs1052918 Predict CRC Survival
tool SNPnexus was then used for functional annotation for all the SNPs. SNPnexus is a database providing a complete set of functional annotations of SNPs including consequences to genes and regulatory elements [46]. PolyPhen [47], SIFT [48–50] and PROVEAN [51] were used for prediction of functional effect of human nsSNPs. Another online tool, FastSNP [52], was used to predict exonic splicing enhancer/silencer motifs changed by the SNP alleles by integrating results from ESEfinder [53], RESCUE-ESE [54] and FAS-ESS [55] and transcription factor binding sites alteration by TFSEARCH. Moreover, all the SNPs were searched against RegulomeDB to determine involvement in regulatory DNA elements including regions of DNAase hypersensitivity, binding sites of transcription factors, and promoter regions obtained from public ChIP-seq datasets [56].
SNP Genotyping
SNP Genotyping Using the Sequenom MassARRAY iPLEX Platform was conducted by the Beijing Genomic Institute (BGI, Shenzhen) according to the manufacturer’s protocol, as previously described [57]. Briefly, PCR primers and extension probes were designed using the Sequenom MassARRAY Assay Design 3.0 software. PCR amplification and single-base extension were performed. The purified extension products were dispensed onto a Spectro-CHIP bioarray and analyzed using a MALDI-TOF mass spectrometer. The data were analyzed using the MassAR-RAY Workstation software (version 3.3). Laboratory personnel conducting the genotyping were blinded to patient information. Strict quality control measures were implemented during geno-typing with over 98% concordance between samples genotyped in duplicate.
Statistical and Data Analysis
Overall survival analysis was conducted using Stata 12. The overall survival time was defined as the month from initial surgery to death from any cause. The relationship between the survival time and an allele was assessed using the Kaplan-Meier method and plotted using Stata 12. All patients alive or lost were censored for analysis. Hazard ratios (HRs) and 95% confidence intervals (CIs) were estimated from a multivariate Cox proportional hazards model, adjusting for age, gender, tumor position, differentiation, tumor stage, positive lymph node status, and infiltration depth, adopting three genetic models (dominant, recessive, and additive). The Hardy-Weinberg equilibrium (HWE) for each SNP was determined using the hwsnp function in Stata 12.
Confirmation of the Variations
To confirm SNPs identified by the next-generation sequencing techniques, we performed allele-specific PCR (AS-PCR) [18,19] in
a cohort of 46 samples of individual colorectal cancer samples and 4 healthy volunteers. We employed AS-PCR, which is an efficient procedure for genotyping single nucleotide polymorphisms devel-oped by Ye et al. [18,19]. In brief, primers (Table S4) were designed using an online program for designing AS-PCR primers (http://cedar.genetics.soton.ac.uk/public_html/primer1.html) [19]. Each PCR reaction was performed in a total volume of 10ml, containing a final concentration of 16TAKARA Ex Taq Buffer, 2.5 mM Mg2+
, 250mM of each dNTP,0.2mM of each primer and 5 U/ml TaKaRa Ex Taq polymerase. The results were analyzed using 2% agarose gel electrophoresis.
Supporting Information
Figure S1 The landscape of the two SNPs viewed by the UCSC genome browser. (A) rs3106189 at the 59 UTR of TAPBP. (B) rs1052918 at the 39UTR of TCF3. The red boxes represent the target SNP sites. Each row represents a regulatory element in UCSC genome browser such as the surrounding SNPs, binding region from ChIP-seq by ENCODE project and conservation scores.
(TIF)
Table S1 List of SNPs identified in CRC patients. (XLSX)
Table S2 List of SNPs locating in conserved transcrip-tion factor binding sites.
(XLSX)
Table S3 List of SNPs locating in CpG islands. (XLSX)
Table S4 List of primers used for SNP validation. (XLSX)
Table S5 SNP validation of 8 randomly selected SNPs. (XLSX)
Table S6 SNP Genotyping using the Sequenom Mas-sARRAY iPLEX platform in 30 CRC patients.
(XLSX)
Table S7 SNP genotyping using the Sequenom MassAR-RAY iPLEX platform in 117 CRC patients.
(XLSX)
Author Contributions
Conceived and designed the experiments: JW SZ BL. Performed the experiments: XL JZ CC DH XH. Analyzed the data: JS FM. Wrote the paper: JS SZ BL.
References
1. Fodde R (2002) The APC gene in colorectal cancer. Eur J Cancer 38: 867–871. 2. Chiu BC, Ji BT, Dai Q, Gridley G, McLaughlin JK, et al. (2003) Dietary factors and risk of colon cancer in Shanghai, China. Cancer Epidemiol Biomarkers Prev 12: 201–208.
3. Kinzler KW, Nilbert MC, Su LK, Vogelstein B, Bryan TM, et al. (1991) Identification of FAP locus genes from chromosome 5q21. Science 253: 661– 665.
4. Sparks AB, Morin PJ, Vogelstein B, Kinzler KW (1998) Mutational analysis of the APC/beta-catenin/Tcf pathway in colorectal cancer. Cancer Res 58: 1130– 1134.
5. Cargill M, Altshuler D, Ireland J, Sklar P, Ardlie K, et al. (1999) Characterization of single-nucleotide polymorphisms in coding regions of human genes. Nature Genetics 22: 231–238.
6. Topol EJ, Frazer KA (2007) The resequencing imperative. Nature Genetics 39: 439–440.
7. Wood LD, Parsons DW, Jones S, Lin J, Sjoblom T, et al. (2007) The genomic landscapes of human breast and colorectal cancers. Science 318: 1108–1113.
8. Greenman C, Stephens P, Smith R, Dalgliesh GL, Hunter C, et al. (2007) Patterns of somatic mutation in human cancer genomes. Nature 446: 153–158. 9. Sjoblom T, Jones S, Wood LD, Parsons DW, Lin J, et al. (2006) The consensus coding sequences of human breast and colorectal cancers. Science 314: 268–274. 10. Lin B, Wang J, Cheng Y (2008) Recent Patents and Advances in the Next-Generation Sequencing Technologies Recent Patents on Biomedical Engineer-ing 1: 60–67.
11. Schuster SC (2008) Next-generation sequencing transforms today’s biology. Nat Methods 5: 16–18.
12. Mardis ER (2008) Next-generation DNA sequencing methods. Annu Rev Genomics Hum Genet 9: 387–402.
13. Bass AJ, Lawrence MS, Brace LE, Ramos AH, Drier Y, et al. (2011) Genomic sequencing of colorectal adenocarcinomas identifies a recurrent VTI1A-TCF7L2 fusion. Nat Genet 43: 964–968.
14. Network TCGA (2012) Comprehensive molecular characterization of human colon and rectal cancer. Nature 487: 330–337.
rs3106189 and rs1052918 Predict CRC Survival
15. Pritchard CC, Smith C, Salipante SJ, Lee MK, Thornton AM, et al. (2012) ColoSeq provides comprehensive lynch and polyposis syndrome mutational analysis using massively parallel sequencing. J Mol Diagn 14: 357–366. 16. Bienz M, Clevers H (2000) Linking colorectal cancer to Wnt signaling. Cell 103:
311–320.
17. Jongeneel CV, Delorenzi M, Iseli C, Zhou D, Haudenschild CD, et al. (2005) An atlas of human gene expression from massively parallel signature sequencing (MPSS). Genome Res 15: 1007–1014.
18. Wangkumhang P, Chaichoompu K, Ngamphiw C, Ruangrit U, Chanprasert J, et al. (2007) WASP: a Web-based Allele-Specific PCR assay designing tool for detecting SNPs and mutations. BMC Genomics 8: 275.
19. Ye S, Dhillon S, Ke X, Collins AR, Day IN (2001) An efficient procedure for genotyping single nucleotide polymorphisms. Nucleic Acids Res 29: E88–88. 20. Latorra D, Campbell K, Wolter A, Hurley JM (2003) Enhanced allele-specific
PCR discrimination in SNP genotyping using 39 locked nucleic acid (LNA) primers. Hum Mutat 22: 79–85.
21. Picelli S, Zajac P, Zhou XL, Edler D, Lenander C, et al. (2010) Common variants in human CRC genes as low-risk alleles. Eur J Cancer 46: 1041–1048. 22. Nejentsev S, Walker N, Riches D, Egholm M, Todd JA (2009) Rare variants of IFIH1, a gene implicated in antiviral responses, protect against type 1 diabetes. Science 324: 387–389.
23. Chaki M, Airik R, Ghosh AK, Giles RH, Chen R, et al. (2012) Exome capture reveals ZNF423 and CEP164 mutations, linking renal ciliopathies to DNA damage response signaling. Cell 150: 533–548.
24. Ng SB, Turner EH, Robertson PD, Flygare SD, Bigham AW, et al. (2009) Targeted capture and massively parallel sequencing of 12 human exomes. Nature 461: 272–276.
25. Bond GL, Hu W, Bond EE, Robins H, Lutzker SG, et al. (2004) A single nucleotide polymorphism in the MDM2 promoter attenuates the p53 tumor suppressor pathway and accelerates tumor formation in humans. Cell 119: 591– 602.
26. Passarelli MN, Phipps AI, Potter JD, Makar KW, Coghill AE, et al. (2012) Common Single-Nucleotide Polymorphisms in the Estrogen Receptor beta Promoter Are Associated with Colorectal Cancer Survival in Postmenopausal Women. Cancer Res 73: 767–775.
27. Zhang M, Hu Z, Huang J, Shu Y, Dai J, et al. (2010) A 39-untranslated region polymorphism in IGF1 predicts survival of non-small cell lung cancer in a Chinese population. Clin Cancer Res 16: 1236–1244.
28. Hao B, Miao X, Li Y, Zhang X, Sun T, et al. (2006) A novel T-77C polymorphism in DNA repair gene XRCC1 contributes to diminished promoter activity and increased risk of non-small cell lung cancer. Oncogene 25: 3613– 3620.
29. You FM, Huo N, Deal KR, Gu YQ, Luo MC, et al. (2011) Annotation-based genome-wide SNP discovery in the large and complex Aegilops tauschii genome using next-generation sequencing without a reference genome sequence. BMC Genomics 12: 59.
30. Wagle N, Berger MF, Davis MJ, Blumenstiel B, Defelice M, et al. (2012) High-throughput detection of actionable genomic alterations in clinical tumor samples by targeted, massively parallel sequencing. Cancer Discov 2: 82–93. 31. Ikura T, Ogryzko VV, Grigoriev M, Groisman R, Wang J, et al. (2000)
Involvement of the TIP60 histone acetylase complex in DNA repair and apoptosis. Cell 102: 463–473.
32. Sakuraba K, Yasuda T, Sakata M, Kitamura YH, Shirahata A, et al. (2009) Down-regulation of Tip60 gene as a potential marker for the malignancy of colorectal cancer. Anticancer Res 29: 3953–3955.
33. Lind GE, Kleivi K, Meling GI, Teixeira MR, Thiis-Evensen E, et al. (2006) ADAMTS1, CRABP1, and NR3C1 identified as epigenetically deregulated genes in colorectal tumorigenesis. Cell Oncol 28: 259–272.
34. Ahlquist T, Lind GE, Costa VL, Meling GI, Vatn M, et al. (2008) Gene methylation profiles of normal mucosa, and benign and malignant colorectal tumors identify early onset markers. Mol Cancer 7: 94.
35. Zhang Y, Lan Q, Rothman N, Zhu Y, Zahm SH, et al. (2005) A putative exonic splicing polymorphism in the BCL6 gene and the risk of non-Hodgkin lymphoma. J Natl Cancer Inst 97: 1616–1618.
36. Ortmann B, Copeman J, Lehner PJ, Sadasivan B, Herberg JA, et al. (1997) A critical role for tapasin in the assembly and function of multimeric MHC class I-TAP complexes. Science 277: 1306–1309.
37. Seliger B, Schreiber K, Delp K, Meissner M, Hammers S, et al. (2001) Downregulation of the constitutive tapasin expression in human tumor cells of distinct origin and its transcriptional upregulation by cytokines. Tissue Antigens 57: 39–45.
38. Atkins D, Breuckmann A, Schmahl GE, Binner P, Ferrone S, et al. (2004) MHC class I antigen processing pathway defects, ras mutations and disease stage in colorectal carcinoma. Int J Cancer 109: 265–273.
39. Lou Y, Basha G, Seipp RP, Cai B, Chen SS, et al. (2008) Combining the antigen processing components TAP and Tapasin elicits enhanced tumor-free survival. Clin Cancer Res 14: 1494–1501.
40. Slyper M, Shahar A, Bar-Ziv A, Granit RZ, Hamburger T, et al. (2012) Control of breast cancer growth and initiation by the stem cell-associated transcription factor TCF3. Cancer Res 72: 5613–5624.
41. Chiaro C, Lazarova DL, Bordonaro M (2012) Tcf3 and cell cycle factors contribute to butyrate resistance in colorectal cancer cells. Biochem Biophys Res Commun 428: 121–126.
42. Li H, Durbin R (2009) Fast and accurate short read alignment with Burrows-Wheeler transform. Bioinformatics 25: 1754–1760.
43. Li H, Handsaker B, Wysoker A, Fennell T, Ruan J, et al. (2009) The Sequence Alignment/Map format and SAMtools. Bioinformatics 25: 2078–2079. 44. Li H, Ruan J, Durbin R (2008) Mapping short DNA sequencing reads and
calling variants using mapping quality scores. Genome Res 18: 1851–1858. 45. Wang K, Li M, Hakonarson H (2010) ANNOVAR: functional annotation of
genetic variants from high-throughput sequencing data. Nucleic Acids Res 38: e164.
46. Chelala C, Khan A, Lemoine NR (2009) SNPnexus: a web database for functional annotation of newly discovered and public domain single nucleotide polymorphisms. Bioinformatics 25: 655–661.
47. Ramensky V, Bork P, Sunyaev S (2002) Human non-synonymous SNPs: server and survey. Nucleic Acids Res 30: 3894–3900.
48. Ng PC, Henikoff S (2003) SIFT: Predicting amino acid changes that affect protein function. Nucleic Acids Res 31: 3812–3814.
49. Ng PC, Henikoff S (2001) Predicting deleterious amino acid substitutions. Genome Res 11: 863–874.
50. Kumar P, Henikoff S, Ng PC (2009) Predicting the effects of coding non-synonymous variants on protein function using the SIFT algorithm. Nat Protoc 4: 1073–1081.
51. Choi Y, Sims GE, Murphy S, Miller JR, Chan AP (2012) Predicting the functional effect of amino Acid substitutions and indels. PLoS One 7: e46688. 52. Yuan HY, Chiou JJ, Tseng WH, Liu CH, Liu CK, et al. (2006) FASTSNP: an
always up-to-date and extendable service for SNP function analysis and prioritization. Nucleic Acids Res 34: W635–641.
53. Cartegni L, Wang J, Zhu Z, Zhang MQ, Krainer AR (2003) ESEfinder: A web resource to identify exonic splicing enhancers. Nucleic Acids Res 31: 3568–3571. 54. Fairbrother WG, Yeh RF, Sharp PA, Burge CB (2002) Predictive identification
of exonic splicing enhancers in human genes. Science 297: 1007–1013. 55. Wang Z, Rolish ME, Yeo G, Tung V, Mawson M, et al. (2004) Systematic
identification and analysis of exonic splicing silencers. Cell 119: 831–845. 56. Boyle AP, Hong EL, Hariharan M, Cheng Y, Schaub MA, et al. (2012)
Annotation of functional variation in personal genomes using RegulomeDB. Genome Res 22: 1790–1797.
57. Zhou D, Yang L, Zheng L, Ge W, Li D, et al. (2013) Exome capture sequencing of adenoma reveals genetic alterations in multiple cellular pathways at the early stage of colorectal tumorigenesis. PLoS One 8: e53310.
rs3106189 and rs1052918 Predict CRC Survival