SRef-ID: 1432-0576/ag/2004-22-2679 © European Geosciences Union 2004
Annales
Geophysicae
Thermodynamic structure of the Atmospheric Boundary Layer over
the Arabian Sea and the Indian Ocean during pre-INDOEX and
INDOEX-FFP campaigns
M. V. Ramana, Praveena Krishnan, S. Muraleedharan Nair, and P. K. Kunhikrishnan
Space Physics Laboratory, Vikram Sarabhai Space Centre, Thiruvananthapuram - 695 022, India
Received: 21 July 2003 – Revised: 27 February 2004 – Accepted: 30 March 2004 – Published: 7 September 2004
Abstract.Spatial and temporal variability of the Marine At-mospheric Boundary Layer (MABL) height for the Indian Ocean Experiment (INDOEX) study period are examined us-ing the data collected through Cross-chained LORAN (Long-Range Aid to Navigation) Atmospheric Sounding System (CLASS) launchings during the Northern Hemispheric win-ter monsoon period. This paper reports the results of the analyses of the data collected during the pre-INDOEX (1997) and the INDOEX-First Field Phase (FFP; 1998) in the lati-tude range 14◦
N to 20◦
S over the Arabian Sea and the Indian Ocean. Mixed layer heights are derived from thermodynamic profiles and they indicated the variability of heights rang-ing from 400 m to 1100 m durrang-ing daytime dependrang-ing upon the location. Mixed layer heights over the Indian Ocean are slightly higher during the INDOEX-FFP than the pre-INDOEX due to anomalous conditions prevailing during the INDOEX-FFP. The trade wind inversion height varied from 2.3 km to 4.5 km during the pre-INDOEX and from 0.4 km to 2.5 km during the INDOEX-FFP. Elevated plumes of pol-luted air (lofted aerosol plumes) above the marine bound-ary layer are observed from thermodynamic profiles of the lower troposphere during the INDOEX-FFP. These elevated plumes are examined using 5-day back trajectory analysis and show that one group of air mass travelled a long way from Saudi Arabia and Iran/Iraq through India before reach-ing the location of measurement, while the other air mass originates from India and the Bay of Bengal.
Key words. Meteorology and atmospheric dynamics (trop-ical meteorology, general circulation, ocean-atmosphere in-teraction, convective processes) – Atmospheric composition and structure (aerosols and particles, pollution-urban arid re-gional) – Oceanography physical (air-sea interactions)
Correspondence to:P. K. Kunhikrishnan (pk kunhikrishnan@vssc.org)
1 Introduction
INDian Ocean EXperiment (INDOEX) is an international field campaign research programme aimed at understanding the interaction between aerosols and radiation, the transport and dispersion of trace species and pollutants of continental origin over the Indian Ocean during the north-east Asian win-ter monsoon period (Ramanathan et al., 1995; Mitra, 1999). In order to understand the above mechanisms, additional in-formation, like atmospheric boundary layer depth and the height of the monsoonal inversion, with particular emphasis on diurnal variability and variation from the Indian coast up to the Inter Tropical Convergence Zone (ITCZ) are required. For air pollution studies the mixing height is an important pa-rameter because it defines the height to which pollutants re-leased near the ground are vertically mixed by (dry-) convec-tive or mechanical turbulence, typically within one hour or less (Beyrich et al., 1996). In the frame of the INDOEX, ex-tensive dynamical and thermodynamical measurements were made over the Arabian Sea and Indian Ocean during the win-ter (dry) season (Ramana et al., 2004).
Fig. 1.Map showing the cruise tracks of the pre-INDOEX and INDOEX-FFP. Filled circles along the cruise tracks represent the soundings, which are used in Figs. 2, 3, 6 and 7.
winter season over the Arabian Sea and the Indian are not many. It is in this context that the data collected during the INDOEX attains prime scientific significance.
During the Northern Hemispheric winter the meridional circulation over the Arabian Sea and the Indian Ocean is often idealized as an equatorward flow capped by the trade wind inversion that weakens and increases in height equator-ward. Inter Tropical Convergence Zone (ITCZ) is known to be associated with deep convection, where subsidence gives way to mean upward motion, called the “disturbed condi-tion”. In contrast, during the “undisturbed conditions” clouds are generally trapped beneath the subsidence inversion gen-erated by the subtropical highs. Consequently, the tropical Indian Ocean is a region of transition between the undis-turbed trade wind subsidence and the disundis-turbed convective region of the ITCZ. This is only an average picture, however, because this region is basically void of data; the transition be-tween undisturbed and disturbed conditions has not yet been as well documented over the Indian Ocean as it has been in the Atlantic and the Pacific Oceans.
A series of INDOEX cruises in 1996, 1997, and 1998 were conducted during winter months of December to March be-fore the main phase in 1999 (Mitra, 1999). In this paper, data collected during the pre-INDOEX (winter 1997) and the INDOEX-First Field Phase (FFP; winter 1998) are in-vestigated. The primary focus of this study is to investigate the thermodynamic structure of the MABL under horizon-tal variability of the Sea Surface Temperature (SST) and air masses due to meridional advection during the pre-INDOEX and the INDOEX-FFP through ship-borne in-situ measure-ments.
2 Data
The present study is based on tropospheric soundings made from the ship platform of ORV-SagarKanya during the pre-INDOEX (27 December 1996–31 January 1997) in the latitude range 15◦N to 14◦S and the INDOEX-FFP (18
February 1998–31 March 1998) in the latitude range 15◦N
to 20◦S. Figure 1 shows the map of pre-INDOEX and
INDOEX-FFP cruise tracks. During the pre-INDOEX cruise the Cross-chained LORAN (Long-Range Aid to Navigation) Atmospheric Sounding System (CLASS) along with Global Positioning Systems (GPS) made available by National Cen-tre for Atmospheric Research (NCAR) were used for profil-ing pressure (P), temperature (T), relative humidity (RH), dew-point temperature (Td), wind speed (W S) and wind
di-rection (W D) from the ship along the entire cruise track. Launchings were made every day at 06:00 and 14:00 IST (all timings are in Indian Standard Time, IST=UTC+5.30 h). A total of 46 ascents were successfully undertaken during the pre-INDOEX with vertical height resolution of 30 to 40 m, up to a height of 17 to 20 km. Similarly, during the INDOEX-FFP cruise, the CLASS was used for profiling without GPS, hence, onlyT, RH, Td, and P could be measured. A
to-tal of 47 sonde ascents were executed during the INDOEX-FFP from 4.5◦
N onwards at 06:00 and 14:00 IST every day and they too attained 17 to 20 km altitudes. The uncertain-ties in the temperature and pressure measurements are 0.5◦
C and 1.0 mb, respectively. The uncertainties of the humidity measurements are 1% near the surface and 10–15% between 7–15 km altitudes.
Potential temperature (θ), virtual potential temperature (θv), mixing ratio (q), saturated mixing ratio (qs), equivalent
300 325 350 375 0
1 2 3 4 5
A
ltitud
e, k
m
0 5 10 15 20
300 325 350 375
0 1 2 3 4 5
A
ltitu
de
, k
m
0 5 10 15 20 25
300 325 350 375
Temperatures in k 0
1 2 3 4 5
Al
ti
tude
, km
0 5 10 15 20
q, gm/kg 10°01'N 74°53'E
05°47'S 78°25'E
10°03'S 78°57'E
es e
v v
e es
v e es
Mixed layer Conditionally unstable layer
Trade wind inversion
MA
B
L
Transition layer
Trade wind inversion
Cloud Layer
Mixed layer Transition Layer
MA
B
L
Mixed layer Cloud Layer
pre-INDOEX : Onward (a)
(b)
(c)
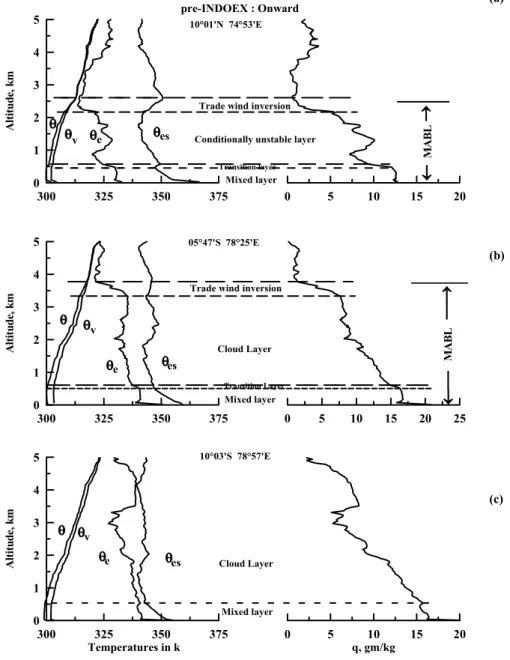
Fig. 2. Altitude profiles of potential temperature (θ), virtual potential temperature (θv), equivalent potential temperature (θe), saturated
equivalent potential temperature (θes) and mixing ratio (q) during the on ward track of pre-INDOEX.
temperature (θes) are calculated fromT,Td andRH. θe is
conserved for both dry and moist adiabatic processes in the absence of precipitation (Betts, 1973), and therefore is an excellent tracer of the air motion. Different layers and the presence of stable layers are identified and their heights are measured from the profiles within the boundary layer, based on the relative invariance ofθ,θv,θe,θesandq. In the
sub-sequent sections, the observed features of the MABL during the pre-INDOEX and the INDOEX-FFP are given.
3 Thermodynamic structure
The present study is an attempt towards attaining a better un-derstanding of the vertical structure of the MABL over the
tropical Indian Ocean and the Arabian Sea. We confined our analysis of all the profiles from the surface to an altitude of 5 km. We also paid attention to the inversion layers (stable layers) because of their crucial role in controlling the verti-cal and horizontal transport of aerosols and trace gases in the lower atmosphere.
3.1 Pre-INDOEX
The vertical profiles of θ, θv, θe, θes and q at 10◦01′N
74◦
53′
E over the Arabian Sea during 14:00 IST up to 5 km altitude are shown in Fig. 2a. The profiles ofθ,θv,θe and
300 325 350 375 0
1 2 3 4 5
A
lt
it
ude
, km
0 5 10 15 20
300 325 350 375
0 1 2 3 4 5
A
lt
it
u
de
, km
0 5 10 15 20
300 325 350 375
Temperatures in k 0
1 2 3 4 5
Al
ti
tu
d
e,
km
0 5 10 15 20
q, gm/kg 12°07'S 71°42'E
01°15'S 74°21'E
12°18'N 74°E Trade wind inversion
Cloud layer
Transition Layer
Mixed layer
MA
B
L
Transition Layer
Mixed Layer Conditionally unstable layer
Trade wind inversion
MA
B
L
Mixed layer Transition Layer Cloud Layer
es e
v
es e
v
es e
v
pre-INDOEX : Return
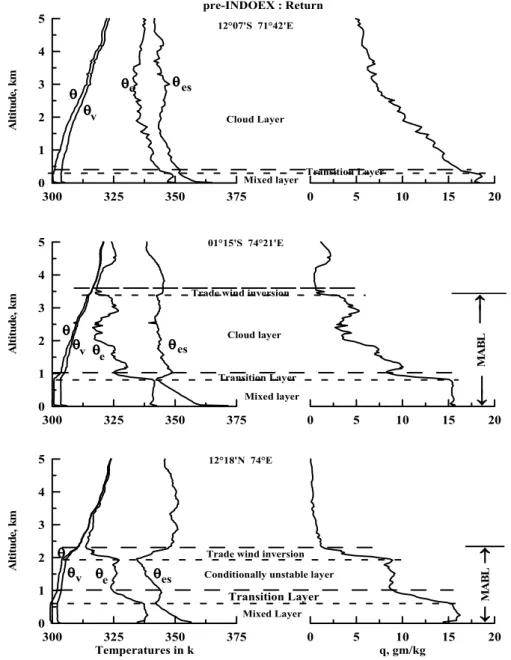
Fig. 3. Altitude profiles of potential temperature (θ), virtual potential temperature (θv), equivalent potential temperature (θe), saturated
equivalent potential temperature (θes) and mixing ratio (q) during the return track of pre-INDOEX.
characteristics of a mixed layer and we denote this layer as mixed layer. This layer has more moisture than the layers above (evident fromq profile). Above the 500 m altitudes an inversion layer of around 75 m width is seen in these profiles. The vertical gradients ofθandθvbecame positive above the
inversion layer up to around 2.2 km, with lapse rates lying between the moist and dry adiabatic values, whereas, on av-erage,θeis decreasing with height in this region (∂θe/∂Z<0),
indicating a convective instability region with respect to satu-rated parcel displacements.θesis also decreasing with height
(∂θes/∂Z<0) above the transition layer up to 2.2 km
indicat-ing the conditionally unstable atmosphere. We denoted this region as an conditionally unstable layer and whose lower boundary is the inversion level. The inversion layer, which
is separating the mixed layer and the conditionally unstable layer, is named as a transition layer. The decrease in θe is
rapid across the transition layer, which separates the condi-tionally unstable layer air from the surface mixed layer.
The conditionally unstable layer is capped by an inversion layer, which is called a trade wind inversion layer; whereθ,
θv,θes are increasing andq andθe have a greater decrease
with height than in the layers below. The trade wind inver-sion top, which acts as an interface between MABL and the free atmosphere, is marked by a maximum ofθesand a
cor-responding minimum inθe (Betts and Albrecht, 1987). In
general,θe attains a minimum value at the level of
separa-tion between moist and dry air. The altitude of theθes
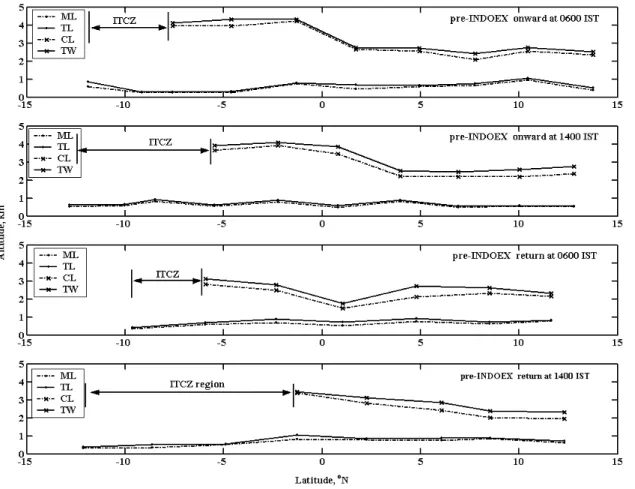
Fig. 4.Latitudinal variation of Mixed Layer (ML) height, Transition Layer (TL) height, Cloud layer (CL) and Trade Wind inversion (TW) heights during pre-INDOEX. The continuous and dotted lines joined with the dot symbol represent the TL height and ML height, respectively. The continuous and dotted lines joined with the cross symbol represent the TW height, and CL height respectively.
and top of the trade wind inversion. Theθe attains a
mini-mum andθesattains a maximum at 2.5 km, which is the top
of the trade inversion. The thermal changes are also accom-panied by sharp changes in humidity in the vicinity of the stable layers (q profile). On average, the mixing ratio be-came almost negligible at an altitude of about 2.5 km. The
θeandθesprofiles are used to estimate the conditionally
un-stable and trade wind inversion heights becauseθ,θv andq
are not conserved variables. The typical four-layer thermal structure, shown in Fig. 2a, namely mixed layer, transitional layer, conditionally unstable layer and trade wind inversion layer, are characteristically observed up to about (near) the equator during the onward track of the pre-INDOEX.
Further downstream (southward), profiles ofθ,θv,θe,θes
andq at 05◦
47′
S 78◦
25′
E during 14:00 IST up to 5 km al-titude are shown in Fig. 2b. Here, a well-mixed layer exists in first 500 m above the ocean is surface, capped with a weak transition layer. Through the conditionally unstable layerθv
is increasing according to nearly moist adiabatic ascent while
θe andθesare approximately constant (indicates moist
adia-batic layer) up to 3.3 km. Here several factors can be in-voked, like the relatively strong convective activity (mixed layerθe∼=340 K and surfaceθe>345 K) at the surface
asso-ciated with high moisture content (evident from q profile) in the mixed layer, as well as a weak transition layer, mostly cloudy skies (the difference betweenθeandθesis decreased),
all of which could have enabled the increase in the height of the conditionally unstable layer, due to which the trade wind inversion height is forced to greater altitudes of around 3.5 km. Here we observed the clouds, (from manual obser-vations; alsoq profile shows high moisture content) due to which we renamed the conditionally unstable layer as a cloud layer.
The vertical profiles of θ, θv, θe, θes andq at 10◦03′S
78◦57′E over the Indian Ocean, near the ITCZ region
dur-ing 14:00 IST up to 5 km altitude are shown in Fig. 2c. The mixed layer has a dry adiabatic temperature profile with no measurable inversion at the top. Through the cloud layerθv
is following a moist adiabatic lapse rate, whileθeis
approxi-mately constant right from the surface up to a higher height. Here,θesprofile is approaching the profile ofθe, clearly
in-dicating the existence of saturated layer. The absence of a capping inversion over the mixed layer (surfaceθe>345 K)
(a) (b)
K g kg-1
Fig. 5. Contour plots of(a)equivalent potential temperature and(b)mixing ratio over the entire latitude range during pre-INDOEX. The boundary between red and blue is the trade wind inversion layer.
300 325 350 375 0
1 2 3 4 5
A
lt
itu
de
, km
0 5 10 15 20 300 325 350 375 0 5 10 15 20
300 325 350 375 Temperatures in k 0
1 2 3 4 5
Al
ti
tu
d
e,
k
m
0 5 10 15 20 q, gm/kg
300 325 350 375 Temperatures in k
0 5 10 15 20 q, gm/kg 06°03'S 69°09'E 09°31'S 66°14'E
13°09'S 63°19'E 15°15'S 61°43'E INDOEX-FFP : Onward
v v
e es
e es
v
v
e es
e es
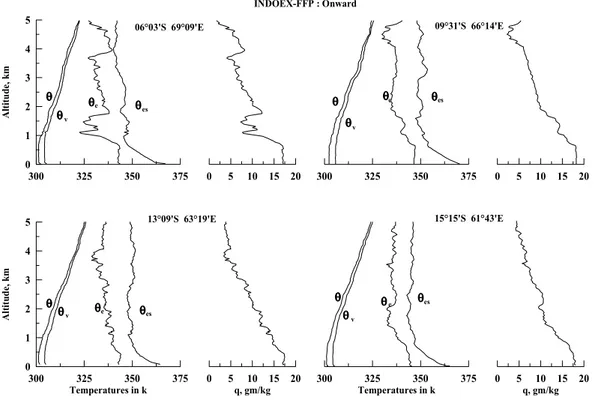
Fig. 6. Altitude profiles of potential temperature (θ), virtual potential temperature (θv), equivalent potential temperature (θe), saturated
300 325 350 375 0
1 2 3 4 5
A
lt
it
ude
, km
0 5 10 15 20
300 325 350 375
0 1 2 3 4 5
Al
ti
tu
d
e,
k
m
0 5 10 15 20
300 325 350 375
Temperatures in k
0 1 2 3 4 5
A
lt
it
ude
, km
0 5 10 15 20
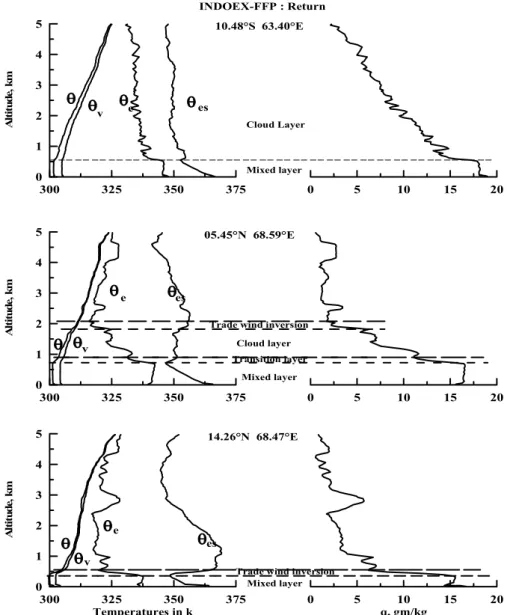
q, gm/kg 10.48°S 63.40°E
INDOEX-FFP : Return
Mixed layer
Mixed layer Mixed layer Transition layer
Cloud layer Trade wind inversion
Trade wind inversion
05.45°N 68.59°E
14.26°N 68.47°E
es e
v v
e es
v e es
Cloud Layer
Fig. 7. Altitude profiles of potential temperature (θ), virtual potential temperature (θv), equivalent potential temperature (θe), saturated
equivalent potential temperature (θes) and mixing ratio (q) during the return track of INDOEX-FFP.
top reaches tropopause. The ITCZ was located at around 7◦
S to 10◦
S during the onward track of the pre-INDOEX (Ramana et al., 2004). Trade wind inversion is not seen in these profiles due to the large extent of cloud layer associ-ated with low-level convergence zone. It is difficult to define the boundary layer top either theoretically or from measure-ments when deep clouds are present (Stull, 1988; Garratt, 1992).
Figures 3a, b and c show the daytime (14:00 IST) pro-files ofθ,θv,θe,θes andq during the return journey of the
pre-INDOEX at 12◦
07′
S 71◦
42′
E, 01◦
15′
S 74◦
21′
E and 12◦
18′
N 74◦
E, respectively. Return track profiles are fol-lowing the same pattern as observed in the onward track. In general, surfaceθe values varied from 330 K at 14◦N to
349 K at 12◦
S (near the ITCZ region). It is reported thatθe
values greater than 345 K are conducive for deep convection in the tropics (Betts and Ridgway, 1989), andθeis found to
be larger than this critical value near the ITCZ.
Mixed Layer (ML) height, Transition Layer (TL) height, Cloud Layer (CL) height and Trade Wind inversion (TW) heights are derived from all the pre-INDOEX profiles. The maximum uncertainties in these heights are∼30 m, at most.
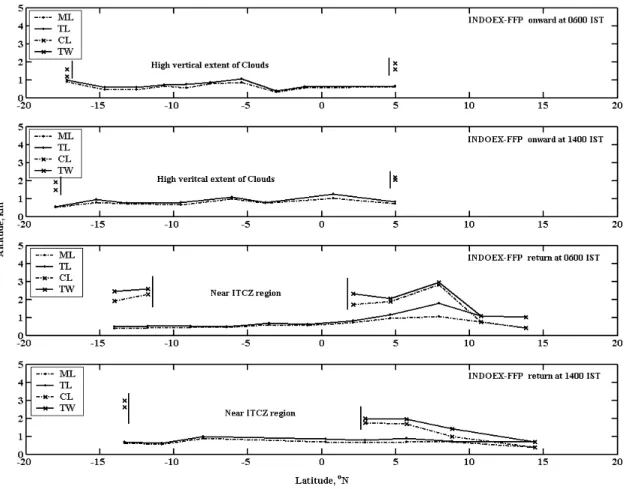
Fig. 8. Latitudinal variation of Mixed Layer (ML) height, Transition Layer (TL) height, Cloud Layer (CL) and Trade Wind inversion (TW) heights during INDOEX-FFP. The continuous and dotted lines joined with the dot symbol represent the TL height and ML height, respectively. The continuous and dotted lines joined with the cross symbol represent TW height and CL height, respectively.
entire latitude range are obtained and are shown in Figs. 5a and b respectively. The colour scales ofθe(K) andq(g.kg−1)
are shown beside the plots. The relatively largeθe(near
sur-face red colour) close to the sursur-face indicates the strength of the convection activity. The boundary between red and blue (from surface red colour to blue colour) is the trade wind inversion layer top. The thick red area (high values ofθe)
in Fig. 5a points out the strength of the convection. The trade wind boundary layer height is increasing towards the ITCZ. The ITCZ was located at around 7◦
S to 10◦
S during the onward track of the pre-INDOEX, whereas it was situ-ated south of 10◦
S during the return track (Ramana et al., 2004). The height of the inversion and its thermodynamic properties seem to depend on the balance between the mean atmospheric sinking and the turbulent mixing.
3.2 INDOEX-FFP
Figure 6 shows the vertical profiles ofθ,θv, θe, θes andq
measured at 14:00 IST at different latitudes over the Indian Ocean during the onward track of the INDOEX-FFP up to 5 km altitude in the south of the equator. All these profiles (exceptθes) show a shallow layer above the ocean’s surface
through which the vertical gradients are zero. Above this
layer, the profiles indicate the existence of a large vertical extent of clouds. The typical trade wind type of sinking is not observed in these profiles. The surface θe also
in-dicates the deep convection, whose values are greater than the critical value for deep convection. We are attributing this deep convection between the equator and 15◦S to an
anomalous event. Webster et al. (1999) reported the exis-tence of an anomalous event during this period over the In-dian Ocean (a warm sea surface temperature anomaly de-veloped in the western Indian Ocean; with a maximum of
>+2.0◦
C in February 1998). Ramana et al. (2004) reported high sea surface temperatures and higher sear-air tempera-ture difference (2 to 3◦
C) during the INDOEX-FFP period than the pre-INDOEX sea surface temperatures and sea-air temperature differences (1 to 2◦
C). This region was convec-tively active during the study period due to higher sea surface temperatures. This deep convection could have affected the marine boundary layer structure in this region.
Figure 7 shows the vertical profiles ofθ,θv,θe,θes and
q measured at 14:00 IST at different latitudes up to 5 km altitude during the return track of the INDOEX-FFP. The ITCZ is located around 10◦
(a) (b)
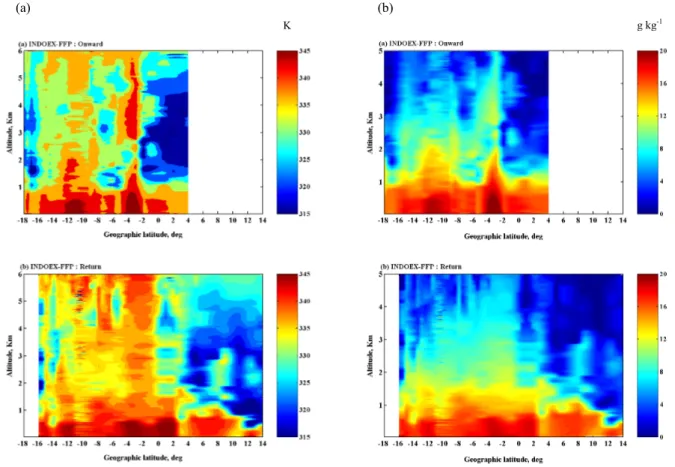
K g kg-1
Fig. 9. Contour plots of(a)equivalent potential temperature and(b)mixing ratio over the entire latitude range during INDOEX-FFP. The boundary between red and blue is the trade wind inversion layer.
existence of the trade wind inversion (in Figs. 7b and c) ex-cept in the vicinity of the ITCZ (in Fig. 7a). Yu and Rie-necker (1999) reported the resumption of a climatological state in March 1998 over the equatorial Indian Ocean region. The trade wind inversion top is located at a lower altitude (∼500 m) in Fig. 7c, indicating the subsidence activity reach-ing almost right up to the mixed layer top. Except in the re-gions of large-scale low-level convergence, subsidence pre-vails in the atmosphere and the subsidence tends to decrease the mixed layer depth by 300 to 400 m per day (Betts and Ridgway, 1989). The surface fluxes, on the other hand, tend to push the mixed layer upward, and the balance between these two opposing processes decides the actual height of the mixed layer. Therefore, a very strong subsidence must have prevailed to push down the trade wind inversion top to almost close to the surface. Strikingly in this profile a thin layer of warm and high humidity layer at 2.5 km height is seen. This thin layer is examined using back trajectory analysis, to un-derstand the plausible source regions and is discussed in the following section.
ML, TL, CL and TW heights are derived from all the INDOEX-FFP profiles. Latitudinal variation of ML, TL, CL and TW heights during onward and return tracks of the INDOEX-FFP are shown in Figs. 8a, b, c and d. We find it difficult to locate the trade wind inversion height between the equator and 10◦
S during the onward track, because of
the presence of the highly vertical extent of clouds from the surface to 10 km altitude. In general, mixed layer heights over the Indian Ocean are found to be slightly higher dur-ing the INDOEX-FFP compared to the pre-INDOEX; which could be due to the higher sea surface temperatures that pre-vailed during the INDOEX-FFP (Ramana et al., 2004). The trade wind inversion heights over the Arabian Sea are found to be higher in the pre-INDOEX than the INDOEX-FFP. The CLASS launchings were made only from 4.5◦
N onwards during the onward track of the INDOEX-FFP. Using all the CLASS profiles obtained during the INDOEX-FFP cruise, contour plots ofθeandqare obtained and shown in Figs. 9a
and b respectively. The colour scale ofθe(K) andq(g.kg−1)
are also in the plots. These plots are clearly indicating the trade wind inversion decrease towards NH (from disturbed area to undisturbed area) and are merging with the mixed layer. Contour plots of equivalent potential temperature are clearly indicating the strong convective activity over the In-dian Ocean during the onward as well as during the return tracks. Mixing ratios close to the surface (in the mixed layer) are slightly higher during the INDOEX-FFP than that in the pre- INDOEX cruise period.
To highlight the progressive development of the thin layer at 2.5 km (which is seen in Fig. 7c) with latitude during the return track of the INDOEX-FFP theθe andRH with
300 320 340 360 0 1 2 3 4 5 Altit ude , km
0 25 50 75 100
Relative humidity, %
300 320 340 360
0 1 2 3 4
50 25 50 75 100
Relative humidity, %
300 320 340 360
0 1 2 3 4 5 Altit ude, km
0 25 50 75 100
300 320 340 360
0 1 2 3 4
50 25 50 75 100
300 320 340 360
Equi. Potential Temp., K
0 1 2 3 4 5 Altit ude, km
0 25 50 75 100
300 320 340 360
Equi. Potential Temp., K
0 1 2 3 4
50 25 50 75 100
24 March 1998 02.57°N 69.00°E 1530 IST
25 March 1998 05.45°N 68.59°E 1530 IST
26 March 1998 07.56°N 68.59°E 0830 IST
26 March 1998 08.49°N 69.00°E 1530 IST
27 March 1998 12.23°N 68.15°E 2020 IST
28 March 1998 14.26°N 68.47°E 1445 IST
(a) (b)
(c) (d)
(e) (f)
Fig. 10. Altitude profiles of equivalent potential temperature (θe)
and relative humidity (RH) showing the progressive development of a layer with 2.5 km with latitude.
the thin layer developed from 2◦
N to 14◦
N. The constant temperature andRH layers in Fig. 10c are characteristics of the existence of land plumes in this region. Krishnamurti et al. (1998) suggested that the thickness of the elevated land plume transported over the ocean might be controlled by the diurnal variability of the atmospheric boundary layer above the land and the height of the trade wind inversion layer. Sea and land breezes are coastal phenomena that further mod-ulate the depth of the continental and marine atmospheric boundary layers (and hence the transport of aerosols). In ad-dition, the heterogeneous surface (the Western Ghats) along the west coast of India could also influence the structure of the land plumes. The depth of the quite variable mixed layer could be due to the complex nature of the land-sea breeze in-teractions with the offshore flow. Figure 10a shows the mul-tiple layers (at∼3 km altitude) with different thermal char-acteristics. South of 2◦
N, the land plume takes the form of a faint elevated layer. Light Detection and Ranging (LIDAR) systems have been used during the INDOEX campaigns to derive the aerosol vertical extinction coefficients. Ansmann et al. (2000) reported the existence of an aerosol layer with high humidity (at 2.5 km altitude) above the marine
bound-ary layer at Hulule (4.1◦N, 73.3◦E), using six-wavelength
aerosol LIDAR. Aerosol vertical extinction coefficients de-rived by LIDAR profiles showed an increase in the aerosol extinction coefficient inside this observed layer (Ansmann et al., 2000; Muller et al., 2000; 2001a; 2001b).
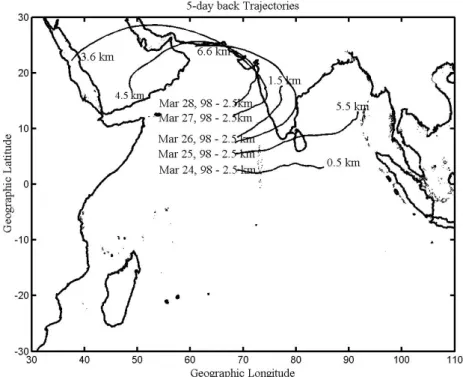
To identify origins of the aerosols in the land plume, we have performed back trajectory analysis using the NOAA Hybrid Single-Particle Lagrangian Integrated Trajec-tory (HYSPLIT, Version 4) model (Draxler and Rolph, 2003; Rolph, 2003). Five-day back trajectories at 2.5 km above the sea level are estimated and are shown in Fig. 11 for those thin layer events that we encountered. The back trajecto-ries describe the history of air parcels back in time, which influenced the aerosol characteristics (hence, thermal char-acteristics) at the location of measurements. Figure 11 in-dicates the air mass that travelled all the way to the mea-surement location. Some of the air parcels came from Saudi Arabia and Iran/Iraq through India, and other from India and Bay of Bengal. Moorthy and Saha (2000) reported high aerosol optical depths during the return track when compared to the onward track (Fig. 3 in their paper). Jayaraman (1999) and Jayaraman et al. (2001) also reported high aerosol opti-cal depths over the Arabian Sea. These plumes could have caused the increase in aerosol optical depths over the Ara-bian Sea, which suggests long-range transport of continental aerosols over the Arabian Sea.
4 Discussions and conclusions
Though a considerable amount of work has gone into study-ing the structure and characteristics of MABL over the Pa-cific Ocean and the Atlantic Ocean, the Indian Ocean re-mained one of the least explored regions. The Indian Ocean Experiment (INDOEX) was the first field experiment of its kind over the Indian Ocean. The INDOEX expedition was carried out in the four successive phases during the 1996 to 1999 Northern Hemisphere winter monsoon seasons, respec-tively. The present paper describes the results obtained from the pre-INDOEX and the INDOEX-FFP campaigns, which were carried out during winter 1997 and winter 1998, re-spectively. The study has dealt with descriptive aspects of the spatial and temporal variations of the boundary layer over the Arabian Sea and the Indian Ocean. The primary data used for studying the vertical structure of MABL came from CLASS profiles, collected on board a ship during the pre- INDOEX and the INDOEX-FFP.
Fig. 11.Five-day back trajectory analysis for the thin layer cases which are shown in Fig. 10. The numbers that are shown at the end of the trajectories indicate the height from where the trajectories are originated.
(Courtesy of NOAA Air Resource Laboratory; http://www.arl.noaa.gov/ready/hysplit4.html)
Indian Ocean during the pre-INDOEX. Trade wind inversion heights over the Arabian Sea are found to be low (∼0.5 km) during the INDOX-FFP due to strong subsidence. The most likely factors responsible for the spatiotemporal variability of the MABL are the proximity of land and the ITCZ. Two prominent features, which characterize the thermodynamic structure of the trade wind boundary layer, are the trade wind inversion and the transition layers, as noticed in the ther-modynamic profiles over the undisturbed area (away from the ITCZ). The trade wind inversion and the transition layer show considerable variation in the undisturbed area. The in-version was very strong over the Arabian Sea (with very dry air aloft) and was progressively weaker toward the equator. In the disturbed area (near the ITCZ), the stable layers are weakened. This weakening of stable layers might be caused by the upward energy transport due to active cumulus con-vection. In this disturbed area, the mixed layer is found to be somewhat lower than that in the undisturbed area due to the existence of low level clouds (near the ITCZ region).
Hastenrath (1991) identified the inversion located at the top of the cloud layer in the undisturbed area over the trop-ics, typically at an altitude of 2.5 km, as the trade wind in-version and he reported that this inin-version is strong and most persistent during the Northern Hemispheric winter. Johnson et al. (1993) have showed the evidence on trade wind inver-sion heights over the western Pacific warm pool using the TOGA-COARE sounding data, which was found to be hor-izontally uniform at 800 mb (∼=2 km) level. Firestone and Albrecht (1986), Kloesel and Albrecht (1989), and Schubert et al. (1995) have also reported similar trade wind stable
lay-ers near 2 km altitude, extending all the way to the equator in the eastern Pacific and the Atlantic Oceans.
The land plume is formed by air mass modification and its structure is apparent in thermal profiles (presented in this paper) and in aerosol measurement (shown in Ansmann et al., 2000). These land plumes could have a lateral extent of several hundred of kilometres, depending on its tory and distance from the coast. According to back trajec-tory analyses, the air masses composing the elevated plume were coming from Saudi Arabia and Iran/Iraq through In-dia and others from InIn-dia and the Bay of Bengal. The air mass originated from the land, as the winds were predomi-nantly north-easterly, creating an elevated plume that could potentially transport anthropogenic aerosols and gases over the open ocean, as hypothesized in Lelieveld et al. (2001). The presence of such an aerosol plume over the Arabian Sea and the Indian Ocean could have a significant impact on ra-diative forcing (Jayaraman et al., 1998), and its analysis can lead to a better understanding of the role of anthropogenic aerosols on Indian monsoon and global climate (Ramanathan and Ramana, 2003).
Acknowledgements. The authors gratefully acknowledge the
NOAA Air Resources Laboratory for the provision of the HYS-PLIT transport and dispersion model (http://www.arl.noaa.gov/ ready/hysplit4.html) used in this publication. We greatly acknowl-edge NCAR for launching CLASS balloons during the experiment. We thank anonymous reviewers for their comments on an earlier draft, which helped in improving the paper.
References
Ansmann, A., Althausen, D., Wandinger, U., Franke, K., Muller, D., Wagner, F., and Heintzenberg, J.: Vertical profiling of the Indian aerosol plume with six-wavelength lidar during INDOEX: A first case study, Geophys. Res. Lett., 27, 963–966, 2000.
Augstein, E.: The atmospheric boundary layer over the tropical oceans, Meteorology over the Tropical Oceans, edited by Shaw, D. B., Roy. Meteor. Soc., 73–104, 1978.
Augstein, E., Riehl, H., Ostapoff, F., and Wagner, V.: Mass and energy transport in an undisturbed Atlantic trade wind flow, Mon. Wea. Rev., 101, 101–111, 1973.
Augstein, E., Schmidt, H., and Ostapoff, F.: The vertical structure of the atmospheric planetary boundary layer in undisturbed trade winds over the Atlantic Ocean, Boundary-Layer Meteor., 6, 129– 150, 1974.
Betts, A. K.: Non-precipitating cumulus convection and its param-eterization, Q. J. R. Meteor. Soc., 99, 178–196, 1973.
Betts, A. K. and Ridgway, W.: Climatic equilibrium of the atmo-spheric convective boundary layer over a tropical ocean, J. At-mos. Sci., 46, 2621–2641, 1989.
Betts, A. K. and Albrecht, B. A.: Conserved variable analysis of the convective boundary layer thermodynamic structure over the tropical oceans, J. Atmos. Sci., 44, 83–99, 1987.
Beyrich, F.: On the estimation of mixed-layer height from Sodar data (A review), in: Proc. 8th ISARS’96 Symposium, Moscow, Russia, 27–31 May 1996, 6.11–6.22, 1996.
Draxler, R. R. and Rolph, G. D.: HYSPLIT (Hybrid Single-Particle Lagrangian Integrated Trajectory) Model access via NOAA ARL READY website (http://www.arl.noaa.gov/ready/hysplit4.html), NOAA Air Resources Laboratory, Silver spring, MD, 2003. Dunckel, M., Hasse, L., Krugermeyer, L., Schriever, D., and
Wuck-nitz, J.: Turbulent Fluxes of Momentum, Heat, and Moisture in the Atmospheric Surface Layer at Sea during ATEX: Atlantic Trade Winds Experiment, Boundary-Layer Meteorol., 6, 81–106, 1974.
Fairall, C. W., Bradley, E. F., Rogers, D. P., Edson, J. B., and Young, G. S.: Bulk parameterization of air-sea fluxes for Trop-ical Ocean-Global Atmospheric Coupled Ocean-Atmospheric Response Experiment, J. Geophys. Res., 101, 3747–3764, 1996. Firestone, J. K. and Albrecht, B. A.: The structure of the Atmo-spheric Boundary layer in the central equatorial Pacific during January and February of FGGE, Mon. Wea. Rev., 114, 2219– 2231, 1986.
Garratt, J. R.: The Atmospheric Boundary Layer, Cambridge Uni-versity Press, Cambridge, 316, 1992.
Halpern, D.: Visiting TOGA’s past, Bull Amer. Meteorol. Soc., 77(2), 233–242, 1996.
Hastenrath, S.: Climate dynamics of the tropics, Kluwar Acad. Nor-well. Mess, 486, 1991.
Holland, J. Z. and Rasmusson, E.: Measurements of the atmo-spheric mass energy and momentum budget over a 500 kilometer square of tropical ocean, Mon. Wea. Rev., 101, 44–55, 1973. Houze, R. A. and Betts, A. K.: Convection in GATE, Rev. Geophys.
Space Phys., 19, 541–576, 1981.
Jayaraman, A., Lubin, D., Ramachandran, S., Ramanathan, V., Woodbridge, E., Collins, W. D., and Zalpuri, K. S.: Direct ob-servations of aerosol radiative forcing over the tropical Indian Ocean during Jan-Feb 1996 Pre-INDOEX cruise, J. Geophys. Res., 103(D12), 13 827–13 836, 1998.
Jayaraman, A.: Results on direct radiative forcing of aerosols ob-tained over the tropical Indian Ocean, Curr. Sci., 76, 924–930,
1999.
Jayaraman, A., Satheesh, S. K., Mitra, A. P., and Ramanathan, V.: Latitude gradient in aerosol properties across the Inter Tropi-cal Convergence Zone: Results from the joint Indo-US study on board Sagar Kanya, Curr. Sci., 80, 128–137, 2001.
Johnson, R. H., Bresch, J. F., Ciesielski, P. E., and Gallus, W. A.: The TOGA/COARE atmospheric sounding array: Its per-formance and preliminary scientific results, 20th Conf. on Hur-ricanes and Tropical Meteorology, San Antonio, Amer. Meteor. Soc., 1–4, 1993.
Katsaros, K. B., Smith, S. D., and Oost, W. A.: HEXOS-Humidity Exchange over the Sea, A program for research on water vapour and droplet fluxes from sea to air at moderate and high wind speeds, Bull. Amer. Meteor. Soc., 68, 466–476, 1987.
Kloesel, K. A. and Albrecht, B. A.: Low-level inversion over the tropical Pacific – thermodynamic structure of the boundary layer and above inversion moisture structure, Mon. Wea. Rev., 117, 87–101, 1989.
Kondo, J.: Air-Sea Bulk transfer coefficients in Diabatic conditions, Boundary-Layer Meteorol., 9, 91–112, 1975.
Krishnamurti, T. N., Jha, B., Prospero, J., Jayaraman, A., and Ra-manathan, V.: Aerosol and pollution transport and their impact on radiative forcing over the tropical Indian Ocean during the January–February 1996 pre-INDOEX cruise, Tellus, Ser. B., 50, 521–542, 1998.
Lelieveld, J., Crutzen, P. J., Ramanathan, V., Andreae, M. O., Bren-ninkmeijer, A. M., Campos, T., Cass, G. R., Dickerson, R. R., Fischer, H., de Gouw, J. A., Hansel, A., Jefferson, A., Kley, D., de Laat, A. T. J., Lal, A., Lawrence, M. G., Lobert J. M., Mayol-Bracero, O. L., Mitra, A. P., Novakov, T., Oltmans, S. J., Prather, K. A., Reiner, T., Rodhe, H., Scheeren, H. A., Sikka, D., and Williams, J.: The Indian Ocean Experiment: Widespread air pol-lution from south and southeast Asia, Science, 291, 1031–1036, 2001.
Mitra, A. P.: INDOEX (India): Introductory note, Current Sci., 76, 886–889, 1999.
Mitsuta, Y.: Collected scientific papers of the AMTEX, Japanese National Committee for GARP and Disaster Prevention Research Inst., Kyoto Univ., No.1, No.2; No.3; No.4, 1977–1979. Moorthy, K. K. and Saha, A: Aerosol study during INDOEX:
Ob-servation of enhanced aerosol activity over the Mid Arabian Sea during the northern winter, J. Atmos. Sol. Terr. Phy., 62, 65–72, 2000.
Muller, D., Wagner, F., Althausen, D., Wandinger, and Ansmann, A.: Physical properties of the Indian aerosol plume derived from six-wavelength lidar observations on 25 March 1999 of the In-dian Ocean Experiment, Geophys. Res. Lett., 27, 1403–1406, 2000.
Muller, D., Franke, K., Wagner, F., Althausen, D., Ansmann, A., and Heintzenberg, J.: Vertical profiling of optical and physi-cal particle properties over the tropiphysi-cal Indian Ocean with six-wavelength lidar, 1, seasonal cycle, J. Geophys. Res., 106, 28 567–28 575, 2001a.
Muller, D., Franke, K., Wagner, F., Althausen, D., Ansmann, A., Heintzenberg, J., and Verver, G.: Vertical profiling of optical and physical particle properties over the tropical Indian Ocean with six-wavelength lidar, 2, case study, J. Geophys. Res., 106, 28 577–28 595, 2001b.
Nicholls, S.: Aircraft observations of the Ekman layer during the Joint Air-Sea Interaction Experiment, Quart. J. Roy. Meteor. Soc., 111, 391–426, 1985.
Heyms-field, A., Kiehl, J., Kley, D., Krishnamurti, T. N., Kuettner, J., Lelieveld, J., Mitra, A. P., Prospero, J., Sadourny, R., Valero, F. P. J., and Woodfridge, E. L.: Indian Ocean Experiment (IN-DOEX) white paper, C4 , Scripps Institution of Oceanography, UCSD, La Jolla, California, 1995.
Ramanathan, V. and Ramana, M. V.: Atmospheric Brown Clouds: Long-Range transport and climate impacts, EM, December, 28– 33, 2003.
Ramana, M. V., Praveena, K., Nair, S. M., and Kunhikrishnan, P. K.: Experimental observations of Air-Sea Parameters and Fluxes as-sociated with anomalous event in the Indian Ocean during 1997-98 El Ni˜no period, Atmos. Res.,70, 21–32, 2004.
Rolph, G. D.: Real-time Environmental Applications and Dis-play sYstem (READY) website (http://www.arl.noaa.gov/ready/ hysplit4.html), NOAA Air Resources Laboratory, Silver Spring, MD, 2003.
Schubert, W. H., Ciesielski, P. E., Lu, C., and Johnson, R. H.: Dy-namical adjustment of the trade wind inversion, J. Atmos. Sci., 52, 2941–2952, 1995.
Shaw, W. A. and Businger, J. A.: Intermittency and the organization of turbulence in the Near-Neutral Marine Atmospheric Boundary Layer, J. Atmos. Sci., 42, 2563–2584, 1985.
Smith, S. D., Anderson, R. J., Oost, W. A., Kraan, C., Maat, N., de-Cosmo, J., Katsaros, K. B., Davidson, K. L., Bumke, K., Hasse, L., and Chadwick, H. M.: Sea Surface wind stress and Drag Co-efficients: The HEXOS results, Boundary-Layer Meteorol., 60, 109–142, 1992.
Stull, R. B.: An introduction to Boundary Layer Meteorology, Kluwer Academic Publishers, The Netherlands, 666, 1988. Webster, P. J., Moore, A. M., Loschnigg, J. P., and Leben, R. R.:
Coupled ocean-atmosphere dynamics in the Indian Ocean during 1997-98, Nature, 401, 356–360, 1999.
Webster, P. J. and Lukas, R.: TOGA-COARE: The Coupled Ocean Atmospheric Response Experiment, Bull. Amer. Meteorol. Soc., 73, 1377–1416, 1992.
Young, G. S., Ledvina, D. R., and Fairall, C. W.: Influence of pre-cipitating convection on the surface energy budget observed dur-ing a Tropical Ocean Global Atmospheric pilot cruise in the trop-ical western Pacific Ocean, J. Geophys. Res., 97, 9595–9603, 1992.