ACPD
15, 30757–30791, 2015CCN Caribbean
T. B. Kristensen et al.
Title Page
Abstract Introduction
Conclusions References
Tables Figures
◭ ◮
◭ ◮
Back Close
Full Screen / Esc
Printer-friendly Version Interactive Discussion
Discussion
P
a
per
|
Discussion
P
a
per
|
Discussion
P
a
per
|
Discussion
P
a
per
|
Atmos. Chem. Phys. Discuss., 15, 30757–30791, 2015 www.atmos-chem-phys-discuss.net/15/30757/2015/ doi:10.5194/acpd-15-30757-2015
© Author(s) 2015. CC Attribution 3.0 License.
This discussion paper is/has been under review for the journal Atmospheric Chemistry and Physics (ACP). Please refer to the corresponding final paper in ACP if available.
Properties of cloud condensation nuclei
(CCN) in the trade wind marine boundary
layer of the Eastern Caribbean Sea
T. B. Kristensen1, T. Müller1, K. Kandler2, N. Benker2, M. Hartmann2, J. M. Prospero3, A. Wiedensohler1, and F. Stratmann1
1
Leibniz Institute for Tropospheric Research, 04318 Leipzig, Germany
2
Environmental Mineralogy, Institute of Applied Geosciences, Technische Universität Darmstadt, 64287 Darmstadt, Germany
3
Rosenstiel School of Marine and Atmospheric Science, University of Miami, Miami, FL, USA
Received: 5 October 2015 – Accepted: 15 October 2015 – Published: 5 November 2015 Correspondence to: T. B. Kristensen ([email protected])
ACPD
15, 30757–30791, 2015CCN Caribbean
T. B. Kristensen et al.
Title Page
Abstract Introduction
Conclusions References
Tables Figures
◭ ◮
◭ ◮
Back Close
Full Screen / Esc
Printer-friendly Version Interactive Discussion
Discussion
P
a
per
|
Discussion
P
a
per
|
Discussion
P
a
per
|
Discussion
P
a
per
|
Abstract
Cloud optical properties in the trade winds over the Eastern Caribbean Sea have been shown to be sensitive to cloud condensation nuclei (CCN) concentrations. The objec-tive of the current study was to investigate the CCN properties in the marine boundary layer (MBL) in the Eastern Caribbean, in order to assess the respective roles of organic
5
species, long-range transported mineral dust, and sea salt particles.
Measurements were carried out in June–July 2013, on the East Coast of Barbados and included CCN number concentrations, particle number size distributions, as well as off-line analysis of sampled particulate matter (PM) and sampled accumulation mode particles for an investigation of composition and mixing state with transmission electron
10
microscopy (TEM) in combination with energy-dispersive X-ray spectroscopy (EDX). During most of the campaign, significant mass concentrations of long-range trans-ported mineral dust was present in the PM, and influence from local island sources can be ruled out. The CCN and particle number concentrations were similar to what can be expected in pristine marine environments. The hygroscopicity parameterκwas
15
inferred, and values in the range 0.2–0.5 were found during most of the campaign, with similar values for the Aitken and the accumulation mode. The accumulation mode par-ticles studied with TEM were dominated by non-refractory material, and concentrations of mineral dust, sea salt, and soot were too small to influence the CCN properties. It is highly likely that the CCN were dominated by a mixture of sulphate species and organic
20
compounds.
1 Introduction
Clouds play an important role with respect to the radiation budget and thus climate on Earth. The concentration of cloud condensation nuclei (CCN) in the atmosphere influ-ences the optical and physical properties of clouds (Andreae and Rosenfeld, 2008).
25
interac-ACPD
15, 30757–30791, 2015CCN Caribbean
T. B. Kristensen et al.
Title Page
Abstract Introduction
Conclusions References
Tables Figures
◭ ◮
◭ ◮
Back Close
Full Screen / Esc
Printer-friendly Version Interactive Discussion
Discussion
P
a
per
|
Discussion
P
a
per
|
Discussion
P
a
per
|
Discussion
P
a
per
|
tions in the climate system (IPCC, 2013). Global climate is in particular sensitive to aerosol–cloud interactions over the oceans due to the large surface of the oceans and the significant difference in albedo between clouds and the open ocean. There are significant climate-relevant uncertainties related to the CCN budget in the marine envi-ronment (Pierce and Adams, 2006), and in general it is very challenging to incorporate
5
marine boundary layer (MBL) clouds correctly in climate models (Bony and Dufresne, 2005).
Submicrometer aerosol particles in the pristine North Atlantic marine environment are comprised of sea salt as well as sulfate and organic species dominating during pe-riods with high marine biological activity (O’Dowd et al., 2004). With typically relatively
10
low background aerosol particle number concentrations in the pristine MBL the CCN number concentrations may be perturbed significantly e.g. due to long range transport. Mineral dust particles from Northern Africa are transported by the trade winds across the Atlantic Ocean particularly during the summer season in the Northern Hemisphere (Prospero and Lamb, 2003). Twohy et al. (2009) reported that a large fraction (79 %)
15
of cloud droplet residual particles were comprised of crustal material in the Eastern Northern Atlantic. Jung et al. (2013) reported a hygroscopicity parameter,κ value of 0.02–0.03 for the accumulation mode particles at different altitudes including the MBL, east of Barbados during a pronounced mineral dust episode. Such lowκvalues close to 0.01 as for pure dust (Garimella et al., 2014; Petters and Kreidenweis, 2007) are
20
indicative of an accumulation mode dominated by dust with only minor amounts of hy-groscopic particulate matter (PM) present. Hence, mineral dust particles may play an important role as CCN under certain conditions over the North Atlantic.
Continuous measurements related to aerosol particle properties have been carried out on the east coast of Barbados since the mid 1960s (Prospero and Lamb, 2003).
25
Upwind from the east coast of Barbados there is typically∼4000 km of Atlantic Ocean
ACPD
15, 30757–30791, 2015CCN Caribbean
T. B. Kristensen et al.
Title Page
Abstract Introduction
Conclusions References
Tables Figures
◭ ◮
◭ ◮
Back Close
Full Screen / Esc
Printer-friendly Version Interactive Discussion
Discussion
P
a
per
|
Discussion
P
a
per
|
Discussion
P
a
per
|
Discussion
P
a
per
|
sampled on the East coast of Barbados from the periods 1984–1987 and 1988–1991 respectively. Savoie et al. (1989) reported high correlations between the concentrations of non-sea-salt (nss) NO−3, nss SO24−, and mineral dust which they ascribed to similar transport pathways of the mineral dust and the investigated water soluble nss inorganic species. Furthermore, they reported a minimum in the NO−3 to SO24− ratio in summer
5
and suggested that Europe was likely to be the source region of those species dur-ing the summer season. Savoie et al. (2002) reported that biogenic marine nss SO24− reaches maximum concentrations around May–June and comprises about 50 % of total nss SO24−on a yearly average. Li-Jones and Prospero (1998) sampled size segregated PM at the same site during April 1994, and they found that nss SO24−dominated the PM
10
with aerodynamic diameters smaller than 0.6 µm, while the supermicron PM primarily was comprised of mineral dust, sea salt, nss NO−3, and smaller amounts of nss SO24−.
In addition to dust and water soluble salts, aerosol particles relevant as CCN over the Caribbean Sea may also contain organic compounds. A number of studies with focus on organic PM have been conducted primarily on or in the vicinity of Puerto
15
Rico, and they are reviewed and summarised by Allan et al. (2008). In short, past studies indicate that there is a significant fraction of organic matter in PM with diameters
<0.6 µm (Novakov et al., 1997), the organic species are hygroscopic (Maria et al., 2002) and efficient as CCN (Novakov and Penner, 1993; Novakov et al., 1997). Mayol-Bracero et al. (2001) attributed significant amounts of the organic matter to natural
20
oceanic sources. In contrast to most previous studies Allan et al. (2008) reported low concentrations of organic matter mostly attributed to local anthropogenic emissions. The optical properties of trade wind cumuli clouds over the Eastern Caribbean Sea are susceptible to increased levels of CCN and direct evidence for the Twomey effect has clearly been observed (Werner et al., 2014). The strong insolation at low latitudes and
25
the remote location makes Barbados an ideal location for studying climate effects of long range transported CCN in the marine environment.
ACPD
15, 30757–30791, 2015CCN Caribbean
T. B. Kristensen et al.
Title Page
Abstract Introduction
Conclusions References
Tables Figures
◭ ◮
◭ ◮
Back Close
Full Screen / Esc
Printer-friendly Version Interactive Discussion
Discussion
P
a
per
|
Discussion
P
a
per
|
Discussion
P
a
per
|
Discussion
P
a
per
|
evident what the dominant CCN properties are in that region. The objective of the cur-rent study is to investigate to what extent organic species, nss inorganic species, sea salt, and long-range transported Saharan mineral dust may influence the CCN prop-erties in that region. The CCN activity was inferred from CCN concentrations in con-junction with particle number size distribution measurements. Particles in the dominant
5
CCN size range were also investigated with transmission electron microscopy (TEM) combined with energy-dispersive X-ray spectroscopy (EDX), in order to identify refrac-tory PM such as sea salt and mineral dust, and for estimation of the volume fractions of different types of PM. The present study was carried out on Barbados as part of the Saharan Aerosol Long-range Transport and Aerosol-Cloud-Interaction Experiment
10
(SALTRACE) campaign during June–July 2013.
2 Theory
The equilibrium saturation ratio of water vapour over an aqueous solution droplet can be described by the the Köhler equation. Petters and Kreidenweis (2007) introduced the hygroscopicity parameterκ and formulated the Köhler equation as:
15
SS [100 %] =
Dd3−Dp3
D3d−D3p(1−κ)exp
4σM
w RT ρwDd
−1 (1)
where SS is the supersaturation in %,Mwis the molar mass of water,ρwis the density of water,σ is the surface tension, R=8.314 J (K mol)−1is the universal gas constant,
T is the absolute temperature,Dp and Dd are the dry particle and droplet diameters respectively. The hygroscopicity parameterκ ranges from about 0 for nonhygroscopic
20
ACPD
15, 30757–30791, 2015CCN Caribbean
T. B. Kristensen et al.
Title Page
Abstract Introduction
Conclusions References
Tables Figures
◭ ◮
◭ ◮
Back Close
Full Screen / Esc
Printer-friendly Version Interactive Discussion
Discussion
P
a
per
|
Discussion
P
a
per
|
Discussion
P
a
per
|
Discussion
P
a
per
|
addition of theκvalues of the pure compounds:
κadd=
X
εiκi (2)
whereκi is theκ value of the speciesi andεi is the volume fraction of speciesi in the dry particles.
3 Experimental
5
The main part of the SALTRACE campaign was carried out from mid-June to mid-July, 2013 and involved a number of different atmospheric measurements mostly based on Barbados. The aim of the campaign was to investigate properties of Saharan min-eral dust transported across the North Atlantic to the Caribbean Sea. The campaign included airborne measurements west of Africa as well as in the vicinity of
Barba-10
dos. A pronounced Saharan mineral dust layer was present at altitudes of 2-4 km over Barbados almost during the entire campaign (Groß et al., 2015). The ground based aerosol measurements included in the present study were carried out at Ragged Point (13◦09′54′′N, 59◦25′56′′W) on the East Coast of Barbados. Studies of long range transported aerosol particles have been carried out on the east coast of Barbados
15
since the mid-1960s and at Ragged Point since the early 1970s (Prospero and Lamb, 2003).
For the in-situ measurements, the ambient aerosol was sampled through a PM10 in-let located∼50 m a.s.l. at the top of a 17 m high tower located on the edge of a 30 m
high rocky promontory adjacent to the ocean. The flow rate was 16 L min−1inside a 3/4
20
inch stainless steel tube leading down to the ground level where different instruments were connected. Among the instruments were an Aerodynamic Particle Sizer (APS-3321, TSI), a mobility particle size spectrometer (MPSS, TROPOS-REF-3) (Wieden-sohler et al., 2012) measuring the particle number size distributions in parallel with a condensation particle counter (CPC-3010, TSI) determining the total particle number
ACPD
15, 30757–30791, 2015CCN Caribbean
T. B. Kristensen et al.
Title Page
Abstract Introduction
Conclusions References
Tables Figures
◭ ◮
◭ ◮
Back Close
Full Screen / Esc
Printer-friendly Version Interactive Discussion
Discussion
P
a
per
|
Discussion
P
a
per
|
Discussion
P
a
per
|
Discussion
P
a
per
|
concentration, and a CCN counter (CCNC) from Droplet Measurement Technologies, USA (Roberts and Nenes, 2005), measuring the total number concentration of CCN at different supersaturations in the range from 0.1 to 0.7 %. These instruments (except for the APS) were all located inside an air conditioned container with the temperature kept constant at∼25◦C. The sample aerosol was dried to.40 % with a Nafionrdryer
5
inside the container before being investigated. Particle number size distributions were obtained for every ∼14 min. The supersaturation settings of the CCNC changed
ev-ery 10–15 min – in order to allow for the supersaturations to stabilise and still ensure a significant overlap in time with a measured particle number size distribution.
Samples for off-line analysis were collected at the top of the tower. A high volume
10
sampler was used to sample total PM on 20 cm×25 cm Whatman 41 filters with a flow
rate of ∼1 m3 for analysis of the mineral dust concentration. A daily resolution was obtained and sampling typically started around 10:00 UTC. In order to minimize im-pacts from local sources sampling was controlled by a wind sensor and only carried out when the local wind direction was in the range 335◦through North to 130◦, and the
15
wind speed exceeded 1 m s−1. A quarter of each filter was rinsed with pure water and placed in a muffle furnace for 14 h at 500◦C. The mass of mineral dust was estimated from multiplying the mass of the remaining ash by 1.3. More details about the sampling sector and the procedure for inferring the mineral dust concentration are available in the literature (Prospero et al., 2005; Trapp et al., 2010).
20
Samples for TEM analysis were also collected at the top of the tower with a minia-ture cascade impactor (Kandler et al., 2007) on TEM Ni-grids coated with a formvar carbon film (FCF200F1-Ni, Science Services, Munich, Germany). The nominal cut-off aerodynamic diameters for the stages analysed in the present work are 530 nm (up-per) and 90 nm (lower) during the period from 15 to 21 June 2015, and 330 nm (up(up-per)
25
ACPD
15, 30757–30791, 2015CCN Caribbean
T. B. Kristensen et al.
Title Page
Abstract Introduction
Conclusions References
Tables Figures
◭ ◮
◭ ◮
Back Close
Full Screen / Esc
Printer-friendly Version Interactive Discussion
Discussion
P
a
per
|
Discussion
P
a
per
|
Discussion
P
a
per
|
Discussion
P
a
per
|
range from 50 to 300 nm an aspiration bias is negligible. The samples were stored in a drying cabinet (silica gel) at ambient temperature.
Meteorological measurements were carried out at the top of the tower and included measurements of wind speed, wind direction, precipitation, temperature and humidity.
4 Data analysis
5
4.1 Cloud condensation nuclei and particle number size distributions
For an estimation of the CCN activity, the average CCN number concentration was compared to the simultaneously measured particle number size distribution in order to estimate a critical diameter (Dc) above which all particles activate into cloud droplets for a given supersaturation. The critical mobility diameter is inferred by integrating the
10
particle number size distribution from the largest particle diameter and downwards until a particle number concentration equal to the CCN concentration is obtained (e.g. Ju-rányi et al., 2010). This approach relies on the fact that the dry particle size is a very important parameter for whether a particle will activate into a cloud droplet (as given in Eq. 1).
15
In order to obtain a best estimate of and the error on the critical diameter, the inte-grations were carried out for 10 000 Monte Carlo simulations, for which the errors on the CCN number concentration and the MPSS number concentrations in different size channels were taken into account. The relative random error on the CCN number con-centration corresponding to one standard deviation was assumed to be represented
20
by the inverse of the square root of the total CCN counts during a given time inter-val. The relative random error on the MPSS derived particle number concentration in a given size channel corresponding to one standard deviation was assumed to be rep-resented by 5 %. It was found to be a reasonable estimate of the random error from intercomparisons of neighbouring MPSS particle number size distributions during time
25
ACPD
15, 30757–30791, 2015CCN Caribbean
T. B. Kristensen et al.
Title Page
Abstract Introduction
Conclusions References
Tables Figures
◭ ◮
◭ ◮
Back Close
Full Screen / Esc
Printer-friendly Version Interactive Discussion
Discussion
P
a
per
|
Discussion
P
a
per
|
Discussion
P
a
per
|
Discussion
P
a
per
|
CCNC in the laboratory prior to and after the campaign clearly showed some system-atic losses of ultrafine particles increasing linearly with decreasing particle diameters below ∼80 nm. This effect is likely to be due to diffusional losses inside the CCNC (Rose et al., 2008). These losses were assumed to be the same in the field as in the laboratory, and this effect was accounted for in the data analysis when inferring the
5
critical diameter.
The inferred probability density functions of the critical diameters were generally found to be well represented by Gaussian distributions.
Based on the supersaturation and the inferred critical diameter the hygroscopicity parameterκ was calculated (Petters and Kreidenweis, 2007). The error on the CCNC
10
supersaturation is estimated based on the variation among numerous calibrations car-ried out in the laboratories at the Leibniz Institute for Tropospheric Research (Tropos). For SS≥0.2 % the variation in the supersaturation appeared to be represented very
well by a Gaussian distribution with a standard deviation of 0.037 % in relative terms. For SS<0.2 % an absolute value of 0.03 % SS represented one standard deviation.
15
Rose et al. (2008) reported lower variations in the SS under controlled laboratory con-ditions (∼1 %) and larger relative errors while operating in the field (∼5 %) mainly due
to temperature variations.
The probability density functions of the critical diameter and the supersaturation as described above were used as independent input for the calculation of the probability
20
density functions ofκ. The temperature at activation was estimated to be 0.5·(T1+T2) where T1 and T2 are the temperatures at the top and at the midpoint of the CCNC column wall respectively. The temperature enters directly in Eq. (1) and it also enters indirectly through an influence onσ andρwin Eq. (1). A surface tension of pure water was assumed in theκ calculations and a parameterisation ofσ(T) was obtained from
25
results reported in the literature (Cini et al., 1972).
ACPD
15, 30757–30791, 2015CCN Caribbean
T. B. Kristensen et al.
Title Page
Abstract Introduction
Conclusions References
Tables Figures
◭ ◮
◭ ◮
Back Close
Full Screen / Esc
Printer-friendly Version Interactive Discussion
Discussion
P
a
per
|
Discussion
P
a
per
|
Discussion
P
a
per
|
Discussion
P
a
per
|
SS in combination with the size distributions due to a systematic alternation between correct and off-set T3 settings, and it has been taken into account in all the results shown in the present study.
A very good agreement was found between the used MPSS and a reference MPSS before and after the campaign (Wiedensohler et al., 2012). The MPSS sizing was
vali-5
dated in the field at the beginning and at the end of the campaign with mono-disperse polystyrene latex spheres (PSL) with a diameter of 203 nm.
4.2 Transmission electron microscopy (TEM)
The TEM analysis was carried out in order to provide information about the chemical composition of the aerosol particles. TEM grid samples were analysed with a Philips
10
CM 20 (FEI, Eindhoven, the Netherlands) operated at 200 kV accelerating voltage and a LaB6gun. The images were recorded with a CCD camera (KeenView G2, Olympus Soft Imaging Solutions GmbH, Münster, Germany) mounted at the bottom of the elec-tron microscope. The Transmission elecelec-tron microscope is equipped with an energy-dispersive X-ray microanalysis with a Silicon Drift detector (X-Max 80 mm2, Oxford,
15
Oxfordshire, UK). Images were acquired with a resolution of 1.32 pixels per nm. As dur-ing particle analysis, the volatile material of the particle evaporates and the refractory fraction remains, images were recorded at the beginning of the electron bombardment and after no more visible change in particle structure occurred. An exact temperature under this electron bombardment can not be determined. However, the temperature
20
conditions can be considered to be similar for all measurements, as identical instru-ment settings were used. From a chemical analysis it becomes obvious that nitrate and sulfate evaporated, while sodium chloride, all mineral dust components and soot remain stable (Kandler et al., 2011). From the decomposition behavior and the ab-sence of sodium chloride melting, we can conclude that the temperature is between
25
ACPD
15, 30757–30791, 2015CCN Caribbean
T. B. Kristensen et al.
Title Page
Abstract Introduction
Conclusions References
Tables Figures
◭ ◮
◭ ◮
Back Close
Full Screen / Esc
Printer-friendly Version Interactive Discussion
Discussion
P
a
per
|
Discussion
P
a
per
|
Discussion
P
a
per
|
Discussion
P
a
per
|
1.47c (Rasband, 2015). As the brightness of the images is uneven, instead of an au-tomatic brightness-based segmentation procedure a manual thresholding combined with additional manual particle outlining was required. The volume fraction of refrac-tory material inside each particle was estimated as the ratio of the projected area after evaporation to the projected area before evaporation, raised to the power of 1.5.
5
5 Results
5.1 Local airmass characteristics
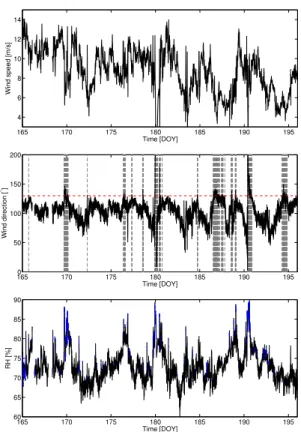
Locally measured wind speed, wind direction, relative humidity (RH) and precipitation are shown in Fig. 1 for the time period from 14 June to 15 July, 2013, corresponding to the day of year (DOY) range from 165 to 196. All times presented in this section are
10
in UTC (corresponding to LT+4 h). The wind speed shown in the top-panel of Fig. 1 ranged from∼2 to ∼15 m s−1 with an average value of 8.8 m s−1. The wind direction
was dominated by easterly winds (Fig. 1-mid-panel). With wind directions in the range from 335◦through North to 130◦ only the open ocean is upwind from the field station. The 130◦ wind direction level is indicated in the mid-panel of Fig. 1, and time periods
15
where the wind direction is in the range from 130 to 360◦ are indicated with a grey background. For>95 % of the time the wind direction was in the range from 0 to 130◦. Only one time during the campaign a small vessel was noticed within eyesight of the measurement station. This indicates that local and land-based emissions are unlikely to influence our observations during most of the campaign. The local ambient
tempera-20
ture was on average 26.0◦C with diurnal variations typically being<1◦C. The ambient RH ranged from∼65 to ∼85 % during most of the campaign (Fig. 1 – lower panel). Elevated levels of RH were typically associated with time periods with precipitation – which are indicated with blue in the lower panel in Fig. 1. Intense showers lasting for short time periods (often<1 h) occurred frequently during the campaign.
ACPD
15, 30757–30791, 2015CCN Caribbean
T. B. Kristensen et al.
Title Page
Abstract Introduction
Conclusions References
Tables Figures
◭ ◮
◭ ◮
Back Close
Full Screen / Esc
Printer-friendly Version Interactive Discussion
Discussion
P
a
per
|
Discussion
P
a
per
|
Discussion
P
a
per
|
Discussion
P
a
per
|
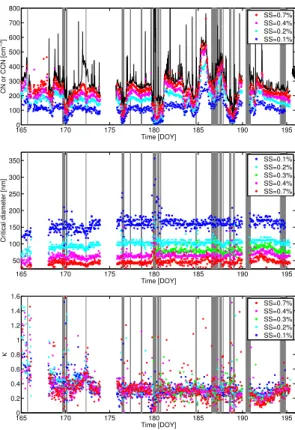
5.2 Particle number size distributions, CCN concentrations and CCN activity
The measured particle number size distributions (not corrected for losses in sampling lines and detection efficiency) are shown in Fig. 2. In the top panel of Fig. 2 the time series of the particle number size distributions are shown, and in the lower panel the median particle number size distribution and the median volume particle size
distribu-5
tion over the whole campaign are shown. The size range of mobility particle diameters from 0.01 to 0.8 µm is covered by MPSS data merged with APS measurements for vol-ume equivalent diameters above 0.8 µm. The gaps in the data in the top panel are due to lack of measurements.
During most of the campaign the typical marine particle number size distribution with
10
two submicrometer modes can be observed: an Aitken mode with a maximum close to 50 nm and an accumulation mode with a maximum close to 180 nm (Heintzenberg et al., 2004). A Hoppel minimum is typically observed around a mobility diameter of 80 nm. The average critical diameters (more details given below) are also indicated in the figure and it is evident that for the lowest supersaturations (0.1–0.3 %) information
15
about the accumulation mode is typically provided, while information about the Aitken mode is provided for higher supersaturations. It is also clear from the median particle number size distribution that very low number concentrations are present in the super-micrometer range. The median particle volume size distribution inferred from assuming spherical particles is shown in the lower panel to the right in Fig. 2. The volume size
20
distribution is dominated by particles larger than∼0.5 µm, with a maximum generally reached at 2 µm followed by an abrupt decrease for larger particle diameters. The abrupt decrease is most likely due to losses of coarse mode particles in the sampling lines. The correction for losses of coarse particles in the sampling lines is uncertain, and have thus not been carried out. The total particle number concentration is typically
25
ACPD
15, 30757–30791, 2015CCN Caribbean
T. B. Kristensen et al.
Title Page
Abstract Introduction
Conclusions References
Tables Figures
◭ ◮
◭ ◮
Back Close
Full Screen / Esc
Printer-friendly Version Interactive Discussion
Discussion
P
a
per
|
Discussion
P
a
per
|
Discussion
P
a
per
|
Discussion
P
a
per
|
lower end of the typical concentrations of 300–600 cm−3 found in the MBL (O’Dowd and de Leeuw, 2007).
The measured number concentrations of CCN vs. time are shown in the upper panel of Fig. 3. The CCN number concentrations stay rather constant throughout the cam-paign with a few exceptions with remarkably reduced concentrations and one episode
5
with elevated concentrations around the DOY=185.5 (4 July). The time periods with low CCN concentrations are associated with higher RH than average and also more precipitation than average as can be seen from the lower panel of Fig. 1. The median CCN number concentrations are included in Table 1 and range from∼80 cm−3for an
SS=0.1 % to ∼240 cm−3 for an SS=0.7 %. Those CCN number concentrations are
10
comparable to what has been observed over the western North Pacific (Mochida et al., 2011), and over the North Atlantic for clean marine conditions (Reade et al., 2006), but often higher concentrations of CCN are observed in the MBL (Good et al., 2010; Jefferson, 2010; Sorooshian et al., 2009).
The critical diameters inferred as described above in Sect. 4.1 are shown in the
15
mid-panel of Fig. 3. The calculated random errors are not shown in the figure. For the SS=0.1 % the random errors corresponding to one standard deviation are in the range from∼2 to∼10 nm, while for higher SS the similar errors are in the range from∼1 to ∼5 nm with decreasing average values with increasing SS. The average random errors on the critical diameter (δDc) are included in Table 1. The critical diameters are slightly
20
lower during the first days of measurements, but they appear to stay fairly constant throughout most of the campaign. For an SS=0.1 % theDc stays above 100 nm, and for an SS=0.2 % theDc is typically slightly above the Hoppel minimum so those data provide information about the accumulation mode CCN activity, while for higher SS information about the Aitken mode CCN activity is obtained.
25
The calculated κ values vs. time are shown in the lower panel of Fig. 3. The κ
ACPD
15, 30757–30791, 2015CCN Caribbean
T. B. Kristensen et al.
Title Page
Abstract Introduction
Conclusions References
Tables Figures
◭ ◮
◭ ◮
Back Close
Full Screen / Esc
Printer-friendly Version Interactive Discussion
Discussion
P
a
per
|
Discussion
P
a
per
|
Discussion
P
a
per
|
Discussion
P
a
per
|
a Gaussian distribution in the range of ±1 standard deviation relative to the median κ value. The random errors on κ representing one standard deviation (δκ) were on average 0.05 and increasing slightly with the supersaturation. The averageδκvalues are included in Table 1. During the first day of measurements (DOY=165, 14 June), theκ values are typically around or above ∼0.6. In the time period from 168.0–173.0
5
DOY (17–21 June) most of theκvalues are typically in the range from 0.3 to 0.5. During the last 22 days of measurements (22 June to 14 July) most of theκ values are found in the range from 0.2 to 0.4.
The higherκ values above 0.6 during the first day is likely to be at least partly due to sea salt since most other species present in ambient aerosol haveκ values close to
10
or below 0.6 (Petters and Kreidenweis, 2007; Petters et al., 2009). The observations of elevatedκvalues coincide with the highest local wind speeds (∼14 m s−1) observed during the campaign. It fits with the expectation of the flux of sea spray particles de-pending highly on the wind speed (Monahan and Muircheartaigh, 1980; O’Dowd and de Leeuw, 2007).
15
The κ values inferred here are lower than the values of 0.6±0.2 for Puerto Rico
and 0.87±0.24 for Antigua reported by Pringle et al. (2010) based on the
measure-ments presented by Allan et al. (2008) and Hudson (2007) respectively. Theκ values from the first day of our measurements is comparable to the other literature values for the Carribean. It is worth noting that the previous measurements were carried out in
20
December and January respectively and it is likely that the chemical PM composition changes with the seasons (Savoie et al., 1989).
5.3 Mineral dust concentration
The daily total mass concentrations of mineral dust during the campaign are depicted as bars in Fig. 4 together with the estimated total mass concentration (PMest) based on
25
ACPD
15, 30757–30791, 2015CCN Caribbean
T. B. Kristensen et al.
Title Page
Abstract Introduction
Conclusions References
Tables Figures
◭ ◮
◭ ◮
Back Close
Full Screen / Esc
Printer-friendly Version Interactive Discussion
Discussion
P
a
per
|
Discussion
P
a
per
|
Discussion
P
a
per
|
Discussion
P
a
per
|
dust concentrations are based on sampling for∼24 h, and all the shown dust
concen-trations are based on>12 h of sampling – depending on the local wind direction. The average mineral dust concentration during the campaign is ∼19 µg m−3, with notice-able variations on a daily scale. The maximum of the daily mineral dust concentration of ∼80 µg m−3 was observed for 11–12 July (DOY=192.4–193.4), which is a high
5
concentration for this site. Only occasionally the daily average mineral dust mass con-centration exceeds 100 µg m−3(Savoie and Prospero, 1977; Savoie et al., 1987; Jung et al., 2013). A strong yearly cycle of the mineral dust concentration is present in this region with maximum concentrations in June–July (Prospero and Lamb, 2003), and significant (occasionally high) concentrations of dust were indeed present in the MBL
10
during almost the entire campaign.
The mass concentrations estimated from the integrated volume size distributions shown in Fig. 4 are based on the assumptions of spherical particles and a particle density of 2.6 g cm−3 as for mineral dust (Bergametti and Forêt, 2014). The estimated total mass concentrations are likely to be biased low due to losses in the sampling
15
tube and inlet, but it may also result in higher concentrations than for pure dust due to non-dust particles such as e.g. sea salt. However, there is a very significant linear correlation between the two data series depicted in Fig. 4 with a correlation coefficient ofr=0.85 for the 30 days where data was available. From Fig. 4 it can also be seen that the magnitude of the two mass concentrations are comparable typically within a factor
20
of 2. These observations indicate that the coarse particles dominating the volume size distribution (Fig. 2) primarily are comprised of mineral dust. Hence, the estimated total mass concentrations inferred from the measured particle number size distributions can be used as a proxy of the mineral dust concentration with a higher time resolution. Thus, it can be determined whether high or low dust concentrations could be expected
25
ACPD
15, 30757–30791, 2015CCN Caribbean
T. B. Kristensen et al.
Title Page
Abstract Introduction
Conclusions References
Tables Figures
◭ ◮
◭ ◮
Back Close
Full Screen / Esc
Printer-friendly Version Interactive Discussion
Discussion
P
a
per
|
Discussion
P
a
per
|
Discussion
P
a
per
|
Discussion
P
a
per
|
5.4 Transmission electron microscopy (TEM)
Samples were collected on eight different days, where the mineral mass dust concen-tration was close to or above the average for seven out of the eight samples, based on the data presented in Fig. 4. Details about the sampling times of the samples are provided in Table 2. By use of TEM in combination with EDX information about the
5
respective volume fractions of non-refractory and refractory particulate matter and in-formation about the chemical composition of the latter was obtained. Thus, the TEM data provides a strong basis for interpretation of the CCN properties presented above. Some examples of images of the studied particles are shown in Fig. 5. The particle shown in Fig. 5I.a is non-refractory and on timescales of seconds it evaporates. As can
10
be observed in Fig. 5I.b, only an indication of a thin layer remains on the spot were the particle used to be. Similar types of particles have also been observed on Cape Verde with the same technique, and the remaining thin layer was suggested to be comprised of refractory organic compounds (Kandler et al., 2011). The remaining thin layer is of-ten observed in the present study. In general, this type of dominantly non-refractory
15
particle with no well-defined refractory substance included were the most abundant type of particle in the investigated samples.
In Fig. 5II, an example of a sea salt particle is shown, and there were no significant amounts of non-refractory material associated with that particle. That was the case for several sea-salt particles, but there are also some examples of sea-salt mixed with
non-20
refractory substances. In Fig. 5III.a, an example of a mostly non-refractory particle with a small amount of soot adhering to it (Fig. 5III.b) is shown. These types of particles were typically dominated by the non-refractory material and with only small volume fractions of soot – either adhering to the surface – or covered completely or partly by non-refractory material.
25
ACPD
15, 30757–30791, 2015CCN Caribbean
T. B. Kristensen et al.
Title Page
Abstract Introduction
Conclusions References
Tables Figures
◭ ◮
◭ ◮
Back Close
Full Screen / Esc
Printer-friendly Version Interactive Discussion
Discussion
P
a
per
|
Discussion
P
a
per
|
Discussion
P
a
per
|
Discussion
P
a
per
|
non-refractory matter. In Fig. 5V.a a partly non-refractory particle is shown – as can be seen when comparing to the image in Fig. 5V.b. The refractory part of the parti-cle shown in Fig. 5V.b contained significant amounts of sodium and potassium, and it may originate from biomass burning. In Fig. 5VI a dust particle is shown. In total 4 out of 871 particles were classified as dust in the investigated size range, and they
5
were not or only very slightly associated with non-refractory PM. TEM was also used to study samples in the super-micron range from the same site and aircraft samples collected at different altitudes in the vicinity of Barbados. Mineral dust typically com-prised a significant fraction the super-micron particulate matter, and at higher altitudes mineral dust also comprised a significant fraction in the sub-micron size range, which
10
will be described in more detail in future publications.
Five samples from 17–21 June, and three samples from 27 June, and 4 and 11 July were studied (Table 2). The data obtained from the first five samples (period 1) and the last three samples (period 2) respectively, were grouped separately and binned according to the their initial PAED and the volume fraction of any refractory material in
15
the range from 0 to 0.3, from 0.3 to 0.9 and>0.9 as shown in Fig. 6a and b respectively. The refractory matter was classified as soot, soot mixtures, mineral dust, sea salt and “other”, where the last category contains all refractory substances not belonging to any of the first mentioned groups. In Fig. 6a and b, sea-salt is shown separately, while all the other refractory substances are grouped together. In Fig. 6c and d the volume
20
fractions of non-refractory substances and all the different refractory particle groups are shown for period 1 and 2 respectively in different size ranges. It is worth noting that all the volume fractions of refractory PM presented here can be considered upper limits since more volatile species may have evaporated from the studied particles before closer inspection, and in many cases the evaporation of non-refractory PM has already
25
started when the first particle image is produced.
ACPD
15, 30757–30791, 2015CCN Caribbean
T. B. Kristensen et al.
Title Page
Abstract Introduction
Conclusions References
Tables Figures
◭ ◮
◭ ◮
Back Close
Full Screen / Esc
Printer-friendly Version Interactive Discussion
Discussion
P
a
per
|
Discussion
P
a
per
|
Discussion
P
a
per
|
Discussion
P
a
per
|
about 30 % for the 431 particles in the second group. Out of the particles comprising refractory material – the majority of those were dominated by non-refractory material with a small volume fraction of refractory material. By number the majority of the small refractory particles were classified as soot. Only about 3 and 2 % respectively of all the investigated particles are comprised of a refractory volume fraction larger than 90 %
5
for the two groups of samples. In the PAED range from 100–200 nm, it is only a small fraction (<10 % by number) of the studied particles that contain any well-defined re-fractory matter, and in most of those cases the rere-fractory matter comprises a small volume fraction of the particles. For the particles larger than∼300 nm, the refractory matter is relatively more abundant both by number fraction and by volume. In the
fol-10
lowing section, it will be discussed how the information presented in this section can be combined with results presented in previous sections in order to infer information about the chemical composition of the studied cloud condensation nuclei.
6 Summary and discussion
It has been shown in the sections above that during most of the campaign influences
15
from local land-based particle sources can be expected to be very limited and thus, the investigated aerosol can be considered as representative for the Eastern Caribbean Sea. The CCN number concentrations and total particle number concentration are rel-atively low – and similar to pristine marine conditions. The particle number size dis-tributions were typically dominated by an accumulation mode with a maximum near
20
∼180 nm. Based on CCN number concentrations and size distributions measured in parallel the critical diameters were inferred and they ranged from ∼50 nm for an
SS=0.7 % to∼150 nm for an SS=0.1 %. The correspondingκ values were typically
found in the range 0.2–0.5 for all supersaturations (0.1–0.7 %) with the exception of the first day of measurements, where it is likely that the influence of sea salt was relatively
25
ACPD
15, 30757–30791, 2015CCN Caribbean
T. B. Kristensen et al.
Title Page
Abstract Introduction
Conclusions References
Tables Figures
◭ ◮
◭ ◮
Back Close
Full Screen / Esc
Printer-friendly Version Interactive Discussion
Discussion
P
a
per
|
Discussion
P
a
per
|
Discussion
P
a
per
|
Discussion
P
a
per
|
collected on eight different days, where significant mass concentration of dust was ob-served, were analysed with TEM. The majority of the investigated particles were found in the accumulation mode, and in general the bulk of the particles were largely domi-nated by non-refractory substances.
Based on the presented results and some basic assumptions it is possible to
esti-5
mate to what extent the minor concentration of refractory particulate matter is likely to influence the inferred CCN activity. It can be expected that significant amounts of the non-refractory PM in the studied size range is sulphate species (Li-Jones and Pros-pero, 1998). Pure ammoniumsulphate and other inorganic sulphate species of atmo-spheric relevance haveκvalues of 0.6 or slightly higher when it comes to cloud droplet
10
activation (κCCN). The κCCN values inferred in the present study are typically below
∼0.4. Some basic modeling using Eq. (2) and the information about the refractory PM volume fractions (Fig. 6) in combination with the particle number size distributions (Fig. 2) clearly indicates that the inferredκ values cannot be explained solely by mix-tures of sulphate species and the refractory PM even whenκ=0 is assumed for all the
15
refractory PM. The influence from the refractory PM is negligible since the estimated volume fraction only exceeds 10 % for particles larger then 300 nm, and (i) as can be observed from Fig. 2 only a small number fraction of the CCN are present in that size range, and (ii) most particles (even with low CCN activity) with diameters larger 300 nm will activate into cloud droplets at supersaturations of 0.1 % or higher. Hence, the
ob-20
served κ values are very likely to reflect a significant organic volume fraction, which is corroborated by the skin-like remainder frequently observed in the TEM evaporation studies.
Most organic species of atmospheric relevance typically haveκCCN values ranging from about∼0 up to∼0.3 (Petters and Kreidenweis, 2007; Petters et al., 2009).
Kris-25
ACPD
15, 30757–30791, 2015CCN Caribbean
T. B. Kristensen et al.
Title Page
Abstract Introduction
Conclusions References
Tables Figures
◭ ◮
◭ ◮
Back Close
Full Screen / Esc
Printer-friendly Version Interactive Discussion
Discussion
P
a
per
|
Discussion
P
a
per
|
Discussion
P
a
per
|
Discussion
P
a
per
|
200 nm could explain the observations, if it it assumed that the remainder of the PM in that size range is dominated by sulphate species. Such a composition is compara-ble to what has been reported for particulate matter with diameters below 0.6 µm on Puerto Rico (Novakov et al., 1997). From the TEM studies it seems highly likely that the aerosol particles (at least in the accumulation mode) are internally mixed, but if an
5
external mixture of sulphate and organic species is assumed, then an organic volume fraction at the order of 25 % could also explain the observedκ values.
For the present study, it should be kept in mind that the TEM samples studied are limited with respect to the number or particles investigated and they also represent a limited period of the entire campaign. Nevertheless, (i) a large fraction of the particles
10
investigated with TEM had indications of organic matter as mentioned above, (ii) it is hard to explain ambientκCCNvalues in the range from 0.2–0.4 without organic species being present – if refractory matter such as soot and dust is likely to comprise a very minor volume fraction, (iii) significant organic fractions have previously been reported for the size range relevant as CCN in the same region (Novakov et al., 1997;
Mayol-15
Bracero et al., 2001; Maria et al., 2002). So there are several independent observations supporting that organic species are likely to play a role for the CCN activity observed in the present study.
Mineral dust was observed over the Caribbean Sea almost during the entire mea-surement period and the airmasses generally originated from Northern Africa (Groß
20
et al., 2015), so it cannot be ruled out that organic species in the gas phase or the par-ticle phase also are transported across the North Atlantic. During the summer season significant amounts of biogenic precursers of secondary organic aerosol are emitted in North Western Africa (Capes et al., 2009), which may contribute to secondary organic aerosol in the trade winds. Biomass burning is also a source of organic PM (and soot),
25
ACPD
15, 30757–30791, 2015CCN Caribbean
T. B. Kristensen et al.
Title Page
Abstract Introduction
Conclusions References
Tables Figures
◭ ◮
◭ ◮
Back Close
Full Screen / Esc
Printer-friendly Version Interactive Discussion
Discussion
P
a
per
|
Discussion
P
a
per
|
Discussion
P
a
per
|
Discussion
P
a
per
|
emissions is the main source of the organic PM in the present study, then it can explain the generally lowκ values observed, also when the airmasses occasionally may not be influenced from continental sources.
The significant differences in CCN properties observed in the present and previ-ous studies (ranging from very low κCCN values and dominance by mineral dust to
5
higher κCCN and dominance of inorganic soluble species) may in part be due to dif-ferent meteorological conditions and seasonal variations in aerosol particle properties e.g. resulting in high/low biological activity and different vertical atmospheric mixing. It is clear that more and longer term studies will be needed in order to fully assess the CCN properties in the region and to identify the respective roles organic species, nss
10
inorganic species, sea salt and mineral dust.
7 Conclusions
Aerosol particles (with a focus on cloud condensation nuclei properties) were investi-gated in the trade wind marine boundary layer in the Eastern Caribbean Sea during the SALTRACE campaign, June–July 2013. Local land-based particle sources could
15
be ruled out for almost the entire campaign, and particle number size distributions and concentrations were representative of pristine marine environments. Significant mass concentrations of mineral dust was present during most of the campaign. The inferred CCN activity could be represented by κ values typically in the range from 0.2–0.5 for both the Aitken and the accumulation mode. Investigations of particle
composi-20
tions with TEM in combination with EDX showed negligible concentrations of mineral dust (<0.5 % by number), and very minor concentrations of sea salt particles (1–2 % by volume) and soot (∼2 % by volume) in the size range of the accumulation mode
dominating the CCN number concentrations. The CCN population was almost entirely comprised by non-refractory particulate matter, and based on previous studies in the
25
frac-ACPD
15, 30757–30791, 2015CCN Caribbean
T. B. Kristensen et al.
Title Page
Abstract Introduction
Conclusions References
Tables Figures
◭ ◮
◭ ◮
Back Close
Full Screen / Esc
Printer-friendly Version Interactive Discussion
Discussion
P
a
per
|
Discussion
P
a
per
|
Discussion
P
a
per
|
Discussion
P
a
per
|
tion of the CCN would depend on theκ value of the organic species – but an organic volume fraction at the order of 50 % is likely.
Acknowledgements. This study was supported by the European FP7 project: “Impact of bio-genic vs. anthropobio-genic emissions on clouds and climate: towards a holistic understanding” (BACCHUS). T. B. Kristensen gratefully acknowledges funding from the German Federal
Min-5
istry of Education and Research (BMBF) project 01LK1222B. K. Kandler and M. Hartmann gratefully acknowledge support from the Deutsche Forschungsgemeinschaft (FOR 1525 INUIT and KA 2280/2).
References
Allan, J. D., Baumgardner, D., Raga, G. B., Mayol-Bracero, O. L., Morales-García, F.,
García-10
García, F., Montero-Martínez, G., Borrmann, S., Schneider, J., Mertes, S., Walter, S., Gy-sel, M., Dusek, U., Frank, G. P., and Krämer, M.: Clouds and aerosols in Puerto Rico – a new evaluation, Atmos. Chem. Phys., 8, 1293–1309, doi:10.5194/acp-8-1293-2008, 2008. 30760, 30770
Andreae, M. O. and Rosenfeld, D.: Aerosol–cloud–precipitation interactions, Part 1.
15
The nature and sources of cloud-active aerosols, Earth Sci. Rev., 89, 13–41, doi:10.1016/j.earscirev.2008.03.001, 2008. 30758
Bergametti, G. and Forêt, G.: Dust deposition, in: Mineral Dust, Springer, the Netherlands, 179–200, doi:10.1007/978-94-017-8978-3, 2014. 30771
Bony, S. and Dufresne, J.-L.: Marine boundary layer clouds at the heart of
tropi-20
cal cloud feedback uncertainties in climate models, Geophys. Res. Lett., 32, L20806, doi:10.1029/2005GL023851, 2005. 30759
Capes, G., Murphy, J. G., Reeves, C. E., McQuaid, J. B., Hamilton, J. F., Hopkins, J. R., Crosier, J., Williams, P. I., and Coe, H.: Secondary organic aerosol from biogenic VOCs over West Africa during AMMA, Atmos. Chem. Phys., 9, 3841–3850,
doi:10.5194/acp-9-3841-25
2009, 2009. 30776
ACPD
15, 30757–30791, 2015CCN Caribbean
T. B. Kristensen et al.
Title Page
Abstract Introduction
Conclusions References
Tables Figures
◭ ◮
◭ ◮
Back Close
Full Screen / Esc
Printer-friendly Version Interactive Discussion
Discussion
P
a
per
|
Discussion
P
a
per
|
Discussion
P
a
per
|
Discussion
P
a
per
|
Garimella, S., Huang, Y.-W., Seewald, J. S., and Cziczo, D. J.: Cloud condensation nucleus ac-tivity comparison of dry- and wet-generated mineral dust aerosol: the significance of soluble material, Atmos. Chem. Phys., 14, 6003–6019, doi:10.5194/acp-14-6003-2014, 2014. 30759 Good, N., Topping, D. O., Allan, J. D., Flynn, M., Fuentes, E., Irwin, M., Williams, P. I., Coe, H., and McFiggans, G.: Consistency between parameterisations of aerosol hygroscopicity and
5
CCN activity during the RHaMBLe discovery cruise, Atmos. Chem. Phys., 10, 3189–3203, doi:10.5194/acp-10-3189-2010, 2010. 30769
Groß, S., Freudenthaler, V., Schepanski, K., Toledano, C., Schäfler, A., Ansmann, A., and Weinzierl, B.: Optical properties of long-range transported Saharan dust over Barbados as measured by dual-wavelength depolarization Raman lidar measurements, Atmos. Chem.
10
Phys., 15, 11067–11080, doi:10.5194/acp-15-11067-2015, 2015. 30762, 30776
Heintzenberg, J., Birmili, W., Wiedensohler, A., Nowak, A., and Tuch, T.: Structure, variability and persistence of the submicrometre marine aerosol, Tellus B, 56, 357–367, 2004. 30768 Hudson, J. G.: Variability of the relationship between particle size and cloud-nucleating ability,
Geophys. Res. Lett., 34, L08801, doi:10.1029/2006GL028850, 2007. 30770
15
IPCC: Climate Change: The Assessment Reports of the Intergovernmental Panel on Climate Change, Cambridge University Press, Cambridge, UK, 2013. 30759
Jefferson, A.: Empirical estimates of CCN from aerosol optical properties at four remote sites, Atmos. Chem. Phys., 10, 6855–6861, doi:10.5194/acp-10-6855-2010, 2010. 30769
Jung, E., Albrecht, B., Prospero, J. M., Jonsson, H. H., and Kreidenweis, S. M.: Vertical
struc-20
ture of aerosols, temperature, and moisture associated with an intense African dust event observed over the eastern Caribbean, J. Geophys. Res.-Atmos., 118, 4623–4643, 2013. 30759, 30771
Jurányi, Z., Gysel, M., Weingartner, E., DeCarlo, P. F., Kammermann, L., and Baltensperger, U.: Measured and modelled cloud condensation nuclei number concentration at the high alpine
25
site Jungfraujoch, Atmos. Chem. Phys., 10, 7891–7906, doi:10.5194/acp-10-7891-2010, 2010. 30764
Kandler, K., Benker, N., Bundke, U., Cuevas, E., Ebert, M., Knippertz, P., Rodríguez, S., Schütz, L., and Weinbruch, S.: Chemical composition and complex refractive index of Saha-ran mineral dust at Izaña, Tenerife (Spain) derived by electron microscopy, Atmos. Environ.,
30
41, 8058–8074, 2007. 30763
par-ACPD
15, 30757–30791, 2015CCN Caribbean
T. B. Kristensen et al.
Title Page
Abstract Introduction
Conclusions References
Tables Figures
◭ ◮
◭ ◮
Back Close
Full Screen / Esc
Printer-friendly Version Interactive Discussion
Discussion
P
a
per
|
Discussion
P
a
per
|
Discussion
P
a
per
|
Discussion
P
a
per
|
ticles collected at Praia, Cape Verde, during the Saharan mineral dust experiment: particle chemistry, shape, mixing state and complex refractive index, Tellus B, 63, 475–496, 2011. 30766, 30772
Kiyoura, R. and Urano, K.: Mechanism, kinetics, and equilibrium of thermal decomposition of ammonium sulfate, Ind. Eng. Chem. Proc. DD., 9, 489–494, doi:10.1021/i260036a001, 1970.
5
30766
Kristensen, T. B., Wex, H., Nekat, B., Nøjgaard, J. K., van Pinxteren, D., Lowenthal, D. H., Mazzoleni, L. R., Dieckmann, K., Koch, C. B., Mentel, T. F., Herrmann, H., Hallar, A. G., Stratmann, F., and Bilde, M.: Hygroscopic growth and CCN activity of HULIS from different environments, J. Geophys. Res.-Atmos, 117, D22203, doi:10.1029/2012JD018249, 2012.
10
30775
Lide, D. R.: CRC Handbook of Chemistry and Physics, CRC Press/Taylor and Francis, Boca Raton, FL, USA, 2692, 2009. 30766
Li-Jones, X. and Prospero, J. M.: Variations in the size distribution of non-sea-salt sulfate aerosol in the marine boundary layer at Barbados: impact of african dust, J. Geophys.
Res.-15
Atmos., 103, 16073–16084, 1998. 30760, 30775
Maria, S. F., Russell, L. M., Turpin, B. J., and Porcja, R. J.: FTIR measurements of functional groups and organic mass in aerosol samples over the Caribbean, Atmos. Environ., 36, 5185– 5196, 2002. 30760, 30776
Mayol-Bracero, O., Rosario, O., Corrigan, C., Morales, R., Torres, I., and Perez, V.: Chemical
20
characterization of submicron organic aerosols in the tropical trade winds of the Caribbean using gas chromatography/mass spectrometry, Atmos. Environ., 35, 1735–1745, 2001. 30760, 30776
Mochida, M., Nishita-Hara, C., Furutani, H., Miyazaki, Y., Jung, J., Kawamura, K., and Ue-matsu, M.: Hygroscopicity and cloud condensation nucleus activity of marine aerosol
25
particles over the western North Pacific, J. Geophys. Res.-Atmos., 116, D06204, doi:10.1029/2010JD014759, 2011. 30769
Monahan, E. C. and Muircheartaigh, I.: Optimal power-law description of oceanic whitecap coverage dependence on wind speed, J. Phys. Oceanogr., 10, 2094–2099, 1980. 30770 Novakov, T. and Penner, J. E.: Large contribution of organic aerosols to
cloud-condensation-30
ACPD
15, 30757–30791, 2015CCN Caribbean
T. B. Kristensen et al.
Title Page
Abstract Introduction
Conclusions References
Tables Figures
◭ ◮
◭ ◮
Back Close
Full Screen / Esc
Printer-friendly Version Interactive Discussion
Discussion
P
a
per
|
Discussion
P
a
per
|
Discussion
P
a
per
|
Discussion
P
a
per
|
Novakov, T., Corrigan, C., Penner, J., Chuang, C., Rosario, O., and Bracero, O.: Organic aerosols in the Caribbean trade winds: a natural source?, J. Geophys. Res.-Atmos., 102, 21307–21313, 1997. 30760, 30776
O’Dowd, C. D. and de Leeuw, G.: Marine aerosol production, Phil. T. Roy. Soc., 365, 1753– 1774, 2007. 30769, 30770
5
O’Dowd, C. D., Facchini, M. C., Cavalli, F., Ceburnis, D., Mircea, M., Decesari, S., Fuzzi, S., Yoon, Y. J., and Putaud, J.-P.: Biogenically driven organic contribution to marine aerosol, Nature, 431, 676–680, 2004. 30759
Petters, M. D. and Kreidenweis, S. M.: A single parameter representation of hygroscopic growth and cloud condensation nucleus activity, Atmos. Chem. Phys., 7, 1961–1971,
10
doi:10.5194/acp-7-1961-2007, 2007. 30759, 30761, 30765, 30770, 30775
Petters, M. D., Kreidenweis, S. M., Prenni, A. J., Sullivan, R. C., Carrico, C. M., Koehler, K. A., and Ziemann, P. J.: Role of molecular size in cloud droplet activation, Geophys. Res. Lett., 36, L22801, doi:10.1029/2009GL040131, 2009. 30770, 30775
Pierce, J. R. and Adams, P. J.: Global evaluation of CCN formation by direct emission
15
of sea salt and growth of ultrafine sea salt, J. Geophys. Res.-Atmos., 111, D06203, doi:10.1029/2005JD006186, 2006. 30759
Pringle, K. J., Tost, H., Pozzer, A., Pöschl, U., and Lelieveld, J.: Global distribution of the effective aerosol hygroscopicity parameter for CCN activation, Atmos. Chem. Phys., 10, 5241–5255, doi:10.5194/acp-10-5241-2010, 2010. 30770
20
Prospero, J. M. and Lamb, P. J.: African droughts and dust transport to the Caribbean: climate change implications, Science, 302, 1024–1027, 2003. 30759, 30762, 30771
Prospero, J. M., Blades, E., Mathison, G., and Naidu, R.: Interhemispheric transport of viable fungi and bacteria from Africa to the Caribbean with soil dust, Aerobiologia, 21, 1–19, 2005. 30763
25
Rasband, W. S.: ImageJ, 1.47c, http://rsb.info.nih.gov/ij/, US National Institutes of Health, Bethesda, MD, USA, 2015. 30767
Reade, L., Jennings, S., and McSweeney, G.: Cloud condensation nuclei measurements at Mace Head, Ireland, over the period 1994–2002, Atmos. Res., 82, 610–621, 2006. 30769 Roberts, G. and Nenes, A.: A continuous-flow longitudinal thermalgradient CCN chamber for
30
atmospheric measurements, Aerosol Sci. Tech., 39, 206–221, 2005. 30763
ACPD
15, 30757–30791, 2015CCN Caribbean
T. B. Kristensen et al.
Title Page
Abstract Introduction
Conclusions References
Tables Figures
◭ ◮
◭ ◮
Back Close
Full Screen / Esc
Printer-friendly Version Interactive Discussion
Discussion
P
a
per
|
Discussion
P
a
per
|
Discussion
P
a
per
|
Discussion
P
a
per
|
counter (DMT-CCNC): CCN activation of ammonium sulfate and sodium chloride aerosol particles in theory and experiment, Atmos. Chem. Phys., 8, 1153–1179, doi:10.5194/acp-8-1153-2008, 2008. 30765
Savoie, D. L. and Prospero, J. M.: Aerosol concentration statistics for the northern tropical Atlantic, J. Geophys. Res., 82, 5954–5964, 1977. 30771
5
Savoie, D. L., Prospero, J. M., and Nees, R. T.: Frequency distribution of dust concentration in Barbados as a function of averaging time, Atmos. Environ., 21, 1659–1663, 1987. 30771 Savoie, D. L., Prospero, J. M., and Saltzman, E. S.: Non-sea-salt sulfate and nitrate in trade
wind aerosols at Barbados: evidence for long-range transport, J. Geophys. Res.-Atmos., 94, 5069–5080, 1989. 30759, 30760, 30770
10
Savoie, D. L., Arimoto, R., Keene, W. C., Prospero, J. M., Duce, R. A., and Galloway, J. N.: Marine biogenic and anthropogenic contributions to non-sea-salt sulfate in the marine boundary layer over the North Atlantic Ocean, J. Geophys. Res.-Atmos., 107, 4356, doi:10.1029/2001JD000970, 2002. 30759, 30760
Sorooshian, A., Padró, L. T., Nenes, A., Feingold, G., McComiskey, A., Hersey, S. P., Gates, H.,
15
Jonsson, H. H., Miller, S. D., Stephens, G. L., Flagan, R. C., and Seinfeld, J. H.: On the link between ocean biota emissions, aerosol, and maritime clouds: airborne, ground, and satellite measurements off the coast of California, Global Biogeochem. Cy., 23, GB4007, doi:10.1029/2009GB003464, 2009. 30769
Trapp, J. M., Millero, F. J., and Prospero, J. M.: Temporal variability of the elemental composition
20
of African dust measured in trade wind aerosols at Barbados and Miami, Mar. Chem., 120, 71–82, 2010. 30763
Twohy, C. H., Kreidenweis, S. M., Eidhammer, T., Browell, E. V., Heymsfield, A. J., Banse-mer, A. R., Anderson, B. E., Chen, G., Ismail, S., DeMott, P. J., and Van Den Heever, S. C.: Saharan dust particles nucleate droplets in eastern Atlantic clouds, Geophys. Res. Lett., 36,
25
L01807, doi:10.1029/2008GL035846, 2009. 30759
Werner, F., Ditas, F., Siebert, H., Simmel, M., Wehner, B., Pilewskie, P., Schmeissner, T., Shaw, R., Hartmann, S., Wex, H., Roberts, G., and Wendisch, M.: Twomey effect observed from collocated microphysical and remote sensing measurements over shallow cumulus, J. Geophys. Res.-Atmos., 119, 1534–1545, 2014. 30760
30
ACPD
15, 30757–30791, 2015CCN Caribbean
T. B. Kristensen et al.
Title Page
Abstract Introduction
Conclusions References
Tables Figures
◭ ◮
◭ ◮
Back Close
Full Screen / Esc
Printer-friendly Version Interactive Discussion
Discussion
P
a
per
|
Discussion
P
a
per
|
Discussion
P
a
per
|
Discussion
P
a
per
|
Quincey, P., Hüglin, C., Fierz-Schmidhauser, R., Gysel, M., Weingartner, E., Riccobono, F., Santos, S., Grüning, C., Faloon, K., Beddows, D., Harrison, R., Monahan, C., Jennings, S. G., O’Dowd, C. D., Marinoni, A., Horn, H.-G., Keck, L., Jiang, J., Scheckman, J., McMurry, P. H., Deng, Z., Zhao, C. S., Moerman, M., Henzing, B., de Leeuw, G., Löschau, G., and Bas-tian, S.: Mobility particle size spectrometers: harmonization of technical standards and data
5
ACPD
15, 30757–30791, 2015CCN Caribbean
T. B. Kristensen et al.
Title Page
Abstract Introduction
Conclusions References
Tables Figures
◭ ◮
◭ ◮
Back Close
Full Screen / Esc
Printer-friendly Version Interactive Discussion
Discussion
P
a
per
|
Discussion
P
a
per
|
Discussion
P
a
per
|
Discussion
P
a
per
|
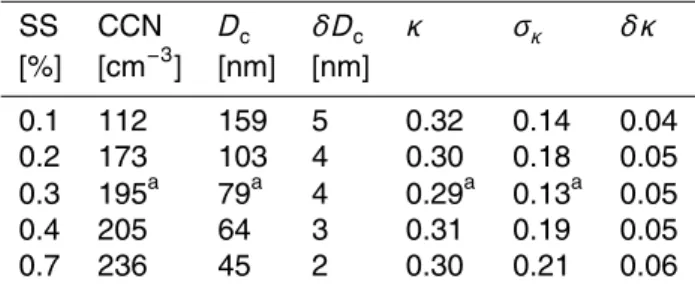
Table 1.The median CCN number concentrations, the median critical diameters (Dc), the
aver-age random error onDc(δDc),κvalues, standard deviations of theκvalues (σκ), and average
random errors on theκvalues (δκ) for the different supersaturations.
SS CCN Dc δDc κ σκ δκ
[%] [cm−3] [nm] [nm]
0.1 112 159 5 0.32 0.14 0.04 0.2 173 103 4 0.30 0.18 0.05 0.3 195a 79a 4 0.29a 0.13a 0.05 0.4 205 64 3 0.31 0.19 0.05 0.7 236 45 2 0.30 0.21 0.06
aThe CCN counter was only operated with a supersaturation of
ACPD
15, 30757–30791, 2015CCN Caribbean
T. B. Kristensen et al.
Title Page
Abstract Introduction
Conclusions References
Tables Figures
◭ ◮
◭ ◮
Back Close
Full Screen / Esc
Printer-friendly Version Interactive Discussion
Discussion
P
a
per
|
Discussion
P
a
per
|
Discussion
P
a
per
|
Discussion
P
a
per
|
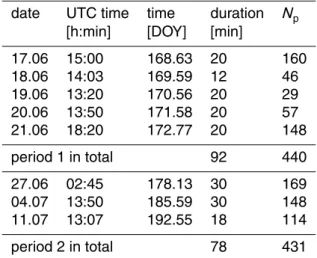
Table 2. Information about the samples investigated with transmission electron microscopy.
Date and UTC time represent the beginning of the sampling, while time in DOY is the midpoint of the sampling time. Duration gives the sampling time in minutes.Npis the number of particles investigated.
date UTC time time duration Np
[h:min] [DOY] [min]
17.06 15:00 168.63 20 160 18.06 14:03 169.59 12 46 19.06 13:20 170.56 20 29 20.06 13:50 171.58 20 57 21.06 18:20 172.77 20 148
period 1 in total 92 440
27.06 02:45 178.13 30 169 04.07 13:50 185.59 30 148 11.07 13:07 192.55 18 114
ACPD
15, 30757–30791, 2015CCN Caribbean
T. B. Kristensen et al.
Title Page
Abstract Introduction
Conclusions References
Tables Figures
◭ ◮
◭ ◮
Back Close
Full Screen / Esc
Printer-friendly Version Interactive Discussion
Discussion
P
a
per
|
Discussion
P
a
per
|
Discussion
P
a
per
|
Discussion
P
a
per
|
165 170 175 180 185 190 195 4
6 8 10 12 14
Time [DOY]
Wind speed [m/s]
165 170 175 180 185 190 195 0
50 100 150 200
Time [DOY]
Wind direction [
°]
165 170 175 180 185 190 195 60
65 70 75 80 85 90
Time [DOY]
RH [%]
Figure 1.Local meteorological parameters measured at the top of the 17 m high tower. Top