111
PACS numbers: 68.37.Hk, 42.70.Qs, 81.07.b, 81.16.Be
SYNTHESIS AND CHARACTERISATION OF CdxZn1–xS NANOCOMPOSITES
M. Ragam1, K. Prem Ananth1, P. Parasakthi1, M. Thiribuvan1, K. Prema1, R Karuppaian1, N. Sankar1, K. Ramachandran2
1 Department of Physics,
Yadava College, Govindarajan Campus, Thiruppalai, Madurai 625 014, India E-mail: [email protected] 2 School of Physics,
Madurai Kamaraj University, Madurai-21, Tamilnadu, India
CdxZn1–xS nanoparticles have been synthesized using hydrothermal method. Structural characterization was done by XRD where the lattice structure gradually changes from hexagonal to cubic with increasing percentage of Zn in CdxZn1–xS nanoparticles. Optical spectroscopy provided evidence that the absorption edges of those nanoparticles can be varied from blue to UV. The nanoparticles exhibit emission peaks that shift to shorter wavelength with increasing percentage of Zn in the compounds CdxZn1–xS. The control of the composition of CdxZn1–xS nanoparticles may lead the development of ideal materials for short wavelength diode laser applications.
Keywords: SEMICONDUCTORS, HYDROTHERMAL SYNTHESIS, OPTICAL PRO-PERTIES, SCANNING ELECTRON MICROSCOPY, CADMIUM ZINC COMPOSITES.
(Received 04 February 2011, in final form 20 March 2011)
1. INTRODUCTION
The Synthesis and characterization of semiconductor nanoparticles have attracted much interest because of their novel properties as a consequence of the large number of surface atoms and the three dimensional confinement of the electrons [1]. Altering the size of the particles alters the degree of the confinement of the electrons and affects the electronic structure of the solid, especially the band gap edges, which are tunable with particle size. Among a variety of semiconductor materials, the binary metal chalcogenides of group II-IV have been extensively studied [2]. They have outstanding potential applications, owing to their nonlinear optical and luminescence properties [3], quantum size effect [4], and other important physical and chemical properties [5]. Nanocrystalline CdS and ZnS are attractive materials in photo conducting cells and optoelectronic devices such as solar cells and photodetectors [6]. Also the related ternary compounds CdxZn1 – xS
A facile, easy controlled and economical method was described in this article. We used simple inorganic raw materials to synthesize a series of nano- sized CdxZn1 – xS samples involved in hydrothermal process. The central objective of the present study is to understand the growth behavior of ZnS-CdS nanoparticles, the optical and structural properties have been studied, and the results indicate that the absorption edges of those nanoparticles can be varied from blue to UV, while the emission peak can be adjusted from 470 to 690 nm which shows it has potential applications as wide band gap window materials.
2. EXPERIMENTAL
2.1 Chemicals
Chemicals were all of analytical reagent grade quality and used without further purification. Deionized and doubly distilled water were used throughout this study.
2.2 Synthesis
In a typical synthesis, 0.003 mol of CdCl22H2O and 0.003 mol of Zn(AC)22H2O
were dissolved in 41.67 mL of ethylene glycol to from a clear solution after stirring for 15 min at room temperature. 0.006 mol of Na2S.9H2O were added
into 20.34 mL of ethylene glycol which was then stirred to form a homogeneous solution. The above solutions were mixed and were then transferred into an autoclave with an inner Teflon lining and maintained at 140 oC for 3 h. The
yellow precipitate was harvested by centrifugation and washed several times with deionized water and ethanol to remove possible cations and anions before being dried in oven at 80 oC for 6 h.
2.3 Characterization of CdxZn1 – xS nanocomposites
Products were characterized by ray diffraction (XRD) recorded on a X-ray diffraction (PANalytical X’pert PRO X-Ray Diffractometer) with Cu ( 1.54060 ) as the source of incident radiation. UV-Vis spectra were recorded on a Shimadzu UV Spectrophotometer in the spectral range 200 - 900 nm at room temperature. The room temperature PL spectra are recorded using Perkin-Elmer LS-55 fluorescence spectrophotometer. Scanning Electron Microscopy (SEM) picture of these particles were taken using JEOL, JSM-840 microscope
3. RESULTS AND DISCUSSION
3.1 Crystal Structure and Morphology
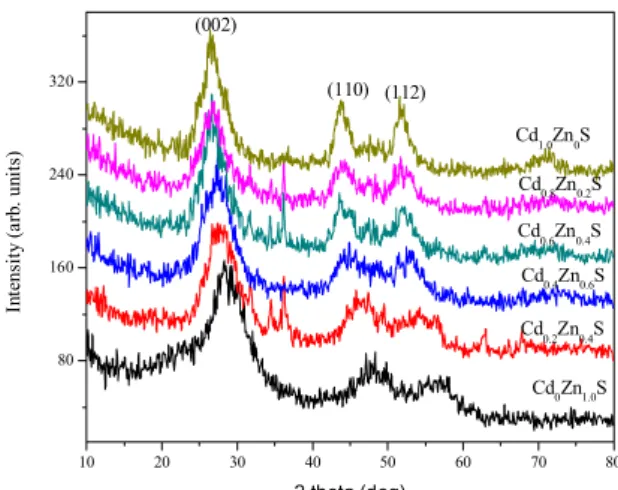
Fig. 1. shows X-ray diffraction pattern of CdxZn1 – xS nanoparticles. It is clear that XRD patterns of the nanoparticles exhibits prominent peaks at scattering angles (2 ) of 26.548, 43.37,and 51.91 which could be indexed to scattering from the (002), (110) and (112) planes respectively, of the hexagonal CdxZn1 – xS crystal lattice. From the spectra it is clear that at
the reflection gradually decreases when the Cd concentration in the nanoparticles increases. This phenomenon was also observed by Laukaitis et al.
From the half width of the XRD peaks, the average particle size is tabulated in Table 1. based on Scherrer equation (D 0.9 /B cos ), where D
is the crystal diameter, is the X-ray wavelength 1.5408 and is the diffraction angle. But it is known that the accuracy of Scherrer formula for particle size below 5 nm is questionable as instrumental broadening of the diffractometer will mask. And so dislocation density and strain are calculated and tabulated in Table 1. These sizes are taken as only guideline values.
10 20 30 40 50 60 70 80
80 160 240 320
(112) (110)
Cd1.0Zn0S
Cd0.8Zn0.2S
Cd0.6Zn0.4S
Cd0.4Zn0.6S
Cd0.2Zn0.4S
In
te
n
si
ty
(
a
rb
.
u
n
it
s)
2 theta (deg)
Cd0Zn1.0S (002)
Fig. 1 – XRD spectra for CdxZn1 – xS (x 0, 0.2, 0.4, 0.6, 0.8, 1.0) nanoparticles
Table 1– Structural parameters of CdxZn1 – xS nanocomposites
Samples Particle size (nm) Dislocation density (lines/m2) Strain
Cd0Zn1.0S 2.1 2.14 1017 0.02
Cd0.2Zn0.8S 2.4 1.61 1017 0.017
Cd0.4Zn0.6S 2.2 1.94 1017 0.020
Cd0.6Zn0.4S 2.3 1.79 1017 0.018
Cd0.8Zn0.2S 2.5 1.62 1017 0.073
Cd1.0Zn0S 3.5 7.99 1016 0.012
3.2 SEM Analysis
Fig. 2. shows the SEM images of CdxZn1 – xS nanocrytals. Well-crystallized
Fig. 2 – SEM image of CdxZn1 – xS (x 0.2, 0.4, 0.6, 0.8) nanoparticles
3.3 UV-Vis Analysis
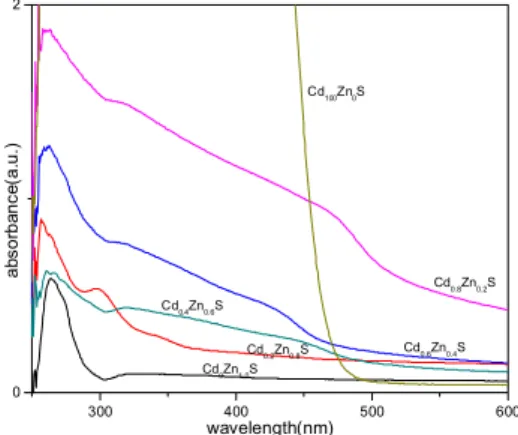
The optoelectronics properties were investigated by ultraviolet-visible absorption spectra using the Shimadzu UV Spectrophotometer in the spectral range 200 - 900 nm at room temperature Fig. 3. shows the UV absorption spectra of CdxZn1 – xS nanoparticles solutions along with those of the pure
ZnS nanoparticles and CdS nanoparticles solutions. ZnS nanoparticles have an absorption peak at 302 nm, while CdS shows its absorption shoulder peak at 477 nm, the wavelengths corresponding the bandgaps of 4.11 eV for ZnS and 2.60 eV for CdS respectively. The blue shifts in the absorption edge bands have been interpreted in terms of quantum size effects [8] which are tabulated in table 2.
300 400 500 600
0 2
Cd
100Zn0S
Cd0.8Zn0.2S
Cd
0.2Zn0.8S
Cd
0.4Zn0.6S
Cd
0.6Zn0.4S
a
b
s
o
rb
a
n
c
e
(a
.u
.)
wavelength(nm) Cd0Zn1.0S
Fig. 3 – UV-Vis spectra of CdxZn1 – xS (x 0.2, 0.4, 0.6, 0.8) nanoparticles c
a b
d
100 nm 100 nm
The absorption spectra of nanoparticles were found to lie between those of pure CdS and ZnS nanoparticles solutions. And the absoption edge bands of nanoparticles systematically redshifted from 302 nm to 450 nm with increasing the content of Cd in CdxZn1 – xS nanoparticles which indicates the
adsorption edges of those nanoparticles can be varied from blue to UV. This is very similar to the result obtained by Shengnan Zu et al. [8].
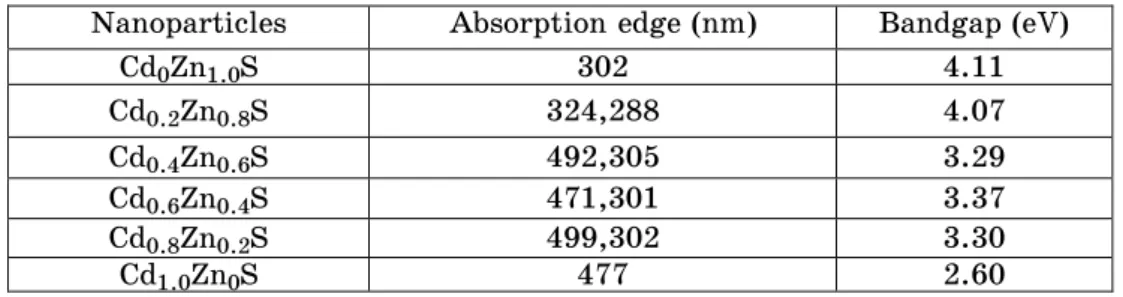
Table 2 – Optical parameters of CdxZn1 –xS nanocomposites
Nanoparticles Absorption edge (nm) Bandgap (eV)
Cd0Zn1.0S 302 4.11
Cd0.2Zn0.8S 324,288 4.07
Cd0.4Zn0.6S 492,305 3.29
Cd0.6Zn0.4S 471,301 3.37
Cd0.8Zn0.2S 499,302 3.30
Cd1.0Zn0S 477 2.60
3.4 PL Analysis
The photoluminescence spectra of the CdxZn1 – xS nanocrystals in Fig. 4
shows three peaks around 620 nm, 660 nm and 670 nm, lying between those of pure CdS and ZnS nanoparticles. The emission band around 480 nm for ZnS nanoparticles arises from the recombination through surface localized state [9]. For the distinct peak at 620 nm shows the electron hole recombination after relaxation, while emission around 660 nm is due to the trap state emission [10].
An interesting feature in these spectra is that once the composite nanoparticles form, the band edge emission of CdS nanoparticles will disappear. Therefore, the PL bands of CdxZn1 – xS nanoparticles as in Fig. 4.
are caused by trap state emission [10]. In our system, PL band position is red shifted as the Cd content increases, which is consistent with the results of UV absorption, confirming the formation of nanoparticles. And the position of emission peaks can be adjusted from 460 to 670 nm when increasing the Cd content in the CdxZn1 – xS nanoparticles.
500 550 600 650 700 750
0 2 4 6 8
Cd0.4Zn0.6S
Cd0.6Zn0.4S
Cd1.0Zn0S Cd0.8Zn0.2S
P
L
I
n
te
n
s
it
y
(a
.u
.)
Wavelength/(nm) Cd0Zn1.0S
4. CONCLUSION
In conclusion, we have developed a novel and simple method by hydro-thermal process to produce nano sized CdxZn1 – xS. The obtained
nano-crystals present homogenous alloyed structure and uniform spheres. Lattice structure of CdxZn1 – xS changes from cubic to hexagobal as x goes from 0 to
1. The optical properties of nano CdxZn1 – xS can be modulated by tuning
their compositions with a wide range which has the prospect for solar energy utilization due to the variable optical properties.
REFERENCES
1. A. Henglein, Chem. Rev. 89, 1861 (1989).
2. M.L. Steigerwald, L.E. Brus, Acc. Chem. Res. 23, 183 (1990).
3. M.G. Bawendi, M.L. Steigerwald, L.E. Brus, Annu. Rev. Phys. Chem. 41, 477 (1990). 4. Y. Wang, N. Herron, J. Phys. Chem. 95, 525 (1991).
5. S. Gorer, J.A. Ganske, J.C. Hemminger, R.M.J. Penner, Am. Chem. Soc. 120, 9584 (1998).
6. J. Britt, C. Ferekides, Appl. Phys. Lett. 62, 2851 (1993).
7. T. Taguchi, Y. Endoh, Y. Nozue, Appl. Phys. Lett. 59, 3434 (1991). 8. S. Zu, Z. Wang, B. Lie, X. Fan, G. Qian, J. Alloy. Compd.476, 689 (2009). 9. S. Wageh, S.M. Liu, T.Y. Fang, X.R. Xu, J. Lumin. 102, 768 (2003) 10.Y. Li, F. Huang, Q. Zhang, J. Mater. Sci. 35, 5933 (2000).