Designing an Integrated Multi-objective Supply
Chain Network Considering Volume Flexibility
Shahrooz Shahparvari, Payam Chiniforooshan, Ahmad Abareshi
Abstract: This paper investigates the problem of designing an integrated production-distribution system which supports strategic and tactical decision levels in supply chain management. An important aspect of this problem is consideration of volume flexibility to increase the system ability to change the level of aggregated output. The problem is formulated as a mixed integer linear programming. The objective functions are to minimize the total cost of production, location of DCs, transportation, inventory holding and backorders while maximizing flexibility level simultaneously. Since the problem under study is NP-hard, a multi-objective differential evolution (MOEM) framework is developed to solve this problem. To prove the efficiency and reliability of the proposed algorithm, the results obtained from extensive experiments are compared with the well-known multi-objective genetic algorithms in the literature, i.e. NSGA-II based on some comparison metrics. Computational experiments indicate the superiority of the MODE compared to this algorithm.
Keywords: Supply chain network, Production-distribution system, Multi-objective optimization, Differential evolution algorithm.
I.
INTRODUCTIONSupply chain management (SCM) is the systematic analysis and educated decision-making within the different business functions of an organization resulting in smooth and cost-effective flows of resources – material, information, and money. In other words, it is the coordination and synchronization of the flow of resources in the network of suppliers, manufacturing facilities, distribution centres’ and customers. These network elements form the different echelons of the supply chain. The supply chain (SC) is the network that sources raw material from suppliers, transforms it into finished products at the manufacturing facilities, and distributes the finished products to the final customers through the distribution centres’. These activities constitute the individual business functions of the company’s supply chain network.
Decisions are made across the supply chain on three levels: strategic, tactical and operational. Strategic decisions are long term decisions where the time horizon may be anything from one year to several years i.e. it involves multiple planning horizons. These decisions may be made on an organizational level or the supply
Manuscript received February 11, 2013
Shahparvari. Sh. is with Department of Business IT and Logistics, Business School, RMIT University, Melbourne, Vic, Australia (corresponding author to provide phone: Tel: +61450250055; (e-mail: Shahrooz.shahparvari@rmit.edu.au).
Chiniforooshan. P. is with the Department of Industrial Engineering, Science and Research Branch, Islamic Azad University, Tehran, Iran, (e-mail: .Chiniforooshan@usc.ac.ir).
Abareshi. A. is with the School of Business IT and Logistics, Business School, RMIT University, Melbourne, Vic, Australia (e-mail: Ahmad.Abareshi@rmit.edu.au).
chain level with the aim for global optimization. Tactical decisions are taken over a shorter period of time, maybe a few months. These are more localized decisions taken to keep the organization on the track set at the strategic level. Operational decisions are similar to day-to-day decisions for planning a few days worth of operations. These take into consideration the most profitable way to carry out daily activities for satisfying immediate requirements.
As the connection between markets and sources, demand and supply has increased the strategic relevance of SCM, in today’s competitive world maintaining an efficient and flexible supply chain became critical for every enterprise. In order to retain and strengthen their competitive edge in the market, organizations need to coordinate and integrate all their business operations with sustainability considerations. A focus on supply chain is a step towards the broader adoption and development of sustainability, since the supply chain considers the product from initial processing of raw materials to delivery to the customer. However, sustainability also must integrate issues and flows that extend beyond the core of supply chain management (Linton et al. (1).
Supply chains have been more or less integrated to some extent as a whole, or in parts. Integration, if done at all, has been mostly done in patches throughout the supply chain. In many cases, this has been driven more by the need to survive and improvise, than by the willingness to improve and advance further. For example, suppliers have been coordinating with manufacturers to implement quality assurance programs in order to meet the ever increasing stringent quality requirements. These quality standards are mostly driven by market conditions which would not allow the manufacturer to accept material from the supplier if it does not meet those standards, thus risking the supplier’s business.
Therefore, efforts must be made to integrate suppliers, manufacturers, distributors, and customers, so that they will collaborate effectively with each other in the entire network. In other words, to fulfil the demand of the customer, the organizations, processes, and systems must be properly consolidated, not only between themselves but they must also be integrated with customers, competitors, and alliance partners.
During the past few years, there have been significant attempts for providing integrated supply chain problems, which includes suppliers, manufacturers, distributors and retailers. The primary objective of an integrated supply chain is to optimize all cost components from converting raw materials into final products delivered to end users (Davis (2), Simchi-Levi et al. (3), Bilgen and Ozkarahan(4)). These conventional methods generally consider an overall production strategy, inventory strategy and flow of products through a facility over a single period to minimize total costs or maximize profits (Gen and Syarif (5)).
Griffin (7), Jayaraman and Pirkul (8), Liang and Cheng (9)). In this way, a good review is carried out by (Mula et al. (10)).
Besides, nowadays, SC systems face to unpredictable and variable circumstances. If these systems want to be able to adjust or respond quickly and smoothly to changes with low investment, they should be considered more flexible which can only achieve the same change at great cost and/or organizational disruption. Preventing supply chain disruption is one of the most important aspects have not received much attention in the literature. Investing in system flexibility, excess inventory and purchasing large insurance policies are common ways to protect supply chains against such risks. Flexibility concept is one of the subjects that is applied in SC models rarely (Melo et al. (11)). Volume flexibility is the one of the flexibility types that is defined as the ability to change the level of aggregated output (Slack (12)). Face to unpredictable and variable circumstances of customer demands is the most important case of volume flexibility, because this is concern with capability to change the output level and there is a straight proportion between output level and customer responsibility.
Due to these issues, in this paper an integrated production-distribution model consisting multi periods and multi products for the location-allocation problem is presented. This model includes a plant, distribution centers (DCs) and customer zones while considering strategic and tactical decision levels in the system. Also, in order to measure of capacity slack and customer response capability in multi periods SC systems, volume flexibility will be handled in the model. The ε-constraint method, which introduced by (Goicoechea et al. (13)), is selected to determine the efficient value of flexibility because this method don’t require specific conditions to achieve the solutions.
Moreover, the practical production and distribution problems in a supply chain generally have conflicting objectives in term of the use of organizational resources, and these conflicting objectives must be simultaneously optimized by the DM. Hence, this investigation develops a multi-objective mixed integer linear programming model to solve multiple product and multiple period production and distribution problems with multiple objectives in a supply chain. The proposed model attempts to simultaneously minimize total costs and maximize flexibility in relation to inventory levels, available machine capacity.
The problem under consideration can be reduced to the well-known p-median problem which is known to be NP-hard (Kariv and Hakimi (14)). Therefore, researchers have utilized heuristic and meta-heuristic approaches to solve this problem. Syarif et al. (15) have developed a spanning tree-based GA approach for the multi-source, single-product, multi-stage SCN design problem. Jayaraman and Ross (16) have also proposed a heuristic approach based on simulated annealing for the designing of distribution network and management in supply chain environment. Yeh (17) has proposed a memetic algorithm (MA) which is a combination of GA, greedy heuristic, and local search methods for the same problem. The author has extensively investigated the performance of the MA on the randomly generated problems.
Differential evolution (DE) is a novel evolutionary algorithm recently introduced by Storn and Price (18) for optimization problems over continuous spaces. Due to its ease of use, fast convergence and robustness, DE has gained much attention and a wide range of successful application such as digital PID controller design (Biswas, Das, Abraham, & Dasgupta, (19)), bankruptcy prediction in banks (Chauhan, Ravi, & Karthik Chandra, (20)), feed-forward neural networks training (Ilonen, Kamarainen, & Lampinen, (21)), digital filter design (R. Storn, (22)) and earthquake hypocenter location (Růžek & Kvasnička, (23)). Due to their evolutionary nature, DE algorithm can search for solutions without regard to the specific inner workings of the problem. Therefore, DE is possibly well suited to the multi-objective optimization problems.
In this paper, we also investigate the application of DE algorithm to solve integrated production- distribution system. The main contributions of this paper can be summarized as follows:
Introducing a model to combine strategic and tactical decisions in SC network by integrating production and distribution planning activities into a echelon, multi-product, multi-level and multi-period SC network.
Considering flexibility into the proposed model as a second objective.
The application of meta-heuristic algorithms to solve the considered problem.
The remainder of paper is organized as follows. Section 2 presents a literature review about production-distribution planning. In Section 3, we propose the formulation of multi-objecive integrated production-distribution model for dynamic location-allocation problem considering volume flexibility and backorder costs. This is followed by a brief overview of DE in the section 4. Section 5 presents a multi-objective DE to solve the model. In section 6, we show the experimental results obtained by the proposed solution algorithm and then compare these results with multi-objective genetic algorithms, called NSGAII. Finally, the conclusions and suggestions for future research are presented in section 7.
II.
LITERATURE REVIEWThere is a vast amount of literature available on supply chain management research dealing with the different aspects of the subject. Numerous models in the literature, conceptual as well as quantitative, refer to the planning and quantitative aspects of the different business functions: location, production, inventory and transportation. A number of quantitative models use mixed-integer programming (MIP) to solve the supply chain optimization problems. One of the first attempts was done by (Geoffrion and Graves, (24)), where a MIP model was formulated for the multiple commodity location problem. This seminal research involved the determination of distribution center (DC) locations, their capacities, customer zones and transportation flow patterns for all commodities. A solution to the location portion of the problem was presented, based on Bender’s Decomposition (BD).
Cohen and Lee (Cohen and Lee (25)) develop an analytical model to establish materials requirements policy based on stochastic demand. They develop four different sub-models with a minimum-cost objective. A mathematical algorithm at the end decides the optimal ordering policies to minimize the costs. A MIP model for a production, transportation, and distribution problem has been developed by Pirkul and Jayaraman (8) to represent a multi-product tri-echelon capacitated plant and warehouse location problem. The model minimizes the sum of fixed costs of operating the plants and warehouses, and the variable costs of transporting multiple products from the plants to the warehouses and finally to the customers.
Schmidt and Wilhelm (Schmidt and Wilhelm (26)) present a review of the work done on different decisional levels in the supply chain with respect to time frames – strategic, tactical and operational. Modelling issues are discussed at each level and a prototype formulation is provided as an extension of the discussion. Cordeau et al. (27) propose a static model considering a multi-commodity, multi-facility and single-country network. The decision variables concern the number of locations, the capacity and technology of manufacturing in plants and warehouses, selection of suppliers, selection of distribution channels, transportation modes and material flows.
authors consider an international network, with deterministic demands. They consider external suppliers, capacitated plants and warehouses, the choice between a set of available technologies, the possibility of adding capacity options to the facilities, and a list of substitute products to replace standard ones.
Another studies which address the SC coordination issues at different decision levels have been developed (De Matta and Miller (29), Park (30), Lei et al. (31), Rizk et al. (32), Tsiakis and Papageorgiou (33)).
III.
PROBLEM FORMULATIONIn this section, a mixed integer linear programming (MILP) model is proposed considering a 3-layer SC system: a plant, Multiple DCs and multiple customer zones in multiple periods with multiple products. In each planning horizon, the plant performs operations to produce finished products. Then the plant ships the finished goods to DCs. Finally, the finished products are distributed from DCs to customer zones. Note that optimum number of DCs and location of them are determined only in the first period for all of the remained periods.
Likewise, specified capacities for plant and each DC are determined in the model, and demand of each customer zone can be satisfied from multiple DCs in the same time. Besides, the model determines assignment of each customer zone to DCs, quantity of each product produced in each period, inventory level of products which is held in each DC, Quantity of products delivered to DCs and Customer zones, and quantity of backorders in each period. Also, in order to increase the ability of responding to changes, volume flexibility is considered in the system based on
ε-constraint method.
The objective function of the model is to minimize transportation costs between plant to DCs and DCs to customer zones, inventory holding costs and backorder costs while satisfying all customer demands, plant capacity and DCs capacities. The mathematical model describing the characteristic of the problem can be formulated based on following variables and parameters:
IV.
NOTATIONSets and Indices:
T: set of time periods.
t: index for time periods.
P: Set of products.
p: index for products.
W: Set of Distribution Centers.
w: index for distribution centers.
Parameters:
:
B
Time unit available for production in any given period Up: Processing time for producing one unit of product p:
w
F
Fixed charge of DCw: pt
PC Variable cost to produce a unit of product p :
pw
HC Inventory holding cost per unit of product p at DCw
:
pw
TC Cost of travel from plant to DCw per unit of product p
:
pwt
TC Cost of travel from DCwto customer zone i per unit of
product p
:
w
H
Holding capacity at DCw:
p
V Volume of product p
:
pit
D
Demand of product p at customer zone i in period t :M A sufficient large positive number
:
t
FL
Volume flexibility in period t :
Volume flexibility performance index :, 2 1
Weight factor for capacity utilization [0,1]Decision Variables:
Yw: if DCw should be open, 1; otherwise, 0.
:
pt
q
Quantity of product p produced in period t:
pwt
l
Inventory level of product p at DCw in period t:
pwt
f
Quantity of product p delivered from plant to DCw in periodt
:
pwit
g
Quantity of product p delivered from DCw to customerzone i in period t
V.
MATHEMATICAL MODELMin Z1: w
w w
Y
F
(1)
t p pt ptq
PC
(2) pwtt p w
pw
l
HC
(3)pwt
t p w
pw
f
TC
(4)pwit
t p w
pwt
g
TC
(5)Min Z2:
t t T
FL
(6)Subject to. 2 1
w p wpwt w w pt p p
t q YH f
U B
FL t (7)
t
FL
t (8)B q
U pt
p
p
t (9)w p p t pw p p
pwtV l V H
f
(1) t,w (10)
i pwit pwt t pwpwt
l
f
g
l
( 1) t,p,w (11)pt w
pwt q
f
t,p (12)pit w
pwit D
g
t,p,i (13)w
pwit
MY
g
t,p,w,i (14)w
pwt
MY
f
t,p,w (15)1 , 0
w
Y w (16)
0 pwt l , w p t, ,
(17)
0
pwt
f t,p,w (18)
0
pwit
The first objective function minimizes total costs of the system. Alternatively, phrase (1) states fixed charge costs of DCs that are opened. Phrase (2) includes variable costs of product p producing in period t. Phrase (3) is the holding inventory costs in DCs. Phrases (4),(5) state transportation costs from plant to DCs and DCs to customer zones respectively. The second objective maximizes the flexibility level in relation to inventory levels, available machine capacity. This analysis may be accomplished by varying to generate several non-dominated solutions. In order to achieve the efficient amount of , a suggested procedure will be proposed in the next section.
Phrase (6) represents the volume flexibility in each period which is the sum of the following flexibility performance measures:
Plant volume flexibility, which is measured as the difference between plant capacity and plant capacity utilization and thus represents the available plant capacity.
Distribution volume flexibility, which is calculated as the difference between the available throughput and demand requirements, and thus represents the available distribution capacity.
Constraints (8) state minimum flexibility level that DM expects to apply it for the system. Constraints (9) ensure that the plant capacity is respected. Constraints (10) express the capacity constraints of DCs. Constraints (11) assure the balance of inventory level in DCs.
Constraints (12) ensure that the total quantity of product p delivered from the plant to DCw is equal to production quantity in a
given period t. Constraints (13) state each customer zone demands are completely satisfied. Constraints (14) and (15) guarantee the assignment of customers and transportation to open DCs. Finally Constraints (16)-(19) state the types of decision variables.
VI.
OVERVIEW OF D.EDifferential Evolution (DE) algorithm, introduced by Storn and Price is a powerful population-based evolutionary algorithm for optimization algorithm over continuous spaces. DE starts with an initial population vector, which is randomly generated when no preliminary knowledge about the solution space is available (Rainer Storn & Price, 1997). The basic scheme of DE, which is denoted as DE/rand/1/bin, can be summarized as follows:
At every generation G, DE maintains a population P(G) of NP (population size) vectors of solutions which evolve through the optimization process to find global solution:
, … , (19)
The population size, NP, is constant during the optimization process. The dimension of each vector of candidate solutions correspond to the number of the decision parameters, D, to be optimized. Therefore,
, , … , , , , , … , (20)
After that the initial population is created, it evolves through the operation of mutation, crossover and selection. At every generation G, each vector in the population has to serve once a target vector. For each target vector, a mutant vector is defined by:
(21) With random indexes , , ∈ , , … , , integer, mutually different, and different to the target vector. F is a user defined constant (also known mutation scaling factor), which is typically chosen from the range (0,2] (Rainer Storn & Price (18)). Larger values for F result in higher diversity in the generated population and lower values cause faster convergence.
DE utilizes the crossover operation to generate new solutions by shuffling competing vectors and also to increase the diversity of
the population. To this end, the trial vector, i.e.,
, , … , , is formed, where
In (22), randj is the jth evaluation of a uniform random number
generator with outcome between 0 and 1. CR is the crossover rate constant and is a user-defined parameter within the range [0,1]. Large CR usually increases the convergence rate. K is a random parameter index chosen from the set {1, …, D}, which is used to make sure that at least one parameter is always selected from a
. The crossover procedure is illustrated in Figure 1.
FIGURE 1 Crossover Process with an Example with 7 Jobs (7-dimension)
In order to decide which vector ( , ) should become a member of generation G+1, the trial vector is compared to the target vector using a greedy criterion. For a minimization problem, the vector with the lower value of objective function is chosen. As a result, all individuals of the next generation are as good as or better than the individuals of the current generation. Comprehensive history and development of DE is presented in the (Feoktistov, (34)).
VII.
MULTI-OBJECTIVE DESupply chain network design is to provide an optimal platform for efficient and effective SCM. This is an important and strategic operations management problem in SCM. The design task involves the choice of facilities (plants and distribution centers (DCs)) to be opened and the distribution network design to satisfy the customer demand with minimum cost. It belongs to a production-distribution and facility location-allocation problem. Solution approaches for these problems are optimization algorithms within the framework of Benders’ decomposition (Geoffrion and Graves (24), Cohen and Moon (35)), heuristics based on branch-and-bound (Ro and Tcha (36)), and Lagrangian relaxation (Jayaraman and Pirkul (8)). However, these techniques consume extensive amounts of time and effort in finding optimal solutions for realistically sized problems. The problem under consideration can be reduced to the well-known p-median problem which is known to be NP-hard (Kariv and Hakimi (14)). Therefore, researchers have utilized heuristic and meta-heuristic approaches to solve this problem.
Syarif et al. (Syarif, Yun et al. (15)) have developed a spanning tree-based GA approach for the multi-source, single-product, multi-stage SCN design problem. Jayaraman and Ross (16) have also proposed a heuristic approach based on simulated annealing for the designing of distribution network and management in supply chain environment. Yeh (17) has proposed a memetic algorithm (MA) which is a combination of GA, greedy heuristic, and local search methods for the same problem. The author has
j=1
2 3 4 5 6 7
j=1
2 3 4 5 6 7
≤ CR
>CR
> CR
>CR
> CR
≤ CR
≤ CR
, ,
,
,
, , … , , , , … ,
extensively investigated the performance of the MA on the randomly generated problems.
In this paper in order to solve the considered SC network, a multi-objective DE (MODE) algorithm is proposed. The proposed MODE algorithm to solve the candidate problem consists of following steps:
Step 1: In order to establish a starting point for the optimization process, each decision parameter in every vector of the initial population is assigned a randomly chosen value from within its corresponding feasible bounds. This initial population set , , , , … , , consists of 2NP solutions, which are randomly generated. Step 2: The values of objective functions for each vector are
evaluated: total cost ( ), total flexibility ( ) according to equations (1) and (2). Eliminate dominated solutions from the feasible set .
Step 3: Compute average total cost ( ) and average total flexibility ( ) in the updated . Then for each solution vector, compute the normalized distance (D) in a two-dimensional objective space from the origin according to equation (23).
⁄ ⁄ (23)
Step 4: Order solution vectors in in descendant order. Split the ordered population set into two solution subsets: lower-half and upper-lower-half.
Step 5: Apply the mutation and crossover operators according to equations (21) and (22) to the current lower-half subset solutions.
Step 6: the algorithm is repeated from Step (2) to Step (5) until the termination condition is met. The maximum number of generation is selected as a termination condition.
VIII.
COMPUTATIONAL RESULTSThis section gives experimentation results on the performance of proposed MODE to solve the candidate problem. Also, the performance of the MODE using eight different examples, which are randomly generated, is compared with the well-known multi-objective genetic algorithms in the literature, namely NSGA-II. All algorithms are coded in MATLAB 7 and executed on an Intel® Core 2 DuoE4500 at 2.20 GHz with 2.0GB of RAM.
TABLE I. The Results Of The Proposed MODE
Problem T P W QM SM
1 6 5 4 0.71 0.17
2 12 5 4 0.69 0.22
3 6 10 6 0.79 0.19
4 12 10 6 0.86 0.09
5 6 15 8 0.89 0.27
6 12 15 8 0.88 0.12
One of the most important issues in evaluating the performance of an algorithm is to have appropriate attributes. In this paper, to validate the reliability and performance of the proposed MODE, the following comparison metrics are used.
Quality metrics (QM): This metric is simply measured by putting together the non-dominated solutions found by algorithm and the ratios between non-dominated solutions are achieved.
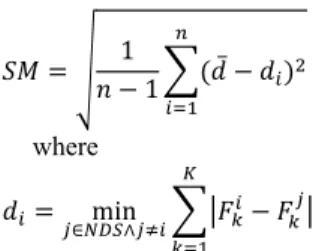
Spacing metric (SM): we use spacing metric that provides a measure of uniformity of the spread of non-dominated solutions. This metric is given by equation (24).
̅ (24)
where
min
∈ ∧ (25)
And ̅ is the mean of all di, n is the size of obtained
non-dominated solutions and is the function value of the k-th objective function for solution i. The lower values of the SM are preferable.
Tables 1 and 2 report the related computational results for large size problem instances.
The comparison between the two presented methods (MODE, NSGA-II) shows that the MODE algorithm is better than NSGA-II. The results reveal that the proposed MODE can achieve a greater number of Pareto optimal solutions with higher qualities than NSGA-II.
TABLE II. The Results Of The NSGA-II
Problem T P W QM SM
1 6 5 4 0.29 0.29
2 12 5 4 0.31 0.33
3 6 10 6 0.21 0.24
4 12 10 6 0.14 0.25
5 6 15 8 0.11 0.17
6 12 15 8 0.12 0.32
IX.
CONCLUSIONThe proposed integrated production-distribution model for the dynamic location-allocation problem considering volume flexibility is an effective response to the need of SCM considered to increase the ability of system against unpredictable conditions. This optimization process is based on a 3-layers SC system in multiple products and multiple periods’ perspective, which supports strategic and tactical decision levels, including volume flexibility, has not been proposed in the literature. The problem was modelled as a mixed integer linear programming formulation and determines location-allocation of DCs, production planning in plant, inventory level of products in each DC, and efficient volume flexibility in each period. The objective functions minimizes the costs of production, transportation and inventory holding while satisfying all customer demands, plant and DCs capacity and maximize flexibility level.
Furthermore, we have proposed a multi-objective frame work for differential evolution algorithm, namely MODE, to solve this NP-hard problem. To investigate the effectiveness of our proposed approach, computational experiments were conducted and comparison results with the well-known multi-objective genetic algorithm, namely NSGA-II, were provided based on two comparison metrics. The results clearly show that our MODE significantly outperforms the NSGA-II algorithm.
Future research is achieved on consideration of this modelling under uncertainty conditions with other critical SC problems such as vehicle routing, carriers loading, etc.
REFERENCES
[2] Davis T. Effective supply chain management. Sloan management review. 1993;34:35–35.
[3] Simchi-Levi D. Managing The Supply Chain: The Definitive Guide For The Business Professional Author: David Simchi-Levi, Philip Kaminsky. 2003 [cited 2013 Mar 11]; Available from: http://isbn.im/download/0071410317.pdf
[4] Bilgen B, Ozkarahan I. Strategic tactical and operational production-distribution models: a review. International Journal of Technology Management. 2004;28(2):151–71. [5] Gen M, Syarif A. Hybrid genetic algorithm for multi-time
period production/distribution planning. Computers & Industrial Engineering. 2005;48(4):799–809.
[6] Gebennini E, Gamberini R, Manzini R. An integrated production–distribution model for the dynamic location and allocation problem with safety stock optimization. International Journal of Production Economics. 2009;122(1):286–304.
[7] Thomas DJ, Griffin PM. Coordinated supply chain management. European journal of operational research. 1996;94(1):1–15.
[8] Jayaraman V, Pirkul H. Planning and coordination of production and distribution facilities for multiple commodities. European Journal of Operational Research. 2001;133(2):394–408.
[9] Liang T-F, Cheng H-W. Application of fuzzy sets to manufacturing/distribution planning decisions with multi-product and multi-time period in supply chains. Expert Systems with Applications. 2009;36(2):3367–77.
[10] Mula J, Peidro D, Díaz-Madroñero M, Vicens E. Mathematical programming models for supply chain production and transport planning. European Journal of Operational Research. 2010;204(3):377–90.
[11] Melo MT, Nickel S, Saldanha-Da-Gama F. Facility location and supply chain management–A review. European Journal of Operational Research. 2009;196(2):401–12.
[12] Slack N. The flexibility of manufacturing systems. International Journal of Operations & Production Management. 1987;7(4):35–45.
[13] Goicoechea A, Hansen DR, Duckstein L. Multiobjective decision analysis with engineering and business applications [Internet]. Wiley New York; 1982 [cited 2013 Mar 11]. Available from: http://www.getcited.org/pub/102147605 [14] Kariv O, Hakimi SL. An algorithmic approach to network
location problems. II: The p-medians. SIAM Journal on Applied Mathematics. 1979;37(3):539–60.
[15] Syarif A, Yun Y, Gen M. Study on multi-stage logistic chain network: a spanning tree-based genetic algorithm approach. Computers & Industrial Engineering. 2002;43(1):299–314. [16] Jayaraman V, Ross A. A simulated annealing methodology to
distribution network design and management. European Journal of Operational Research. 2003;144(3):629–45. [17] Yeh W-C. An efficient memetic algorithm for the multi-stage
supply chain network problem. The International Journal of Advanced Manufacturing Technology. 2006;29(7):803–13. [18] Storn R, Price K. Differential evolution–a simple and efficient
heuristic for global optimization over continuous spaces. Journal of global optimization. 1997;11(4):341–59.
[19] Biswas A, Das S, Abraham A, Dasgupta S. Design of fractional-order PI< sup> </sup> D< sup> </sup> controllers with an improved differential evolution. Engineering applications of artificial intelligence. 2009;22(2):343–50.
[20] Chauhan SS, Dolgui A, Proth JM. A continuous model for supply planning of assembly systems with stochastic component procurement times. International Journal of Production Economics. 2009;120(2):411–7.
[21] Ilonen J, Kamarainen J-K, Lampinen J. Differential evolution training algorithm for feed-forward neural networks. Neural Processing Letters. 2003;17(1):93–105.
[22] Storn R. System design by constraint adaptation and differential evolution. Evolutionary Computation, IEEE Transactions on. 1999;3(1):22–34.
[23] R\uu\vzek B, Kvasni\vcka M. Differential evolution algorithm in the earthquake hypocenter location. Pure and Applied Geophysics. 2001;158(4):667–93.
[24] Geoffrion AM, Graves GW. Multicommodity distribution system design by Benders decomposition. Management science. 1974;20(5):822–44.
[25] Cohen MA, Lee HL. Strategic analysis of integrated production-distribution systems: Models and methods. Operations Research. 1988;36(2):216–28.
[26] Schmidt-Supprian M, Bloch W, Courtois G, Addicks K, Israël A, Rajewsky K, et al. NEMO/IKKγ-deficient mice model incontinentia pigmenti. Molecular cell. 2000;5(6):981– 92.
[27] Cordeau J-F, Pasin F, Solomon MM. An integrated model for logistics network design. Annals of Operations Research. 2006;144(1):59–82.
[28] Vila D, Martel A, Beauregard R. Designing logistics networks in divergent process industries: A methodology and its application to the lumber industry. International Journal of Production Economics. 2006;102(2):358–78.
[29] De Matta R, Miller T. Production and inter-facility transportation scheduling for a process industry. European Journal of Operational Research. 2004;158(1):72–88.
[30] Park YB. An integrated approach for production and distribution planning in supply chain management. International Journal of Production Research. 2005;43(6):1205–24.
[31] Lei L, Liu S, Ruszczynski A, Park S. On the integrated production, inventory, and distribution routing problem. IIE Transactions. 2006;38(11):955–70.
[32] Rizk N, Martel A, D’Amours S. Synchronized production– distribution planning in a single-plant multi-destination network. Journal of the Operational Research Society. 2006;59(1):90–104.
[33] Tsiakis P, Papageorgiou LG. Optimal production allocation and distribution supply chain networks. International Journal of Production Economics. 2008;111(2):468–83.
[34] Feoktistov V. Differential evolution: in search of solutions [Internet]. Springer; 2006 [cited 2013 Mar 11]. Available from:
http://books.google.com.au/books?hl=en&lr=&id=kG7aP_v-SU4C&oi=fnd&pg=PA1&dq=Feoktistov,+2006&ots=a_lIf1z Z-w&sig=m11jmyTUPI8TjEhdlmrbUW8VkQ0
[35] Cohen MA, Moon S. An integrated plant loading model with economies of scale and scope. European Journal of Operational Research. 1991;50(3):266–79.