Natural Hazards and Earth System Sciences (2002) 2: 211–216 c
European Geosciences Union 2002
Natural Hazards
and Earth
System Sciences
Recalculation of an artificially released avalanche with SAMOS and
validation with measurements from a pulsed Doppler radar
R. Sailer1, L. Rammer1, and P. Sampl2
1BFW, Innsbruck, Austria 2AVL List GmbH, Graz, Austria
Received: 20 September 2001 – Revised: 30 January 2002 – Accepted: 31 January 2002
Abstract.A joint experiment was carried out on 10 February 1999 by the Swiss Federal Institute for Snow and Avalanche Research (SFISAR) and the Austrian Institute for Avalanche and Torrent Research (AIATR, of the Federal Office and Re-search Centre for Forests, BFW) to measure forces and ve-locities at the full scale experimental site CR ˆETA BESSE in VALL ´EE DE LA SIONNE, Canton du Valais, Switzerland. A huge avalanche could be released artificially, which per-mitted extensive investigations (dynamic measurements, im-provement of measurement systems, simulation model veri-fication, design of protective measures, etc.). The results of the velocity measurements from the dual frequency pulsed Doppler avalanche radar of the AIATR and the recalculation with the numerical simulation model SAMOS are explained in this paper.
1 Introduction
The overall aim of this study is the verification of the SAMOS simulation results with measured values, derived from pulsed Doppler Avalanche Radar. In the scope of avalanche dynamic investigations, measurements of pres-sures and velocities of avalanches have to be carried out for the validation and calibration of SAMOS (Snow Avalanche MOdelling and Simulation). At the end of the EC-Project “SAME” it was decided to maintain the cooperation of the involved European avalanche research organisations. In a concerted action, experiments have been carried out at the Swiss full scale avalanche experimental site CR ˆETA BESSE by SFISAR and AIATR. Dry snow avalanches can be re-leased after major snow falls by artificial triggering using explosives. Several measurement facilities are installed for recording the impact, the velocities and the flow height.
Correspondence to:R. Sailer ([email protected])
2 Avalanche path
The starting zone corresponding to the instrumented avalanche path consists of two major areas with ESE and SE aspects and an inclination between 30◦and 40◦(Fig. 1). The tracks are in the open slopes that pass into gullies from 2050 to 1800 m a.s.l., which are confined in the common runout zone with an inclination of 15–20◦. The maximum altitude is 2700 m a.s.l., the minimum altitude is 1300 m a.s.l., the av-erage inclination is 29◦and the monitored length of the site is 2.5 km.
3 SAMOS (Snow Avalanche MOdelling and Simula-tion)
SAMOS was developed for the Ministry of Agriculture and Forestry of Austria (BMLFUW) by AVL-List GmbH (Graz, Styria), the Department of Fluid Dynamics and Heat Transfer (Vienna University of Technology), the Service for Torrent and Avalanche Control (Austria) and the Austrian Institute for Avalanche and Torrent Research (BFW, Innsbruck, Ty-rol). It provides the calculation of dry snow avalanches with two distinct layers: i) a dense flow layer with bulk densities up to 400 kg/m3 and ii) a powder snow layer-cloud of rel-atively small ice particles suspended in air. Because of the completely different physical characteristics separate mod-els for both layers are developed. These modmod-els have to be coupled by an additional transition-model that describes the exchange of mass and momentum between the layers. A 2-D granular flow model for the dense flow layer and a 3-D tur-bulent flow model for the powder snow layer together with a simple transition model are used in SAMOS. The calcula-tion of the three-dimensional turbulent flow of the air-snow suspension is based on the CFD-program FIRE developed by AVL-List (Sampl et al., 2000; Schaffhauser and Sauermoser 1998).
parti-212 R. Sailer et al.: Recalculation of an artificially released avalanche
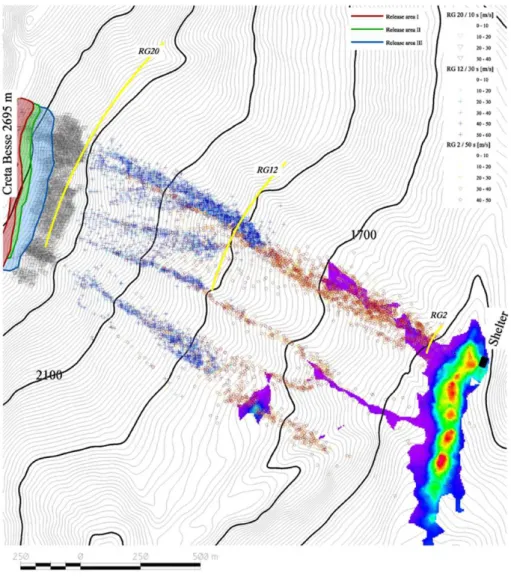
Fig. 1.Map of investigation area show-ing i) the velocities at RG 20, RG 12 and RG 2, ii) the release areas and iii) the avalanche deposition (red>9 m).
cle diameter which is responsible for the suspension of snow particles into the powder snow layer and iii) snow density of the dense flow layer. The latest model version allows the definition of entrainment areas with the specification of snow density, snow depth and the area of the possible entrainment layer. The velocity of the avalanche controls how much of the entrainable snow mass will be incorporated into the pow-der snow layer. More details of SAMOS and the Snow En-trainment Model are described in the Appendix. The snow entrainment module was implemented in the calculation of the Creta Besse Avalanche of 10 February 1999.
3.1 The input parameters
The total release area was subdivided into three parts with different snow depths and a snow density of 220 kg/m3(cf. Table 1 and Fig. 1). Due to a typical inclination of about 37◦ this results in a total flow mass of 35 kt.
As described above the entrainment module was used. Simulations have been carried out for two different depths of entrainable snow: i) 0.5 m and ii) 1.0 m. Along the entire avalanche path it is assumed that the specified depth (0.5 m
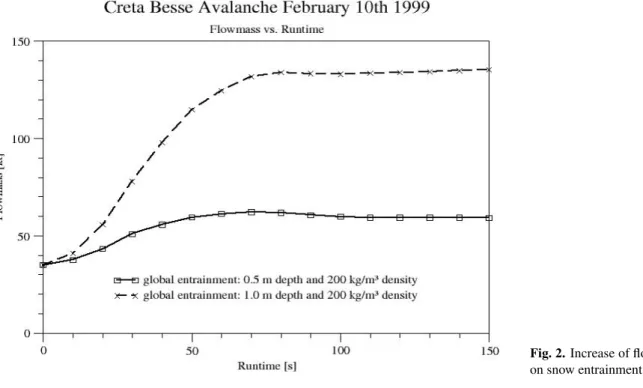
or 1.0 m, density 200 kg/m3) is provided to be ploughed-in (cf. Appendix and Fig. 6). The total flow mass including the entrained snow increases to 59 kt at 0.5 m depth and 135 kt at 1.0 m depth, respectively (Fig. 2). The chosen particle diam-eter is 1 mm (BMLF, 1999). The topographical basis in the calculation is a detailed digital elevation model with a reso-lution better than 5.0 m which has been produced from areal photographs (Issler, 1999).
4 The technical principle of the dual frequency INW Pulsed Doppler Radar
The Pulsed Doppler Avalanche Radar is an instrument to measure dynamic characteristics of distributed targets like snow avalanches, i.e. spatially and temporally resolved ve-locities and turbulence parameters.
R. Sailer et al.: Recalculation of an artificially released avalanche 213
Fig. 2.Increase of flowmass dependent on snow entrainment depth.
Table 1.Release area specification of Creta Besse Avalanche of 10 February 1999 (values and release area – SFISAR, February 1999)
release area snow depth snow density area perimeter I 0.9 m 220 kg/m3 31006 m2 1572 m II 2.0 m 220 kg/m3 19667 m2 1378 m III 1.2 m 220 kg/m3 50364 m2 1531 m
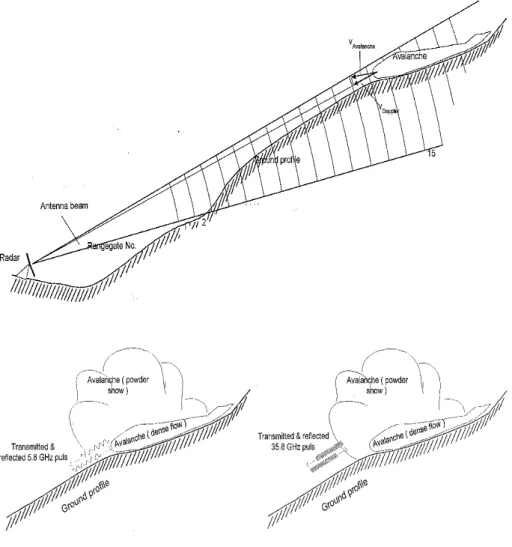
or moving snow. Due to the special operating principle of a Doppler Radar not only distances but also velocities can be measured. This is accomplished by a quasi-simultaneous acquisition of Doppler frequencies (i.e. the received sig-nal’s frequency shift against the transmitted signal, which is proportional to the reflecting objects velocity relative to the radar antenna) from a number of adjacent sections along an avalanche path (Fig. 3). This process is called range gating and allows the spatial discrimination of echo intensity, ve-locity and turbulence parameters in the top-down direction. The shortest possible length of a range gate in the presently implemented radars is 50 m.
The range gating allows the determination of the evolu-tion of the flow in time and also along the avalanche path. The use of two frequencies (C-band: 5.8 GHz and Ka-band: 35.8 GHz) is necessary since electro-magnetic waves of dif-ferent wavelengths interfere difdif-ferently with the dense-flow and the powder-snow parts of avalanches. A short wave-length (that is, high frequency) is needed to obtain reflections from the small snow and ice particles of the powder-snow cloud (Fig. 4).
5 Results
214 R. Sailer et al.: Recalculation of an artificially released avalanche
Fig. 3.The principle of range gating.
Fig. 4. Operation principle of the dual frequency radar (left – Beam 1: C-band, 5.8 GHz; right – Beam/,2: Ka-band, 35.8 GHz.
setup of the radar beams, velocities could only be evaluated at distances less than 2050 m from the antenna. But within this range there is a continuous measurement up to 50 m dis-tance from the shelter available. Ninety-three time-frames have been recorded in 74.42 s.
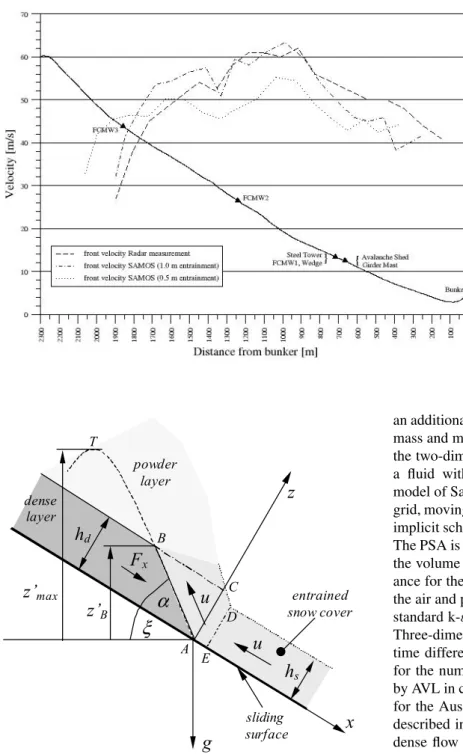
In general the version with 1.0 m global entrainment depth shows a better agreement with the measured values from Doppler Avalanche Radar. The calculated front velocities between 750 m to 1400 m from bunker (Fig. 5) differ about ±10% from the measured values. In the upper part (>1400 m from bunker) of the avalanche track the SAMOS velocities are too high, whereas in the runout zone the calculated veloc-ities are too low. In the runout zone snow from a previously released avalanche had been deposited. We assume that these deposits have not been entrained by the observed avalanche due to their relatively high snow density. For the simulation the entrainable snow depth was prescribed globally, so snow was also ploughed-in in this area. This retards the simulated avalanche and might explain the lower front velocities com-puted in the runout zone (Fig. 5). The differences between the measured and the calculated front velocities under the assumption of 0.5 m global entrainment depth are within a range of 20%.
6 Conclusions
The velocity measurement of a powder-snow avalanche by means of a dual frequency pulsed Doppler radar provides a good estimate of the distribution of the velocities along the avalanche track. The comparison of the measured values of the Pulsed Doppler Radar with the simulated values are good in agreement. The measurements derived from Radar differ between less than 10% to 20%, dependent on the chosen en-trainment depth. The global enen-trainment depth of 1.0 m with a density of 200 kg/m3which marks up the total flow mass of about 100 kt gives the better fit to the measurements. Accord-ing to information from SFISAR (oral communication with B. Sovilla) this figure is in a reliable range. The average front velocity at the central section of the avalanche track with about 55 m/s is good in agreement with video measurements carried out by SFISAR. Seeing that the numerical simulation with SAMOS is only an image of the real avalanche process, the results agree very well with two differently gained mea-surements.
R. Sailer et al.: Recalculation of an artificially released avalanche 215
Fig. 5. Front velocities from radar measurement and SAMOS calculation along the avalanche track.
A
B
E
ξ
z’
Bh
du
α
z’
maxF
xg
u
h
sz
x
CD dense
layer
powder layer
entrained snow cover
sliding surface T
Fig. 6.Snow entrainment at the front of the dense avalanche layer.
Appendix A The SAMOS Snow Entrainment Model
The avalanche simulation model SAMOS distinguishes be-tween the two flow-layers in a dry snow avalanche. A dense flow avalanche layer (DFA) with bulk densities up to 400 kg/m3 is in general superposed by a cloud of relatively small ice particles suspended in air, the powder snow layer (PSA). The density of this suspension is one order of magni-tude smaller than that of the DFA. Because of the completely different physical characteristics, separate models for the lay-ers are employed in SAMOS. The models are coupled by
an additional transition-model that describes the exchange of mass and momentum between the layers. In the DFA-model the two-dimensional shallow-water equations are solved for a fluid with Mohr-Coulomb-like rheology (following the model of Savage and Hutter, 1989). A triangular Lagrangian grid, moving with the avalanche along the surface, and a semi implicit scheme in time is used for the numerical integration. The PSA is treated as a fluid of variable density, according to the volume fraction of snow particles. One momentum bal-ance for the bulk suspension and separate mass balbal-ances for the air and particle phases are solved in three dimensions. A standard k-εmodel is used to account for turbulent friction. Three-dimensional grids with hexahedral elements, implicit time differencing and upwind-differencing in space is used for the numerical solution. The model has been developed by AVL in cooperation with the Technical University Vienna for the Austrian Ministry of Agriculture and Forestry. It is described in Sampl and Zwinger (1999). The details of the dense flow and transition models are described in detail in Zwinger (2000). The snow-entrainment module was added later and has not yet been published. A short description is given below.
The entrainment process considered is not erosion at the sliding surface of the avalanche but a “ploughing-in” of the resting snow in front of the dense flow avalanche layer. Fig-ure 6 shows in a vertical cut perpendicular to the front line on the 3-D-terrain model, the dense layer and the snow cover that will be entrained (entrainable snow heights and snow densities have to be prescribed as boundary conditions for the model).
216 R. Sailer et al.: Recalculation of an artificially released avalanche flow front face. We assume that the front face angle to the
horizontal equals the internal friction angle8of the dense layer snow material (about 35◦in our model), i.e.α+ζ =8, ifζ < 8. Otherwise, a vertical front is assumed, i.e.α+ζ = π/2. A local coordinate system (x, z), withzperpendicular to the surface, that moves with the avalanche is applied. In this system the entrained snow hits the front with the velocity u. At the front the entrained snow flux is deflected and is assumed to flow parallel to the front face. The entrainment-mass-flow is given by
˙
m=ρuwhs,
withρ the density of the entrained snow and w the front width normal to thex−z-plane. In general, one part of the mass flow (fractionfd) will be received by the dense layer and the rest by the powder layer:
˙
m= ˙md+ ˙mp ˙
md=fdm˙ ˙
mp =(1−fd)m˙ .
wherefd is determined heuristically as described later. At point A (see Fig. 6) the entrained snow moves with velocity u, at point B withuB. The Bernoulli equation, applied to A−B, reads
ρu 2
2 +pA=ρ u2B
2 +pB+hd
sin(α+ζ ) sinα ρg,
if we neglect frictional losses. If we further assumepA = pB, (the pressure in the resting snow cover and at the dense flow surface should be equal to the atmospheric pressure) then
ub=
u2−2hd
sin(α+ζ ) sinα g
1/2 .
follows. If the discriminant in this equation is negative,ub is assumed to be zero and the entire mass is assumed to be received by the dense layer (fd =1). A forceFx is needed to deflect the entrainment-mass-flow and acts as resistance to the dense layer flow. Fxis determined from the momentum balance in x-direction for the control volume A-B-C-D-E-A. Fxwhd= ˙m(u−uBcosα)−wAABCDEρg sinζ
AABCDE is the area enclosed by the control-polygon. The corresponding force iny-direction increases the bottom pres-sure at the DFA-front but is neglected in the model. The mo-mentum vectorid= ˙mdubacts on the DFA and decelerates it because the entrained mass has to be accelerated to the DFA-velocity. Accordingly, the momentumip = ˙mpubis trans-ferred to the powder snow layer. Generation of turbulence-energy due to the entrainment is not taken into account. Fi-nally, the mass flow fractionfd has to be determined. Ob-viously, the higheruis, the more of the entrained mass will go up into the powder layer. From simple dimensional anal-ysis the flow fraction must be a function of the height ratio
hd/ hs, the ratio of the densities in the dense flow layer and snow cover, and the Froude number
F r = u 2 2ghd
.
We decided to use the following ratio of the height of the dense layer to the maximal height the entrained snow can reach for the mass flow fraction
fd=min z′ B z′ max ,1
by the global mass balance values offd are limited to the range (0,1). The vertical heightzBof pointBabove pointA is given by
z′B=hd
sin(α+ζ ) sinα
and the maximal heightzmax of the snow-entrainment-flow above A is obtained from applying the Bernoulli equation fromAtoT, neglecting friction and assuming same pressure atAandT:
ρu 2 2 =z
′
maxρg+ρ
u cos(α+ζ )2 2
This equation can be rewritten so thatF r appears explicitly, so thatzmaxreflects the dependency on the Froude number. Acknowledgements. The radar measurements were done with our colleagues from the Swiss Federal Institute for Snow and Avalanche Research (SFISAR). They also supplied the preliminary results from the video analyse of the avalanche from 10 February 1999. The suggestions of two anonymous reviewers have been very help-ful in the final stage of the paper and also the comments from Th. Zwinger. We are grateful for their support.
References
BMLF: SAMOS Handbuch (SAMOS manual), unpublished, 1999. Issler, D.: European Avalanche Test Sites, Overview and Analysis in View of Coordinated Experiments, Mitteilungen 59, 1999 Eid-gen¨ossisches Institut f¨ur Schnee- und Lawinenforschung, Davos, 1999.
Rammer, L.: Velocity measurements of avalanches by a Pulsed Doppler Radar, IUFRO International Workshop: Hazard Map-ping in Avalanching Areas, Proceedings: 102–120, 2000. Sampl, P. and Zwinger, T.: A simulation model for dry snow
avalanches, Proc. XXVIII IAHR Congress, 22–27 August 1999, Graz, D. 10, 287, 1999.
Sampl, P., Zwinger, T., and Schaffhauser, H.: Evaluation of Avalanche Defense Structures with the simulation Model SAMOS, Rock and Soil Engeneering, 1/2000: 41–46, 2000. Savage, S. B. and Hutter, K.: The motion of a finite mass of
granu-lar material down a rough incline, J. Fluid Mech. 199, 177–215, 1989.
Schaffhauser, H. and Sauermoser, S.: Practical Experience with the Austrian Powder Avalanche Simulation Model in Hazard Zon-ing, 25 Years of Snow and Avalanche Research. NGI, Oslo, 229– 233, 1998.