Preliminary Design of a LSA Aircraft Using Wind Tunnel
Tests
Norbert ANGI*
,1, Angel HUMINIC
1*Corresponding author
1Aerodynamics Laboratory, Transilvania University of Brasov, 29 Bulevardul Eroilor, Brasov 500036, Romania norbert.angi@student.unitbv.ro*, angel.h@unitbv.ro
DOI: 10.13111/2066-8201.2015.7.4.3 Received: 05 October 2015 / Accepted: 14 November 2015
Copyright©2015 Published by INCAS. This is an open access article under the CC BY-NC-ND license (http://creativecommons.org/licenses/by-nc-nd/4.0/)
The 36th“Caius Iacob” Conference on Fluid Mechanics and its Technical Applications
29 - 30 October, 2015, Bucharest, Romania, (held at INCAS, B-dul Iuliu Maniu 220, sector 6) Section 1. Aerodynamic Design
Abstract: This paper presents preliminary results concerning the design and aerodynamic
calculations of a light sport aircraft (LSA). These were performed for a new lightweight, low cost, low fuel consumption and long-range aircraft. The design process was based on specific software tools as Advanced Aircraft Analysis (AAA), XFlr 5 aerodynamic and dynamic stability analysis, and Catia design, according to CS-LSA requirements. The calculations were accomplished by a series of tests performed in the wind tunnel in order to assess experimentally the aerodynamic characteristics of the airplane.
Key Words: aircraft design, Computer Aided Design, aerodynamics, wind tunnel
1. INTRODUCTION
The aircraft development process consists in the following main steps: market analysis and customer requirements, mission specifications, conceptual and preliminary design, detailed design, prototype manufacturing, flight test, and finally the aircraft production. In the first stage, the aircraft structure is defined as concept, without precise calculations. Thus, the preliminary design phase tends to employ the outcomes of a calculation procedure. As the name implies, the initial parameters, which are established in this step, will be optimised during next stages of the design. Hence, the initial parameters have a significant influence on the detail design phase. These parameters are also used as input data to the 3D modelling of the aircraft, the base shape being one of the main results of the preliminary design. In a modern design process, the 3D model of the aircraft plays a crucial role.
The base design of the studied aircraft, see Figures 1, 2 and 3 was also made by studying several airplanes in the same class of regulations CS-LSA [1], e.g. Flight Design CTLSi,
Czech Sport Aircraft, Evektor Harmony.
These were analysed according to the general configuration, specific fuel consumption, flight range and main aerodynamic performances.
The preliminary design of the airplane was made with the aid of Advanced Aircraft Analysis (AAA), DARcorporation [2], a state of the art software in the field of aircraft design and analysis, and XFLr 5 [3] software.
Fig. 2 - 3D view of the airplane - Details
The airplane, named Sky Dreamer [4], has the general characteristics shown in Table 1.
Table 1 - General characteristics of the airplane
Parameter Value
Crew Two
Empty weight Max. Take-off
315 kg 600 kg Fuel capacity 100 L Engine Rotax 912iS Maximum speed Cruising speed 290 km 205 km/h Operational Range 1650 km Service ceiling 5500 m
Length 6.45 m
Wing Area 11.5 m2 Wingspan 10.2 m Fig. 3 - Top, Front and Lateral views of the airplane Wing Airfoil Eppler 562 [5] In the first stage, the aerodynamic characteristics of the airplane were assessed for the following conditions: cruise flight with gear up at 3000 m in the following atmospheric conditions: temperature = − . ° , pressure = / , density 𝜌 = . 𝑔/ and dynamic viscosity𝜇 = . ∙ − 𝑔/ .
The characteristic Reynolds number computed with the mean aerodynamic chord
𝐴 = . was 𝑒 = . ∙ .
Fig 4 - Preliminary results according to XFLr 5 [3]
Fig. 5 - Preliminary results according to AAA [2]
According to [2], the relationship between drag and lift is expressed by the following equation.
𝐷= . + . 𝐿. (1)
2. WIND TUNNEL TESTS
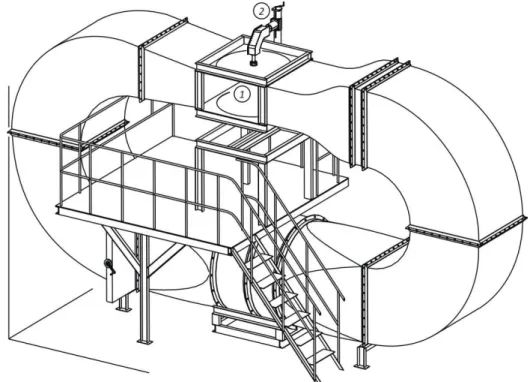
Fig. 6 - Axonometric view of wind tunnel test section and (2) aerodynamic (strain-gauge) balance
The aerodynamic strain-gauge balance used for measurements consists of a sting (used to support the model), the arm of thebalance and two elastic elements (thin walls tubes), which are fixed on a frame. Details are shown in Figure 7.
Fig. 7 - The model within the wind tunnel test section
The aerodynamic forces (𝐹) which are acting on the studied model are transmitted to the elastic elements and their deformations are taking over by the strain gages, which are glued on the elastic tubes. Finally, they are transmitted to the recording system which converts them into electrical signals, the values of the latter ones being displayed by the system of data acquisition.
model and the values of the signals, lift ( ) and drag ( ), displayed by the data acquisition system
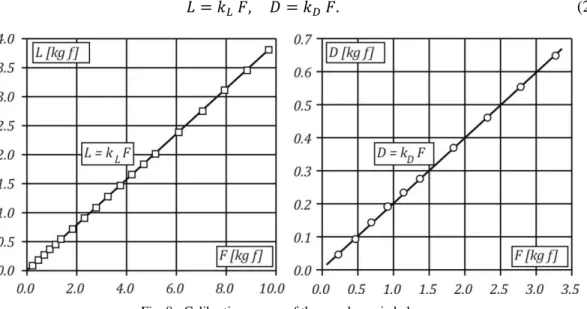
= 𝐿 𝐹, = 𝐷 𝐹. (2)
Fig. 8 - Calibration curves of the aerodynamic balance
In order to achieve variations of aerodynamic coefficients lower than 1e-03, thereby satisfying SAE requirements as stated in [5] (∆ 𝐷≤ ± . ), the sensitivity of the balance was set for the following values of calibration factors: 𝐿= . and 𝐷= . .
3. RESULTS
After the calibration process of the balance, the model was tested for various values of the angle of attack (𝛼).
The parameters of the airstream in the test chamber of the wind tunnel were the following: temperature = ° , pressure = / , density 𝜌 = . 𝑔/ and dynamic viscosity 𝜇 = . ∙ − 𝑔/ .
The characteristic Reynolds number computed with the mean aerodynamic chord
𝐴 = . was 𝑒 = . ∙ (v =34 m/s).
The results are shown in Figure 9 after the following wind tunnel boundary corrections according to [8].
a) Solid blockage correction: there were applied corrections for wing and body, as
following:
𝑤 = ∗𝜏 ∗ Va/ = . − (3)
𝑏 = ∗τ ∗ Vf/ = . − (4)
= + = . − (5)
b) Wake blockage correction: the complete wake blockage results for a
ΔCDwi g= ∗τ ∗ Va/ ∗ = . − (6)
ΔCD dy = ∗τ ∗ Vf/ ∗ = . − (7)
t t l= ∗ ∗ + ∗∗ ∗( − 𝑖− )= − . (8)
where
= − 𝐴 − 𝐴 ∗ α = . (9)
where, A1 and A2 are constants
𝑖 = 𝐴 ∗ − 𝐴 ∗ α = . (10)
Also the measurements in the wind tunnel must meet the following condition:
𝜀t t l= 𝐴∗ < . %𝑘 (11)
where Ak is the model front area and C the test section area. According to the wind tunnel analysis the value of 𝜀t t l ranges between 4.3027 and 6.8971 / varies from4.3027 to 6.8971, which respects the prescribed condition:
c) Correction on the angle of attack and drag coefficient
Δαw= ∗ ∗ (12)
ΔCDw= ∗ ∗ (13)
d) Dynamic pressure correction
= 𝐴 ∗ [ + T ] (14)
where qA is obtained from tunnel calibration.
4. CONCLUSIONS
According to the preliminary results, the studied airplane has ≈ . % higher aerodynamic performances comparatively to the top light sport aircrafts, in the same class of regulations CS-LSA.
Due to the higher aerodynamic performance it results lower fuel consumption and ≈10% higher flight range.
The errors between the preliminary calculation using software tools and the wind tunnel analysis were ≈ %. In order to check the current results, another model with a different fastening system and a lower interference for the tested model will be analyzed.
REFERENCES
[1] * * * EASA, Certification Specification and Acceptable Means of Compliance for Light Sport Aeroplanes, CS-LSA, European Aviation Safety Agency, 2013
[2] J. Roskam, Airplane Design, Part I. Preliminary Sizing of Airplanes, University of Kansas, 1985. [3] * * * XFlr5, http://www.xflr5.com/xflr5.htm.
[4] N. Angi, R. Udroiu, Design of a LSA aircraft using advanced software, International Conference of Scientific Papers - AFASES 2015.
[5] R. Eppler, Airfoil Design and Data, Springer Verlag, Berlin, 1990.
[6] * * * SAE, Aerodynamic Testing of Road Vehicle - Testing Methods and Procedures, SAE Information Report SAE J2084 JAN93, 1993.
[7] A. Huminic, G. Huminic, CFD Study Concerning the Influence of the Underbody Components on Total Drag for a SUV, SAE Technical Paper 2009-01-1157, 2009.

![Fig 4 - Preliminary results according to XFLr 5 [3]](https://thumb-eu.123doks.com/thumbv2/123dok_br/16345810.189215/3.744.115.632.68.717/fig-preliminary-results-according-xflr.webp)