www.atmos-meas-tech.net/7/4341/2014/ doi:10.5194/amt-7-4341-2014
© Author(s) 2014. CC Attribution 3.0 License.
Atmospheric aerosol characterization with a ground-based SPEX
spectropolarimetric instrument
G. van Harten1, J. de Boer1, J. H. H. Rietjens2, A. Di Noia2, F. Snik1, H. Volten3, J. M. Smit2, O. P. Hasekamp2, J. S. Henzing4, and C. U. Keller1
1Leiden Observatory, Leiden University, Leiden, the Netherlands
2SRON Netherlands Institute for Space Research, Utrecht, the Netherlands
3Centre for Environmental Quality, National Institute for Public Health and the Environment (RIVM),
Bilthoven, the Netherlands
4Netherlands Institute for Applied Scientific Research – TNO, Utrecht, the Netherlands
Correspondence to:G. van Harten ([email protected])
Received: 29 April 2014 – Published in Atmos. Meas. Tech. Discuss.: 6 June 2014 Revised: 10 October 2014 – Accepted: 30 October 2014 – Published: 10 December 2014
Abstract.Characterization of atmospheric aerosols is impor-tant for understanding their impact on health and climate. A wealth of aerosol parameters can be retrieved from multi-angle, multi-wavelength radiance and polarization measure-ments of the clear sky. We developed a ground-based SPEX instrument (groundSPEX) for accurate spectropolarimetry, based on the passive, robust, athermal, and snapshot spec-tral polarization modulation technique, and is hence ideal for field deployment. It samples the scattering phase func-tion in the principal plane in an automated fashion, using a motorized pan/tilt unit and automatic exposure time de-tection. Extensive radiometric and polarimetric calibrations were performed, yielding values for both random noise and systematic uncertainties. The absolute polarimetric accuracy at low degrees of polarization is established to be ∼5×10⁻³. About 70 measurement sequences have been performed throughout four clear-sky days at Cabauw, the Netherlands. Several aerosol parameters were retrieved: aerosol optical thickness, effective radius, and complex refractive index for fine and coarse mode. The results are in good agreement with the colocated AERONET products, with a correlation coef-ficient ofρ=0.932 for the total aerosol optical thickness at
550 nm.
1 Introduction
Atmospheric aerosols, also known as particulate matter, are particles or droplets suspended in the air. Some types are nat-urally occurring, such as pollen, spores, sea salt, desert dust,
and volcanic ash, whereas others are mostly anthropogenic, such as sulfates, nitrates, soot, smoke, and ashes from com-bustion or forest fires, or ammonia salts from agriculture.
Studying aerosols and their spatial and temporal distribu-tion is of great importance because of their impact on health and climate. Exposure to fine particulate air pollution can trigger asthma attacks and lead to lung diseases, and is as-sociated with natural-cause mortality (Beelen et al., 2014). Health effects are usually worse for smaller particles, be-cause they can penetrate deeper into the lungs. Since an-thropogenic aerosols are generally smaller than their natural counterparts, air-polluted areas are not only dangerous be-cause of the larger amount of particles. The toxicity is also dependent on the particles’ shape (sharpness, surface area) and chemical composition.
verifica-tion of climate models and atmospheric chemistry transport models uncertain.
Atmospheric aerosol measurements from the ground are either performed in situ or as remote sensing. The most prevalent in situ measurement method is the following:
– Particulate matter (PM) monitoring: air is sucked
through sampling heads that let particles pass which have a diameter smaller than, for example, 10 or 2.5µm
(referred to as PM10 and PM2.5, respectively). The ac-cumulated particles are manually weighed (reference method) or quantified using their attenuation of beta ra-diation (automated method) (e.g., McMurry, 2000). The chemical composition can be determined through lab analysis.
Remote sensing of aerosols often involves the following techniques:
– Lidar: a laser pulse is sent into the atmosphere, after
which the arrival times and intensities of the backscat-ter are measured. This results in altitude profiles of the aerosol extinction coefficient. The employment of multiple wavelengths provides the Ångström exponent, an indicator for particle size. An optional depolariza-tion measurement provides informadepolariza-tion on the aerosol type (e.g., Murayama et al., 1999).
– Direct-sun measurements: the extinction of the direct
solar beam is measured and then translated into an aerosol optical thickness (AOT). The wavelength de-pendence of the AOT is an indicator of particle size distribution (O’Neill et al., 2003). Regular instrument calibrations on high mountains provide the top-of-atmosphere irradiance (Holben et al., 1998).
– Diffuse-sky measurements: sunlight scattered in the
at-mosphere is measured at multiple angles and wave-lengths, and compared with radiative transfer calcula-tions in model atmospheres. A variety of aerosol pa-rameters can be retrieved, e.g., optical thickness, size distribution, and complex refractive index, indicative of chemical composition (e.g., Dubovik and King, 2000). The added value of polarization measurements has been shown for satellite geometry by Mishchenko and Travis (1997), Mishchenko et al. (2004), and Hasekamp and Landgraf (2007), and for ground-based geometry by Boesche et al. (2006) and Li et al. (2009). The advantage of this method is that it provides fast and cost-effective measurements of macro- and microphys-ical aerosol parameters that are essential for climate and health studies and may be related directly to other ground-based measurements as well as aerosol optical thickness retrieved from satellite data.
With our groundSPEX instrument, we aim at perform-ing multi-angle multi-wavelength diffuse-sky radiometry and polarimetry with sub-percent absolute polarimetric accuracy. The novel spectropolarimetric technique is intrinsically accu-rate, which is essential for constraining, for example, aerosol chemical composition. In this paper we describe this tech-nique, the instrument design, and its calibration, including the radiometric and polarimetric performance. Furthermore, we present clear-sky measurements and the retrieved aerosol parameters, and compare those to the colocated AERONET data and aerosol products.
2 Measurements
2.1 GroundSPEX instrument
The measurements are performed with a dedicated ground-based version of the SPEX instrument for satellite-ground-based at-mospheric aerosol characterization (van Harten et al., 2011). This instrument measures the spectral radiance and linear po-larization of skylight using spectral popo-larization modulation. In this technique, a carefully selected combination of bire-fringent crystals with a total retardance of δ in front of a
polarizer encodes the degree (PL) and angle (φL) of linear
polarization as the amplitude and phase (ψ) of a carrier wave
in the intensity spectrumI0according to Snik et al. (2009):
S±(λ) = 1
2I0(λ) h
1±PL(λ)cos ψ (λ)i, (1a)
ψ (λ) ≡ 2π δ (λ)
λ +2φL(λ) . (1b)
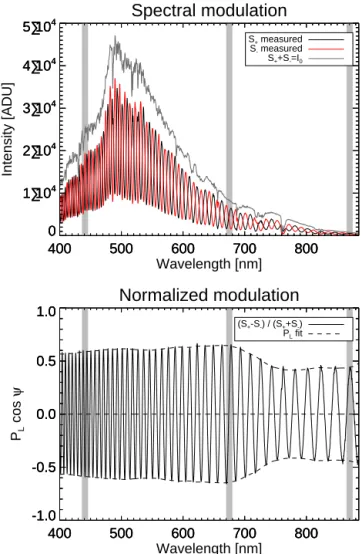
A single spectroscopic measurement thus provides the full spectral intensity and linear polarization information, as shown in Fig. 1. The groundSPEX snapshot polarimetry is insensitive to temporal variations of the scene, such as mov-ing (cirrus) clouds or flymov-ing objects, whereas, for exam-ple, a rotating-polarizer setup as employed by AERONET’s CIMEL sun photometers is intrinsically susceptible to spu-rious polarization signals. Spectral polarization modulation requires no moving or active polarization modulation op-tics, thereby providing robustness that is ideal for field de-ployment. Furthermore, groundSPEX spectropolarimetry en-ables the measurement of intensity and polarization in spec-tral bands, like the oxygen A absorption band, which enables retrieval of aerosol stratification (van Harten et al., 2014b).
The spectral polarization modulation is created using the following static arrangement of optical elements:
– Achromatic quarter-wave retarder with fast axis at 0◦ (horizontal): incoming linear polarization at 45◦is
400 500 600 700 800 0
1•104
2•104 3•104 4•104
5•104
Spectral modulation
400 500 600 700 800
Wavelength [nm] 0
1•104
2•104 3•104 4•104
5•104
Intensity [ADU]
S+ measured
S- measured
S++S-=I0
S+ measured
S- measured
S++S-=I0
400 500 600 700 800
0 1•104
2•104 3•104 4•104
5•104
400 500 600 700 800
-1.0 -0.5 0.0 0.5 1.0
Normalized modulation
400 500 600 700 800
Wavelength [nm] -1.0
-0.5 0.0 0.5 1.0
PL
cos
ψ
(S+-S-) / (S++S-)
PL fit
(S+-S-) / (S++S-)
PL fit
400 500 600 700 800
-1.0 -0.5 0.0 0.5 1.0
Figure 1.Top: the groundSPEX instrument measures the two
per-pendicularly modulated spectraS+andS−simultaneously. The
de-gree (PL) and angle (φL(ψ) of linear polarization are encoded as
the relative amplitude and phase of the modulation pattern, retively. The sum of the two modulated spectra is the intensity spec-trumI0at full resolution. Bottom: curve fits ofPLcosψto the
nor-malized modulation in a moving window provide the spectral po-larization information. Note the decrease in popo-larization at 550 nm and above 700 nm, due to the increase in the albedo of grass, called the green bump and red edge, respectively. Note also that the strong oxygen A absorption band around 765 nm is clearly visible in the intensity spectrum (top plot), whereas it has no impact on the nor-malized modulation pattern (bottom plot). The grey vertical bands indicate the wavelength bins that have been used for retrieving the aerosol parameters, matching the spectral bands of the colocated AERONET sun photometer, viz. 441, 675, and 870 nm, all with a full width at half maximum of 10 nm.
of 2 % across the visible wavelength range. Calibration of misalignment and retardance deviation is described in Sect. 2.2.4.
– Multiple-order retarder with fast axis at 45◦: the
ellip-ticity of the incoming polarization is modulated in a strongly wavelength-dependent way using birefringent
crystals. A subtractive combination of 1.63 mm quartz
and 3.83 mm magnesium fluoride creates∼43
modula-tion periods within 400–900 nm, with the size of a pe-riod ranging from∼5 to 25 nm from the blue to the red end, respectively. For this crystal combination, manu-factured by B. Halle, the thermal dependence of the re-tardance of the individual crystals largely cancels out: for a temperature range of±20 K the measurement of the angle of linear polarization is stabilized to within ±1.5◦. Section 2.2.4 shows that this has a negligible
impact on the degree of linear polarization, our main observable.
– Polarizing beam splitter, splitting linear polarization at 0 and 90◦: this analyzer turns the ellipticity modulation into a sinusoidal spectral intensity modulation, accord-ing to Eq. (1a). Each beam out of the polarizaccord-ing beam splitter, denoted by the+and−signs in Eq. (1a), car-ries the full linear polarization information, but their modulations are exactly out of phase (see Fig. 1). In this way, the sum of the two beams yields the unmodulated intensity spectrumI0at full resolution. The redundancy
in the both spectrally and spatially modulated polariza-tion is used for a post facto differential transmission cor-rection (van Harten et al., 2014b). This corcor-rection typi-cally decreases the associated error in the degree of lin-ear polarization by an order of magnitude. Moreover, this quasi-beam-exchange technique strongly reduces the polarimetric errors due to uncorrected dark signal. The polarizing beam splitter is a calcite Foster prism from Melles Griot, with an extinction ratio of 10−5.
The two beams out of the polarizing beam splitter are focussed onto 550 µm fibers by 35 mm focal length lenses, yielding a field of view of 0.9◦, with an entrance aperture of 1 cm2. The fibers are fed into two synchronized
spectro-graphs from Avantes, both equipped with a 3648-pixel, 16 bit CCD detector; 600 line mm−1reflection grating; and a 25 µm entrance slit, resulting in a wavelength range of 360–910 nm at 0.8 nm resolution, using an order-sorting filter. The optics and spectrographs are positioned in an IP66 weatherproof camera housing from 2B Security, together with the laptop that is controlling the spectrograph and motorized pan/tilt mount. The laptop can connect to a computer network using LAN or Wi-Fi, after which a remote desktop connection can be established to control the instrument from anywhere. A fused silica entrance window behind a 15 cm long entrance tube protects the optics and electronics from rain, and pro-vides stray light baffling. The IP66 pan/tilt mount from 2B Security rotates at a speed of 50◦s−1 in the azimuth and
20◦s−1in the altitude direction, with electronic position
ac-curacies of 0.01 and 0.006◦, respectively.
time (10 ms), which is subsequently extrapolated to deter-mine the exposure time for a desired intensity value. Typical exposure times are 50–200 ms, and 50 spectra are averaged for a signal-to-noise ratio of>370 per pixel to enable
spec-tral line polarimetry with a sensitivity of at least 2.7×10⁻³,
so the measurement cadence is about 10 s. Note that this pa-per does not deal with line polarimetry, but with continuum polarimetry in 10 nm wide bands, resulting in a polarimetric noise of only 10−4.
2.2 Calibrations
Several calibrations need to be performed before the data can be fed into the aerosol retrieval algorithm. Moreover, a care-ful quantification of the measurement errors and their statis-tics is crucial to obtain reliable error bars on the retrieved aerosol parameters.
2.2.1 Wavelength calibration
The wavelength calibration of the spectrographs is performed using a mercury/argon line lamp fiber-connected to the spec-trographs. Nine spectral lines have been identified across the spectrum, and a third-order polynomial relates each detector pixel to a wavelength. The root-mean-square deviation be-tween the theoretical line wavelengths and the calibrated val-ues is 0.01 nm. The spectra of one spectrograph are matched to the wavelengths of the other spectrograph using linear in-terpolation.
2.2.2 Detector dark signal
The instrument is usually exposed to direct sunlight, and the detector is uncooled, so a careful dark-current subtrac-tion is important. The dark current cannot be measured dur-ing a measurement sequence, because the instrument is not equipped with a mechanical shutter. Therefore, the dark cur-rent was characterized offline as a function of exposure time and temperature, using the built-in temperature sensor. A typ-ical detector temperature range during a day is 20–40◦C. It was found that the bias strongly decreases with increas-ing temperature (from 1000 to 400 analog-to-digital units (ADU)); for shorter exposure times the dark current increases linearly with exposure time, and at a higher rate for higher temperatures, but for exposure times above 100 ms the in-crease with exposure time gets strongly suppressed, with this nonlinearity being worse for higher temperatures. For each pixel, a fourth-degree two-dimensional polynomial was fitted to the dark calibration measurements, providing a continuous correction model (see Fig. 2).
The root-mean-square deviation between the model and the calibration measurements is 9 ADU for each pixel. Al-though these residuals are centered around zero, it is not ran-dom noise; it shows dependencies on temperature and expo-sure time. This is presumably a side effect of the calibration method: the exposure time was repeatedly increased from 1
20 25 30 35 40
0 50 100 150 200 250 300
20 25 30 35 40
Temperature [°C] 0
50 100 150 200 250 300
Exposure time [ms]
Bias + dark current [ADU]
500 600
700800
900
900
1000
1000
1100
1100
1200
1200 1300
1300 1400
1400
1500
1500
1600 1700
20 25 30 35 40
0 50 100 150 200 250 300
Figure 2.Calibration model of bias and dark current as a function of
exposure time and temperature. The variable exposure time and di-rect exposure to weather results in a dark range of about 1000 ADU (out of a maximum of 65 536).
to 1000 ms, while the temperature was varied between 10 and 45◦C in a nonlinear way. There may have been a lag between the temperature at the detector and the thermometer, particu-larly at fast temperature changes. After calibration, the effect of temperature gradients is counteracted through the use of optical black detector pixels. The average value of those 13 pixels at the time of measurement, compared to their average value at the time of calibration, is added to the dark model as a dynamic correction. Pixel-to-pixel variations of the dark-current calibration residuals seem random, with a standard deviation of 6 ADU.
2.2.3 Differential transmission
2.2.4 Polarimetric calibration
Calibration of the polarization measurements is performed by inserting a rotatable polarizer in the entrance tube of the instrument. The thus measured spectral polarization de-scribes the spectral efficiency ǫ of the polarimetry, which
is ∼0.95 for wavelengths longer than 600 nm. At shorter
wavelengths the efficiency gradually decreases to∼0.85 at
400 nm, because the contrast of the faster modulation gets washed out by the spectrograph slit function. The efficiency depends not only on the wavelength but also on the angle of linear polarization of the incident light. If the QWP is not exactly a quarter wave, polarization at 45◦ will partly leak through the multiple-order retarder without being modu-lated. The maximum spectral retardance deviation of 2 % for the Fresnel rhomb leads to a decrease in modulation ampli-tude of 5×10⁻⁴, which is barely measurable. Misalignments of the quarter-wave retarder and multiple-order retarder de-crease the modulation amplitudes for both polarization at 0 and 45◦, but not by the same amount. Therefore, the polar-ization calibration measurements are performed for different polarizer orientations, namely 0,10, . . .,170◦. The observed
differential modulation efficiency of 2 % can be explained by misalignments of optical elements by±2◦. Based on the angle of linear polarization of a sky measurement, the cor-responding spectral efficiency is constructed by interpolation of the calibration measurements.
The uncertainty in the polarization measurements is com-posed of systematic uncertainty and random noise. Potential sources of systematic uncertainties are imperfect dark signal subtraction and instrument changes with temperature. Using the equations in van Harten et al. (2014b) for the propagation of uncorrected dark current, for typical intensities in the three spectral bands as shown in Fig. 1, the relative polarimetric uncertainties due to dark signal are 0.1, 0.2, and 2.3 % at 441,
675, and 870 nm, respectively. Note that the calibration mea-surement for the polarimetric efficiency is also affected to the same extent. The athermal multiple-order retarder yields a thermal stability in the angle of linear polarization of±1.5◦
over a±20 K temperature range. The corresponding uncer-tainty in the degree of linear polarization, through the de-pendency of the polarimetric efficiency correction on the an-gle of linear polarization, is negligible. Spectrograph defocus due to temperature changes leads to a loss of spectral resolu-tion, thereby directly impacting the modulation contrast, just like the spectrograph slit function. A typical spot degrada-tion of 1 pixel per 20 K for an f/4 aluminum spectrograph
results in a reduction of the modulation amplitude of 2 % in the blue, where the modulation period is∼6 nm, whereas in the red the efficiency decreases by only 0.1 % because the modulation period is 4 times larger. The vast majority of the measurements were taken within 5 K of the efficiency cali-bration measurements, leading to thermal uncertainties in the polarimetric efficiency of 0.5, 0.1, and 0.03 % at 441, 675, and 870 nm, respectively. The total root-sum-squared relative
systematic polarimetric uncertainties at the aforementioned wavelengths are 0.5, 0.3, and 3.2 %, respectively. In the blue the polarization error is dominated by thermal spectrograph defocus, whereas in the red the main error source is residual dark signal. A complete error analysis for spectrally modu-lated polarization measurements, including measurements of the temperature sensitivity of the polarization, will be pre-sented in forthcoming papers (van Harten et al., 2014a; Riet-jens et al., 2014).
The random noise in the polarization is determined by fit-ting each polarization curve as a function of scattering angle
θ for tens of principal plane scans to an empirical function
by Dahlberg (2010), given by
PL(θ )= sin
2(β
1θ+β2)
1+cos2(β1θ+β2)+2β3/ (1−β3). (2)
The free parametersβ1andβ2allow for a possible pointing
error, as well as a shift of the maximum polarization to a scat-tering angle different than 90◦, which is often observed (e.g., Boesche et al., 2006). The atmospheric depolarization factor
β3 determines the maximum degree of linear polarization.
The best-fit values forβ are not used, but they are needed
to leave no systematic fit residuals in order to get a reliable value for the random noise in the degree of linear polariza-tion. The root mean square of the residuals of all fits together quantifies the absolute random polarimetric noise, which is 0.004, 0.006, and 0.006 at 441, 675, and 870 nm,
respec-tively. These values are an order of magnitude larger than photon noise and random instrumental errors like detector readout noise and pointing instability, so it is believed to be dominated by sky variations like very thin inhomogeneously distributed cirrus that is not visible to the naked eye.
As an independent verification of the polarimetric calibra-tion, the polarization at 870 nm of the aforementioned prin-cipal plane scans is compared with the colocated AERONET CIMEL sun photometer, equipped with polarization filters at different orientations. For 93 % of the data the difference between the instruments is within the combined root-sum-squared error bar of the two instruments, for an uncertainty of 0.01 for the sun photometer (Li et al., 2009). This hints at
an overestimation of the groundSPEX error bar, for example because the particular temperatures and exposure times are associated with a smaller-than-average residual dark current. A summary of the polarimetric calibration is given in Ta-ble 1.
2.2.5 Radiometric calibration
1 10 1
10
Radiometric calibration
1 10
CIMEL [µW/cm2/sr/nm]
1 10
γ⋅
groundSPEX [
µ
W/cm
2 /sr/nm]
870 675 441
λ [nm]: 870 675 441
λ [nm]:
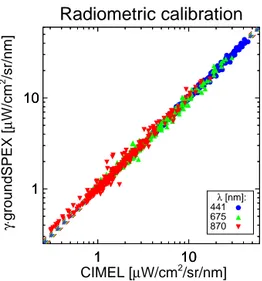
Figure 3. Correlation between sky radiances measured with
groundSPEX and the CIMEL sun photometer used for the calibra-tion of the gainγ (λ)of groundSPEX. The dashed lines indicate
the combined systematic and random error bars. Note the double logarithmic scale; thus the errors scale with intensity.
and scattering angle allow us to linearly interpolate the two AERONET scans closest in time to the time of the ground-SPEX measurement, followed by a linear interpolation to groundSPEX’ scattering angles. For each scan there is a perfect linear relationship between AERONET and ground-SPEX, but the gainγ (λ)that relates groundSPEX radiances
in ADU ms−1 to CIMEL radiances in µW cm−2sr−1nm−1 changes significantly from scan to scan. The origin of this phenomena is unknown, it is not correlated with time or tem-perature, and it cannot be explained by residual dark sig-nal or scattering-angle-dependent stray light. Therefore, the standard deviation of all the best-fit values forγ translates
into a relative systematic intensity uncertainty of 2.8, 4.5, and 5.7◦at 441, 675, and 870 nm, respectively. The standard deviation of the residuals for all these fits combined gives the relative random intensity noise of 2.6, 4.6, and 7.6 %, re-spectively. The gain itself is found by fitting the data of all scans together, yielding values for γ (λ)of 0.0429, 0.0229,
and 0.1107, respectively. The deviations between the
instru-ments clearly scale with intensity; therefore a weighted least-squares fit is applied, where the weights are given by the in-verse radiances squared. The result of the radiometric cali-bration is shown in Fig. 3, where the dashed lines represent the total root-sum-squared systematic and random error.
A summary of the radiometric calibration is given in Ta-ble 1.
2.2.6 Pointing calibration
The absolute pointing is calibrated by putting the sun at the center of the field of view at different times during the day, after inserting a neutral density filter to avoid overexposure. The standard deviation of the hence obtained absolute pan
and tilt angles is 0.2◦, yielding a total pointing accuracy of 0.3◦. The electronic pointing errors are negligible compared to this calibration accuracy.
2.3 Observations
Several atmospheric scattering measurements were per-formed with the groundSPEX instrument at the Cabauw Ex-perimental Site for Atmospheric Research (CESAR Obser-vatory) in the Netherlands; 51.971◦N, 4.927◦E), also known as Cabauw (http://www.cesar-observatory.nl). This site, lo-cated in a rural environment mainly covered by grassland within a radius of 10 km, but in between extended urban ar-eas, hosts a large variety of instrumentation, including instru-ments of the Baseline Surface Radiation Network (BSRN) and the AErosol RObotic NETwork (AERONET), for re-search of, for example, the atmospheric boundary layer, clouds, aerosols, and greenhouse gases (Apituley et al., 2008; Holben et al., 1998).
Throughout four mostly cloudless days in 2013, viz. 7, 8, and 9 July and 5 September, the instrument sampled the in-tensity and polarization at 360–910 nm in the principal plane, defined by the instrument, zenith, and the sun. Each princi-pal plane scan consisted of 8 to 25 viewing zenith angles between 60 and −60◦. Angles closer to the horizon were avoided because the plane-parallel model atmosphere in the aerosol retrieval algorithm is not valid at larger zenith angles, and the contribution of the limitedly known albedo increases close to the horizon, as well as the variability of the scene. The groundSPEX instrument cannot measure within 6◦from the sun because of stray light and overexposure.
Cloud screening is performed using a colocated total-sky imager (TSI) that records an image of the entire sky every minute. Since the sky was clear most of the time, any changes because of clouds drifting in or cirrus appearing are clearly visible. Principal plane scans are considered cloud-free if the entire principal plane is clear during the entire scan. The daily average relative humidities were∼70 %.
3 Aerosol retrieval
Table 1.Summary of the polarimetric and radiometric calibrations of the groundSPEX instrument. The random error in the polarization is
independent of the degree of linear polarizationPL, whereas the other errors are relative errors.
Polarization (PL) Radiance (I)
λ[nm] 441 675 870 441 675 870
Systematic error 0.005PL 0.003PL 0.032PL 0.028I 0.045I 0.057I
Random error 0.004 0.006 0.006 0.026I 0.046I 0.076I
Sect. 2.2) allows us to assess the impact of measurement er-rors on retrieved aerosol parameters. We showed in Sect. 2 that systematic polarization errors are caused by bias drift and temperature, resulting in an increase or decrease in the degree of linear polarization for all wavelengths at the same time. The systematic uncertainty in the radiances also has the same sign for all wavelengths, but is not related to the sign of the polarization error. Therefore, the propagation of system-atic errors has been calculated by performing the aerosol re-trieval for nine scenarios: radiance without systematic error, radiance minus systematic error, and radiance plus system-atic error, all in combination with polarization without and with positive and negative systematic error. The propagation of random errors is captured in the retrieval error covariance matrix, which is calculated as part of the iterative inversion process. The size of the random measurement errors is simi-lar to (radiometry) or smaller than (posimi-larimetry) the system-atic uncertainty. Moreover,∼100 data points are fitted dur-ing the retrieval for one principal plane measurement (radi-ance and polarization at three wavelengths at∼15 scattering angles; see Fig. 5), so the random errors will average out by a factor of√100=10, whereas the systematic errors move entire data sets up or down. Therefore, the impact of random errors on the retrieved aerosol parameters is assumed to be negligible compared to systematic uncertainties.
4 Results
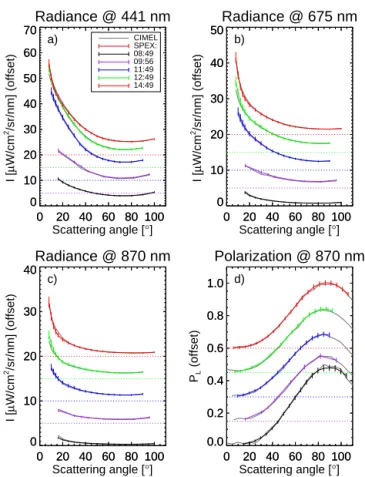
A direct comparison of sky radiance and polarization data between groundSPEX and the colocated CIMEL sun pho-tometer is shown in Fig. 4. The five presented principal plane measurements of an entirely cloud-free sky are carefully se-lected from the radiometric calibration measurements in or-der to rule out differences due to slight variations in tim-ing or pointtim-ing of the two instruments. The error bars on the groundSPEX data represent the total measurement un-certainty, viz. the root-sum-squared systematic and random errors as listed in Table 1.
The good agreement between the groundSPEX and CIMEL radiance measurements (Fig. 4a–c) is not surpris-ing, because the CIMEL was employed as the reference for the radiometric calibration of groundSPEX. Note, however, that groundSPEX performs radiometric measurements inde-pendently of CIMEL once the radiometric gains are
cali-0 20 40 60 80 100 0
10 20 30 40 50 60 70
Radiance @ 441 nm
0 20 40 60 80 100 Scattering angle [°] 0
10 20 30 40 50 60 70
I [
µ
W/cm
2/sr/nm] (offset)
CIMEL SPEX: 08:49 09:56 11:49 12:49 14:49 CIMEL SPEX: 08:49 09:56 11:49 12:49 14:49 a)
0 20 40 60 80 100 0
10 20 30 40 50
Radiance @ 675 nm
0 20 40 60 80 100 Scattering angle [°] 0
10 20 30 40 50
I [
µ
W/cm
2/sr/nm] (offset)
b)
0 20 40 60 80 100 0
10 20 30 40
Radiance @ 870 nm
0 20 40 60 80 100 Scattering angle [°] 0
10 20 30 40
I [
µ
W/cm
2/sr/nm] (offset)
c)
0 20 40 60 80 100 0.0
0.2 0.4 0.6 0.8 1.0
Polarization @ 870 nm
0 20 40 60 80 100 Scattering angle [°] 0.0
0.2 0.4 0.6 0.8 1.0
PL
(offset)
d)
Figure 4.Comparison between groundSPEX (colored lines with
er-ror bars) and the colocated CIMEL sun photometer (grey lines), for clear-sky radiance at(a)441 nm,(b)675 nm, and(c)870 nm, and (d)polarization at 870 nm, as a function of scattering angle in the
principal plane. The instruments measured simultaneously at five times (see legend [UTC]) on 9 July 2013, at CESAR Observatory. The different sets are offset for visibility, with the offsets indicated by the dotted lines.
0 20 40 60 80 100 0
10 20 30 40 50
0 20 40 60 80 100
Scattering angle [°] 0
10 20 30 40 50
Radiance [
µ
W/cm
2 /sr/nm]
0.0 0.1 0.2 0.3 0.4 0.5
PL h [nm]:
441 675 870
h [nm]: 441 675 870
40 20 0 -20 -40 -60
Viewing zenith angle [°]
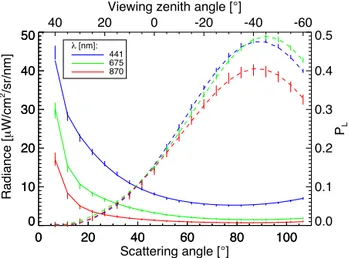
Figure 5.Measurements (displayed as vertical error bars) and
re-trieval algorithm best fit of spectral radiance (solid curves) and de-gree of linear polarization (dashed curves) as a function of scatter-ing angle in the principal plane. The mean solar zenith angle was 46.66◦, with a drift of<0.03◦during the measurements. CESAR
Observatory, 9 July 2013, 14:55 UTC.
The polarization data of the groundSPEX and CIMEL instruments also show good overall agreement. However, the groundSPEX polarization curves are smoother, whereas CIMEL suffers from random errors. Furthermore, the groundSPEX polarization converges to 0 at small scatter-ing angles, whereas CIMEL seems to maintain an offset. The latter effect can be a side effect of temporal polariza-tion modulapolariza-tion, because any temporal changes between the sequential rotating-polarizer measurements create spurious polarization. Note that the polarization comparison is per-formed at 870 nm because the CIMEL instrument at Cabauw only measures polarization at that wavelength. GroundSPEX measures polarization across the entire spectrum, with a po-larimetric accuracy that is typically a factor of 2 better than at 870 nm, which is at the edge of the groundSPEX spectral range (see Table 1 and Fig. 1).
The measured spectral radiance and degree of linear po-larization as a function of scattering angle for one principal plane scan is shown in Fig. 5, together with the retrieval al-gorithm best fit. The error bars represent the total uncertainty in the measurements, viz. the root-sum-squared systematic and random errors. The fit has a reduced chi-square of 0.57,
and yields an aerosol optical thickness (AOT) at 550 nm of 0.228+0.013
−0.018(see Fig. 6).
On 9 July, both the lowest and highest AOT of our data set are shown, as well as the steepest AOT change in time. Therefore, the AOT time series of 9 July is shown in Fig. 6, together with the AERONET direct-sun AOT, calculated us-ing the Beer–Lambert–Bouguer law (Holben et al., 1998). The error bars on the groundSPEX measurements represent the systematic errors as the lowest and highest retrieved AOT for the nine input scenarios as described in Sect. 3. The
er-6 8 10 12 14 16 18
0.0 0.1 0.2 0.3 0.4
Aerosol optical thickness, July 9, 2013
6 8 10 12 14 16 18
Time [UTC] 0.0
0.1 0.2 0.3 0.4
AOT(550)
AERONET GroundSPEX
6 8 10 12 14 16 18
0.0 0.1 0.2 0.3 0.4
Figure 6.Aerosol optical thickness at 550 nm during the day of
9 July 2013 at Cabauw, the Netherlands. GroundSPEX diffuse-sky measurements are compared with AERONET direct-sun measure-ments. The red data point at 14:55 UTC is retrieved from the mea-surements displayed in Fig. 5.
ror in the AERONET direct-sun AOT is typically 0.01, with
an upper limit of∼0.02 (Dubovik et al., 2000). The
uncer-tainty mainly comes from the transmission degradation of the interference filters. Therefore, for level 1.5 data without post-calibration we adopt 0.02 as error bar. The ability of
ground-SPEX to accurately measure AOT, often considered the main aerosol parameter, is clear, even in the rapidly changing at-mospheric conditions around 10:00 UTC, even without di-rectly observing the sun.
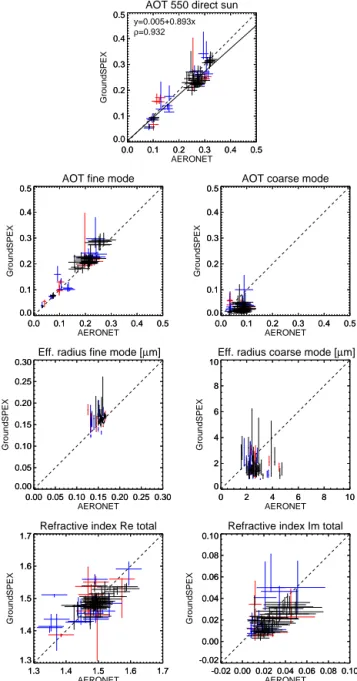
A comparison between groundSPEX and AERONET of retrieved aerosol parameters for the entire data set is shown in Fig. 7. The AERONET AOT in the upper plot is the to-tal AOT retrieved from direct-sun measurements at multi-ple wavelengths, interpolated to 550 nm (thus including the data from Fig. 6). A least-squares fit yields a regression line of groundSPEX=0.005+0.893 AERONET, with a Pearson
correlation coefficient ofρ=0.932.
The AOT of the fine and coarse mode measured with AERONET are retrieved using the spectral deconvolution al-gorithm (SDA) (O’Neill et al., 2001, 2003), which employs the spectral shape of the direct-sun AOT. These AOT re-trievals are performed at 500 nm, resulting in a slight over-estimation of∼0.01 compared to groundSPEX at 550 nm.
The error bars on the SDA fine- and coarse-mode AOT are provided with the retrieval results of AERONET.
0.0 0.1 0.2 0.3 0.4 0.5 0.0 0.1 0.2 0.3 0.4 0.5
AOT 550 direct sun
0.0 0.1 0.2 0.3 0.4 0.5 AERONET 0.0 0.1 0.2 0.3 0.4 0.5 GroundSPEX y=0.005+0.893x ρ=0.932
0.0 0.1 0.2 0.3 0.4 0.5 0.0 0.1 0.2 0.3 0.4 0.5
AOT fine mode
0.0 0.1 0.2 0.3 0.4 0.5 AERONET 0.0 0.1 0.2 0.3 0.4 0.5 GroundSPEX
0.0 0.1 0.2 0.3 0.4 0.5 0.0 0.1 0.2 0.3 0.4 0.5
AOT coarse mode
0.0 0.1 0.2 0.3 0.4 0.5 AERONET 0.0 0.1 0.2 0.3 0.4 0.5 GroundSPEX
0.00 0.05 0.10 0.15 0.20 0.25 0.30 0.00 0.05 0.10 0.15 0.20 0.25 0.30
Eff. radius fine mode [µm]
0.00 0.05 0.10 0.15 0.20 0.25 0.30 AERONET 0.00 0.05 0.10 0.15 0.20 0.25 0.30 GroundSPEX
0 2 4 6 8 10
0 2 4 6 8 10
Eff. radius coarse mode [µm]
0 2 4 6 8 10
AERONET 0 2 4 6 8 10 GroundSPEX
1.3 1.4 1.5 1.6 1.7
1.3 1.4 1.5 1.6 1.7
Refractive index Re total
1.3 1.4 1.5 1.6 1.7
AERONET 1.3 1.4 1.5 1.6 1.7 GroundSPEX
-0.02 0.00 0.02 0.04 0.06 0.08 0.10 -0.02 0.00 0.02 0.04 0.06 0.08 0.10
Refractive index Im total
-0.02 0.00 0.02 0.04 0.06 0.08 0.10 AERONET -0.02 0.00 0.02 0.04 0.06 0.08 0.10 GroundSPEX
Figure 7.Aerosol parameters retrieved with the groundSPEX
in-strument, compared to AERONET. The different colors correspond to different goodness-of-fit values of the retrieval: 5≤χ2≤10
(red), 2≤χ2≤5 (blue), andχ2≤2 (black). The dashed lines
in-dicate the groundSPEX=AERONET scenario. The measurements
were performed on 7, 8, and 9 July and 5 September 2013 at Cabauw, the Netherlands.
part (Dubovik et al., 2000). For groundSPEX, the total re-fractive index is the AOT-weighted sum of the retrieved spec-trally flat fine- and coarse-mode refractive indices.
All error bars shown for groundSPEX are the result of sys-tematic measurement uncertainties, for reasons explained in Sect. 3. Only retrievals with a reduced chi-square smaller than 10 are presented. The absolute chi-squared values do not translate directly into a probability that the data match
the model, due to systematic errors in the data and the model; however, the relative values can still be used as a measure for goodness of fit. To get a feel for the meaning of the abso-lute and relative chi-squared values, the results in Fig. 7 are color coded based on the chi-square of the retrievals. For a fair comparison between the different parameters, the plotted range for each aerosol parameter is the total range of possible values.
5 Discussion
It is important to make a clear distinction between the AERONET direct-sun total AOT and the other AERONET products. The AERONET measurement of direct-sun AOT is straightforward and reliable, and is considered the bench-mark measurement. Any other AERONET products involve inverse modeling, so there is no absolute ground truth.
Moreover, both instruments perform different measure-ments and exhibit different errors, and therefore they con-strain the aerosol parameters differently. CIMEL measures sky radiance at three wavelengths, with higher accuracy than groundSPEX, and includes a direct-sun measurement and measurements at scattering angles close to the sun. The CIMEL instrument at Cabauw also measures polarization at 870 nm. GroundSPEX measures both sky radiance and polar-ization throughout the entire visible spectrum, with notably higher polarimetric accuracy, but at a minimum scattering an-gle of 6◦. On top of that, the inversion algorithms are differ-ent for both instrumdiffer-ents. This makes it difficult to interpret discrepancies; hence we will limit ourselves here to a quali-tative comparison.
Overall there is very good agreement between ground-SPEX and AERONET for all parameters. In particular, the important and widely measured parameter of total AOT matches the AERONET direct-sun benchmark measurement over a large range of values, and exhibits relatively small er-ror bars compared to the other aerosol parameters. This re-sults in a correlation coefficient ofρ=0.932, even though
groundSPEX is not able to measure within 6◦ of the sun. The measured range of coarse-mode AOT and effective radii is quite limited, so future observations under various at-mospheric conditions are needed. The measurements of the complex refractive index, which is an indicator of chemi-cal composition, are consistent with AERONET, albeit with slightly larger error bars.
6 Conclusions and outlook
We have developed the groundSPEX instrument, an auto-mated sky-scanning spectropolarimeter. An extensive error analysis has been performed, resulting in random and sys-tematic error bars for radiometry and polarimetry. About 70 measurement sequences of the clear sky have been performed throughout 4 days in 2013 at the CESAR Observatory in the Netherlands. Important aerosol parameters have been re-trieved, such as optical thickness, size distribution, and com-plex refractive index. The results are in good agreement with the colocated AERONET products; in particular, the total aerosol optical thickness (AOT) at 550 nm exhibits a corre-lation coefficient ofρ=0.932 with AERONET’s direct-sun
AOT, which is considered the benchmark measurement. The main advantage of groundSPEX compared to AERONET is the measurement of both radiance and linear polarization across the entire visible spectrum (400–900 nm). Moreover, the spectral polarization modulation technique yields snapshot polarimetry at sub-percent accuracy, without moving or active modulation optics, at low cost, suitable for deployment in a measurement network. The use of diffuse-sky measurements and inversions, and the instrument’s abil-ity to point in any direction, potentially enables measuring in partially cloudy sky conditions.
GroundSPEX will continue to be employed on a regular basis at the CESAR Observatory as a fast instrument to re-trieve optical and microphysical properties of aerosols that are important for climate and health studies. We will build a data set that will be used to study aerosol parameters in rela-tion to other ground-based measurements as well as satellite measurements. In addition, groundSPEX will provide a valu-able and much needed link between ground-based aerosol measurements and data retrieved by satellite instruments, such as GOME-2, MISR, MODIS, and OMI, or – hopefully – an airborne or satellite-based version of SPEX itself.
Acknowledgements. The CESAR Observatory is operated by the
Royal Netherlands Meteorological Institute (KNMI). The authors thank Marcel Brinkenberg and Alfons Driever (KNMI) for support during the observations. The total-sky images were provided by Henk Klein Baltink (KNMI). G. van Harten acknowledges Utrecht University for funding his research. The groundSPEX instrument was developed for the National Institute for Public Health and the Environment (RIVM).
Edited by: P. Stammes
References
Apituley, A., Russchenberg, H., van der Marel, H., Bosveld, F., Boers, R., ten Brink, H., de Leeuw, G., Uijlenhoet, R., Arbresser-Rastburg, B., and Róckmann, T.: Overview of Research and Networking with Ground based Remote Sensing for
spheric Profiling at the Cabauw Experimental Site for Atmo-spheric Research (CESAR) – The Netherlands, IGARSS, 8–11 July, 2008, Boston, USA, Int. Geosci. Remote. Se., 903–906, doi:10.1109/IGARSS.2008.4779496, 2008.
Beelen, R., Raaschou-Nielsen, O., and Stafoggia, M., et al.: Effects of long-term exposure to air pollution on natural-cause mortality: an analysis of 22 European cohorts within the multicentre ES-CAPE project, The Lancet, 383, 785–795, doi:10.1016/S0140-6736(13)62158-3, 2014.
Boesche, E., Stammes, P., Ruhtz, T., Preusker, R., and Fischer, J.: Effect of aerosol microphysical properties on polarization of skylight: sensitivity study and measurements, Appl. Optics, 45, 8790–8805, doi:10.1364/AO.45.008790, 2006.
Dahlberg, A. R.: All-sky polarization imager deployment at Mauna Loa Observatory, Hawaii, Master’s thesis, Montana State Univer-sity, 2010.
Di Noia, A., Hasekamp, O. P., van Harten, G., Rietjens, J. H. H., Smit, J. M., Snik, F., Henzing, J. S., de Boer, J., Keller, C. U., and Volten, H.: Use of neural networks in ground-based aerosol retrievals from multi-angle spectropolarimetric observations, At-mos. Meas. Tech. Discuss., 7, 9047–9094, doi:10.5194/amtd-7-9047-2014, 2014.
Dubovik, O. and King, M. D.: A flexible inversion algorithm for retrieval of aerosol optical properties from Sun and sky radiance measurements, J. Geophys. Res., 105, 20673–20696, doi:10.1029/2000JD900282, 2000.
Dubovik, O., Smirnov, A., Holben, B. N., King, M. D., Kauf-man, Y. J., Eck, T. F. and Slutsker, I.: Accuracy assessments of aerosol optical properties retrieved from Aerosol Robotic Net-work (AERONET) Sun and sky radiance measurements, J. Geo-phys. Res., 105, 9791–9806, doi:10.1029/2000JD900040, 2000. Dubovik, O., Sinyuk, A., Lapyonok, T., Holben, B. N., Mishchenko, M., Yang, P., Eck, T. F., Volten, H., MuñOz, O., Veihelmann, B., van der Zande, W. J., Leon, J.-F., Sorokin, M., and Slutsker, I.: Application of spheroid models to account for aerosol particle nonsphericity in remote sensing of desert dust, J. Geophys. Res., 111, 11208, doi:10.1029/2005JD006619, 2006.
Hasekamp, O. P. and Landgraf, J.: Linearization of vector ra-diative transfer with respect to aerosol properties and its use in satellite remote sensing, J. Geophys. Res., 110, 4203, doi:10.1029/2004JD005260, 2005.
Hasekamp, O. P. and Landgraf, J.: Retrieval of aerosol properties over land surfaces: capabilities of multiple-viewing-angle inten-sity and polarization measurements, Appl. Optics, 46, 3332– 3344, doi:10.1364/AO.46.003332, 2007.
Hasekamp, O. P., Litvinov, P., and Butz, A.: Aerosol prop-erties over the ocean from PARASOL multiangle pho-topolarimetric measurements, J. Geophys. Res., 116, 14204, doi:10.1029/2010JD015469, 2011.
Holben, B. N., Eck, T. F., Slutsker, I., Tanré, D., Buis, J. P., Set-zer, A., Vermote, E., Reagan, J. A., Kaufman, Y. J., Naka-jima, T., Lavenu, F., Jankowiak, I., and Smirnov, A.: AERONET – A Federated Instrument Network and Data Archive for Aerosol Characterization, Remote Sens. Environ., 66, 1–16, doi:10.1016/S0034-4257(98)00031-5, 1998.
Tignor, M., Allen, S. K., Boschung, J., Nauels, A., Xia, Y., Bex, V., and Midgley, P. M., Cambridge University Press, Cambridge, United Kingdom and New York, NY, USA, 2013.
Li, Z., Goloub, P., Dubovik, O., Blarel, L., Zhang, W., Podvin, T., Sinyuk, A., Sorokin, M., Chen, H., Holben, B., Tanré, D., Canini, M., and Buis, J.-P.: Improvements for ground-based re-mote sensing of atmospheric aerosol properties by additional po-larimetric measurements, J. Quant. Spectrosc. Ra., 110, 1954– 1961, doi:10.1016/j.jqsrt.2009.04.009, 2009.
McMurry, P. H.: A review of atmospheric aerosol measure-ments, Atmos. Environ., 34, 1959–1999, doi:10.1016/S1352-2310(99)00455-0, 2000.
Mishchenko, M. I. and Travis, L. D.: Satellite retrieval of aerosol properties over the ocean using polarization as well as inten-sity of reflected sunlight, J. Geophys. Res., 102, 16989–17013, doi:10.1029/96JD02425, 1997.
Mishchenko, M. I., Cairns, B., Hansen, J. E., Travis, L. D., Burg, R., Kaufman, Y. J., Vanderlei Martins, J., and Shettle, E. P.: Moni-toring of aerosol forcing of climate from space: analysis of mea-surement requirements, J. Quant. Spectrosc. Ra., 88, 149–161, doi:10.1016/j.jqsrt.2004.03.030, 2004.
Murayama, T., Okamoto, H., Kaneyasu, N., Kamataki, H., and Miura, K.: Application of lidar depolarization measure-ment in the atmospheric boundary layer: Effects of dust and sea-salt particles, J. Geophys. Res., 104, 31781–31792, doi:10.1029/1999JD900503, 1999.
O’Neill, N. T., Dubovik, O., and Eck, T. F.: Modified Ångström ex-ponent for the characterization of submicrometer aerosols, Appl. Optics, 40, 2368–2375, doi:10.1364/AO.40.002368, 2001. O’Neill, N. T., Eck, T. F., Smirnov, A., Holben, B. N., and
Thulasir-aman, S.: Spectral discrimination of coarse and fine mode optical depth, J. Geophys. Res., 108, 4559, doi:10.1029/2002JD002975, 2003.
Pust, N. J., Dahlberg, A. R., Thomas, M. J., and Shaw, J. A.: Com-parison of full-sky polarization and radiance observations to ra-diative transfer simulations which employ AERONET products, Optics Express, 19, 18602–18613, doi:10.1364/OE.19.018602, 2011.
Rietjens, J. H. H., van Harten, G., Bekkers, D., Vreeker, A., Snik, F., Smit, J. M., and Keller, C. U.: Performance of spectrally mod-ulated polarimetry II: Data reduction and absolute polarization calibration of a prototype SPEX satellite instrument, in prepara-tion, 2014.
Snik, F., Karalidi, T., and Keller, C. U.: Spectral modula-tion for full linear polarimetry, Appl. Optics, 48, 1337–1346, doi:10.1364/AO.48.001337, 2009.
van Harten, G., Snik, F., Rietjens, J. H. H., Smit, J. M., de Boer, J., Diamantopoulou, R., Hasekamp, O. P., Stam, D. M., Keller, C. U., Laan, E. C., Verlaan, A. L., Vliegenthart, W. A., Ter Horst, R., Navarro, R., Wielinga, K., Hannemann, S., Moon, S. G., and Voors, R.: Prototyping for the Spectropolarimeter for Planetary EXploration (SPEX): calibration and sky measurements, P. Soc. Photo-Opt. Ins., 8160, doi:10.1117/12.893741, 2011.
van Harten, G., Rietjens, J. H. H., Snik, F., Smit, J. M., and Keller, C. U.: Performance of spectrally modulated polarimetry I: Error analysis and optimization, in preparation, 2014a.