Genome-Wide Analysis of Positively Selected
Genes in Seasonal and Non-Seasonal
Breeding Species
Yuhuan Meng1☯, Wenlu Zhang1☯, Jinghui Zhou1☯, Mingyu Liu1¤, Junhui Chen1, Shuai Tian1, Min Zhuo1, Yu Zhang2, Yang Zhong4,5, Hongli Du1*, Xiaoning Wang1,3
1School of Bioscience and Bioengineering, Guangdong Provincial Key Laboratory of Fermentation and Enzyme Engineering, South China University of Technology, Guangzhou, China,2Guangdong Key Laboratory of Laboratory Animals/Guangdong laboratory animals monitoring institution, Guangzhou, China, 3Chinese PLA General Hospital, Beijing, China,4School of Life Sciences, Fudan University, Shanghai, China,5Institute of Biodiversity Science, Tibet University, Lhasa, China
☯These authors contributed equally to this work.
¤ Current address: School of Bioscience and Bioengineering, South China University of Technology, Guangzhou, China
*hldu@scut.edu.cn
Abstract
Some mammals breed throughout the year, while others breed only at certain times of year. These differences in reproductive behavior can be explained by evolution. We identified positively-selected genes in two sets of species with different degrees of relatedness includ-ing seasonal and non-seasonal breedinclud-ing species, usinclud-ing branch-site models. After strinclud-ingent filtering by sum of pairs scoring, we revealed that more genes underwent positive selection in seasonal compared with non-seasonal breeding species. Positively-selected genes were verified by cDNA mapping of the positive sites with the corresponding cDNA sequences. The design of the evolutionary analysis can effectively lower the false-positive rate and thus identify valid positive genes. Validated, positively-selected genes, includingCGA,DNAH1, INVS, andCD151, were related to reproductive behaviors such as spermatogenesis and cell proliferation in non-seasonal breeding species. Genes in seasonal breeding species, in-cludingTHRAP3,TH1L, andCMTM6, may be related to the evolution of sperm and the cir-cadian rhythm system. Identification of these positively-selected genes might help to identify the molecular mechanisms underlying seasonal and non-seasonal
reproductive behaviors.
Introduction
The environment can influence gene evolution and thus animal behaviors, including reproduc-tion-related behaviors. Some mammals can breed throughout the year, while others only breed successfully at certain times of year. Such animals are defined as non-seasonal and seasonal breeding species, respectively. Day length, temperature, and food supply can all influence the
a11111
OPEN ACCESS
Citation:Meng Y, Zhang W, Zhou J, Liu M, Chen J, Tian S, et al. (2015) Genome-Wide Analysis of Positively Selected Genes in Seasonal and Non-Seasonal Breeding Species. PLoS ONE 10(5): e0126736. doi:10.1371/journal.pone.0126736
Academic Editor:Jesus E. Maldonado, Smithsonian Conservation Biology Institute, UNITED STATES
Received:March 18, 2014
Accepted:April 7, 2015
Published:May 22, 2015
Copyright:© 2015 Meng et al. This is an open access article distributed under the terms of the
Creative Commons Attribution License, which permits unrestricted use, distribution, and reproduction in any medium, provided the original author and source are credited.
Data Availability Statement:Data for the Chinese rhesus macaque (Macaca mulatta lasiota) are available at:https://www.ncbi.nlm.nih.gov/bioproject/ 51409. Data for the cynomolgus/crab-eating macaque (Macaca fascicularis) are available at:
https://www.ncbi.nlm.nih.gov/bioproject/51411.
reproductive behavior of seasonal breeding species and subsequent survival of offspring [1]; if they breed too early, the growing offspring may be exposed to low temperatures and scarce re-sources, whereas late breeding limits the time available for reproductive behaviors and prepara-tion for the following winter. Accurate timing is therefore an essential component of life-history strategies for organisms living in seasonal environments [2]. The different reproductive behaviors of seasonal and non-seasonal breeding species may result from natural selection pressures [3]. Both strategies benefit the respective species to survive by adaption of their breeding behaviors to the environment through their long evolutionary histories. Whole ge-nome-wide analysis of genes that are positively selected in mammal lineages using the respec-tive breeding strategies may help us to understand the mechanisms responsible for the divergent reproductive behaviors as a result of adaptive evolution.
Positive Darwinian selection of protein-coding genes is a major driving force for detecting adaptive evolution and species diversification. The modified version of the branch-site test (Model A) [4,5] was designed to detect localized episodic bouts of positive selection that affect only a few amino acid residues in particular lineages. This test has been shown to be a reason-ably powerful tool, and has been widely used to investigate the adaptive evolution of genes in many species [6–8].
However, alignment errors may influence the results of branch-site gene analysis in mam-malian and vertebrate species. It is therefore necessary to use reliable alignment methods to re-duce the incidence of false-positive results [9]. Although the aligner software PRANK [10,11] cannot eliminate false-positive results, it is nonetheless more powerful than other aligners [9,
12] such as MUSCLE [13] and ClustalW [14]. In addition to misalignments in multiple se-quences, other factors such as sequence errors, misassembly, and annotation mistakes also in-crease the incidence of falsely-identified positive selection [15,16]. More stringent filters are needed to ensure that branch-site analysis has a low and acceptable false positive rate.
In this genome-wide study, we investigated the evolution of seasonal breeding strategies by identifying positively-selected genes in non-seasonal and seasonal breeding species using modi-fied branch-site models. We established Distant-Species and Close-Species sets, each of which included seasonal and non-seasonal groups. We then identified positively-selected genes in these groups. PRANK (codon) software was used to align all the gene orthologs in the two gene sets. However, because PRANK generates a relatively high false-positive rate with the branch-site model, stringent filtering using sum of pairs (SP) [17,18] scoring was used to remove po-tentially unreliable alignments generated by multiple sequence alignments. Sequence errors, misassembly, and annotation mistakes were also detected by cDNA mapping. Functional anal-ysis of genes identified as positively-selected after this stringent filtering process might help us to understand the molecular mechanisms that determine non-seasonal and seasonal breeding.
Materials and Methods
Materials preparation
Five non-seasonal breeding species and five seasonal breeding species were chosen as the Dis-tant-Species set. The five non-seasonal species included: human (Homo sapiens, GRCh37), chimpanzee (Pan troglodytes, CHIMP2.1) [19], cynomolgus monkey (or crab-eating macaque,
Macaca fascicularis) [20], mouse (Mus musculus, NCBIM37) [21] and rat (Rattus norvegicus, RGSC3.4) [22]. The five seasonal breeding species were Indian rhesus monkey (Macaca mulatta, MMUL_1) [23], Chinese rhesus monkey (M.mulatta lasiota, CR) [24], dog (Canis familiaris, BROADD2)[25], horse (Equus caballus, EquCab2) [26] and rabbit (Oryctolagus cuniculus, oryCun2) [27]. The long lineages between species in the Distant-Species set means that behaviors may have changed back and forth between seasonal and non-seasonal breeding
(SW20130802). The funders had no role in study design, data collection and analysis, decision to publish, or preparation of the manuscript.
strategies several times, while the divergent sequences might influence the branch-site model analysis and generate false positives [28]. To address this problem, we also established a Close-Species set that only included closely-related, non-seasonal (human, gorilla (Gorilla gorilla, gorGor3.1) [29], chimpanzee, and cynomolgus monkey), and seasonal-breeding species (orangutan (Pongo abelii, PPYG2) [30], Indian rhesus monkey, Chinese rhesus monkey, and marmoset (Callithrix jacchus, C_jacchus3.2.1) [31]).
The protein-coding sequences for human, gorilla, chimpanzee, orangutan, Indian rhesus monkey, marmoset, mouse, rat, dog, horse, and rabbit were downloaded from the Ensembl da-tabase (version 64, Sep. 2011;http://www.ensembl.org/info/data/ftp/index.html) [32]. The se-quences for cynomolgus monkey (http://climb.genomics.cn/10.5524/100003) and Chinese rhesus macaque (http://climb.genomics.cn/10.5524/100002) were provided by BGI [33]. The corresponding cDNA sequences used in the accuracy assessment were downloaded from NCBI. Detailed information on the cDNA sequences used in this study are listed inS1 Table.
Calculating positively-selected sites
To identify 1:1 gene orthologs, human protein sequences were used to conduct BLAST [34] searches against other species sequences (blastp-F T-e 1e-5-m 8). It is difficult to select a set of transcripts to minimize alignment gaps and potential errors and thus false-positive branch-site test results [35]. In simple analyses in previous studies [6–8,33,36–41], the longest transcript for a given gene was chosen. Reciprocal searches were then performed for each species protein sequences relative to human protein sequences. In each search, pairwise sequences with identi-ties<60% were excluded, and the highest hit for each query was retained to determine the pair-wise orthologs between humans and other species.
Modified branch-site models [5] for adaptive evolution analysis used each species in one breeding series as the foreground species, and all the other species in that breeding series as background species. For example, to test for positive selection in humans in the Distant-Species set, the human branch was designated as the foreground branch, and the other five species in the seasonal breeding group were designated as background branches. Positive selection signals for all species were tested similarly.
Protein-coding sequences associated with the corresponding 1:1 gene orthologs were aligned using PRANK (codon). The corresponding gene-based phylogenetic trees were con-structed using the maximum likelihood method in the PHYLIP 3.69 [42] software package, ac-cording to the tested aligned protein-coding sequences. The aligned protein-coding sequences and the corresponding phylogenetic trees were then used to analyze the adaptive evolution using the branch-site model in PAML’s codeML program [4]. Branch-site modified model A (model = 2, NSsits = 2) and the corresponding null model (model = 2, NSsits = 2, fix_omega = 1 and omega = 1) [5] were used to identify sequences under positive selection in both test sets of animals. Significance was calculated using theχ2statistic, with one degree of freedom. Genes with p0.01 were considered to be positively selected [5]. The p values were adjusted accord-ing to the FDR method (multiple testaccord-ing correction with the method of Benjamini and Hoch-berg) [43] to allow for multiple testing, with a strict criterion of FDR<0.05. Positively-selected sites were obtained based on the Bayes Empirical Bayes (BEB) analysis [5], with a posterior probability>95%.
Screening for valid positive sites by SP penalty scoring
of the positive sites were at the edge of the beginning or end of the gene and were not reached by the upstream or downstream sequences, and the penalty base score was set separately for both streams (regarded as S, S = 15/n, where n is equal to the number of amino acids in the up-stream or downup-stream sequence). (2) Penalty scores added 0 point for each position in perfect alignment, while mismatched sites or gaps in the alignment were awarded penalty scores of minus S or 2S, respectively. (3) Penalty scores for the upstream and downstream sequences were calculated separately, and the total penalty scores were the sum of the upstream and downstream scores. (4) Average penalty scores were calculated as the final scores (average pen-alty score = total penpen-alty score/N, where N is the number of sequences used in each
alignment).
General and individual penalty scores were used. General penalty scores were equal to the sum of the penalty scores from each of the two compared species. For individual penalty scores, sequences with positive sites were compared with each of the other sequences used in the align-ment in turn, and the total penalty scores were regarded as the individual penalty score.
Threshold values were set for general and individual penalty scores to filter sequences with valid positive sites. In this study, the threshold values for the general and individual penalty scores were−50 and−15, respectively. If both the general and individual penalty scores were
greater than the threshold value, the sequences were filtered and the sites regarded as positive.
Accuracy of positive sites according to cDNA sequences
Mistakes can occur during genome sequencing, sequence assembly, or gene annotation, and cDNA sequences can be used as references to assess the accuracy of the positive sites.
Corresponding cDNA sequences were first matched to the gene sequences using the func-tion BLAST [34] (blastn-e 1e-10-a 4-m 8). cDNA sequences that included the positions corre-sponding to the positive sites were then filtered. Further analysis was conducted using MEGA5 [44]. The gene sequences and their corresponding cDNA sequences were then subjected to alignment analysis using the MUSCLE [13] function. If the nucleotide sequences of the positive sites were identical to those of the corresponding positions in the cDNA sequences, the positive sites were regarded as valid.
Results
Preliminary filtering of positively-selected genes using PRANK and
branch-site model
Totals of 11,031 and 13,171 1:1 gene orthologs with>60% identities were filtered from the Distant- and Close-Species sets, respectively, by BLAST [34]. The corresponding protein se-quences were used for subsequent alignments. The numbers of pairwise gene orthologs be-tween humans and other species are listed inS2 Table. After alignment using PRANK (codon), 10,918 gene orthologs in the Distant-Species set and 12,485 in the Close-Species set were tested for positive selection signals using the codeML program in the PAML package [4], with the modified branch-site model [5]. Positively-selected genes in each species with a p value<0.01 (comparing LRT, the likelihood ratio test, with theχ2 distribution) and with a false-discovery rate (FDR)<5% are shown inTable 1.
Table 1. Numbers of positively-selected genes under different filtering conditions.
Class Distant-Species
χ2 test
p<0.01
Correction FDR<0.05
SP score
fitered Genes
Close-Species
χ2 test
p<0.01
Correction FDR<0.05
SP score
fitered Genes
Non-seasonal
Human 88 16 4 Human 116 20 4
Chimpanzee 207 68 27 Gorilla 274 163 34
Cynomolgus 113 62 27 Chimpanzee 289 117 48
Mouse 228 15 4 Cynomolgus 266 159 69
Rat 274 43 18
Mean 182 40.8 16 Mean 236.25 114.75 38.75
Seasonal Indian rhesus 453 361 131 Orangutan 446 303 147
Chinese rhesus
203 110 51 Indian rhesus 603 464 157
Dog 499 158 54 Chinese
rhesus
229 130 57
Horse 463 157 55 Marmoset 688 314 107
Rabbit 444 129 58
Mean 412.4 183 69.8 Mean 491.5 302.75 117
doi:10.1371/journal.pone.0126736.t001
Fig 1. Numbers of positively-selectived genes (fdr<0.05) and sites (after SP-score filtering).(A). Positively-selected genes corrected by FDR. Sites (BEB>0.95) were filtered by SP scores in the Distant-Species set. (B). Positively-selected genes (FDR>0.05) and positive sites (BEB>0.95) filtered by general SP score>-50 and individual SP score>-15 in the Close-Species set.
However, there were more positively-selected genes in the Close-Species than in the Dis-tant-Species set (mean numbers with FDR<0.05 208.75 and 111.9, respectively). In addition to the different numbers of orthologs (12,485 vs. 10,918), it is also possible that more gaps were generated by alignment in the Distant-Species gene ortholog set compared with in the Close-Species set (mean gap length 244 in the Close-Close-Species set and 322 in the Distant-Close-Species set) (S3 Table), because the sequence divergence was smaller in the Close-Species set. The number of gaps may influence the results of branch-site analysis, because the branch-site would remove columns with gaps in the alignment sequences and would thus exclude more potential positive sites in the Distant-Species set compared with the Close-Species set.
Identification of false-positive sites through sequence misalignment
Putative positively-selected sites in the genome (FDR<0.05) were obtained by Bayes Empirical Bayes (BEB) analysis (posterior probability>95%) [5]. The numbers of putative positively-selected sites in each species are listed inTable 2. The details of all the positive sites with BEB>0.95 are listed inS4 Table.
Alignment problems may influence the performance of the branch-site test, with poor align-ment increasing the incidence of false-positive sites. We therefore filtered out sites with obvious signs of unreliable alignment. We also calculated the SP [17,18] score for each of the positive sites’extended sequences (± 15 amino acids/45 base pairs). Most unreliable alignments are rep-resented by numerous gaps and sequence divergences (S1 FigandS5 Table). After filtering, a total of 2009/3810 (52.73%) positive sites remained. Sites with extended alignments with low divergence are listed inS6 Table. The results after filtering revealed more sites with positive se-lection in the seasonal compared with the non-seasonal breeding species (Table 2). The false-positive rate due to misalignment was 33.33%–61.28% (Table 2), which was similar to that of 50%–55% in a previous report [12]. After alignment filtering, differences in gene numbers be-tween species in the Distant- and Close-Species sets were consistent with those after FDR-adjusted filtering. However, the false positive rate(FPR) statistics only considered misalignment and did not take account of other factors such as sequence errors, misassembly, or
annotation problems.
According to extended-sequence alignments of the positive sites, SP scores<-50 were gen-erally caused by excessive gaps or deficient matches, of which gaps contributed more to the low SP penalty scores (S1 FigandS6 Table). Gaps and deficient matches may arise as a result of di-versity between species or different transcript lengths, because we used the longest human tran-scripts to BLAST other species’protein-coding sequences [35]. Columns with gaps in the alignments would be deleted in branch-site models, even though positive sites may be located within deficient sequence alignments surrounded by gaps or mismatched sequences. A thresh-old SP score of−50 can filter out most false-positive sites caused by divergent sequence
align-ments. SP scoring thus improves the reliability of the results by reducing the false-positive rate caused by unreliable alignments. Details of the positive genes filtered by SP scoring are shown inS7 Table.
cDNA mapping as a novel method of filtering positive sites
corresponding cDNA sequences and aligned with most of the bases. We therefore used cDNA mapping as a novel means of testing sequence errors.
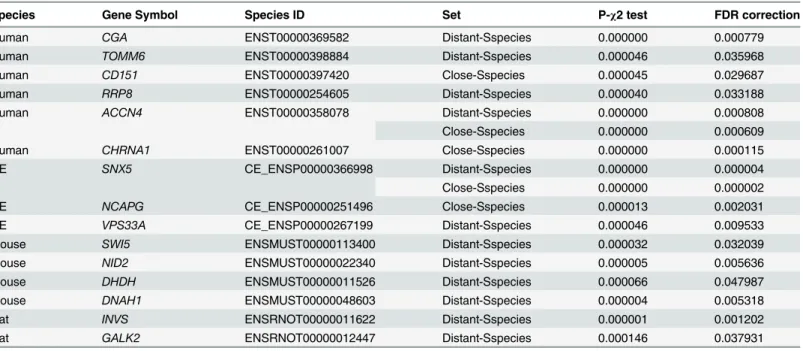
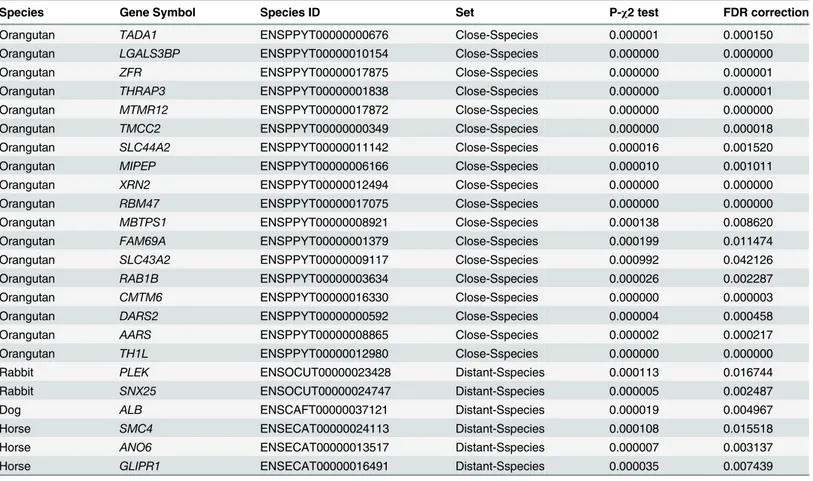
cDNA sequences corresponding to the positive sites were analyzed. In this study, we aligned a total of 193 positive sites in perfect alignment with at least one cDNA sequence of the corre-sponding species using the MUSCLE function [13] in MEGA5 [44]. The coverage between pos-itive sites and corresponding cDNA sequences was low (<10%, 193/2009), and the false positive rate was 61.66% (120/193). Most inconsistent sites were in cynomolgus monkey, horse, and orangutan, which had genome sequences of low quality or with annotation mis-takes. In contrast, the human, mouse and rat genome sequences showed high accuracy. The de-tails of the positive sites mapped with the corresponding cDNA sequences are shown inS1 Table. A total of 74 corresponding cDNA sites were finally identified that were consistent with the positive sites (S1 Table). No corresponding cDNA sequences mapped to the positive sites in gorillas, Chinese rhesus monkeys, and marmosets. After verification by cDNA filtering, 39 genes remained, including 15 genes that were positively-selected in non-seasonal species (Table 3), and 24 in seasonal species (Table 4). Although the limited availability of cDNA se-quences meant that only a few positive sites remained after mapping, these sites were likely to be more accurate.
Discussion
Influence of alignment and annotation
The results of evolutionary analysis are influenced the quality of the genome sequence; false-positive sites may be detected and important information may be missed as a result of low-quality sequences [15,16]. Unfortunately, recent genome-sequencing techniques are still un-able to provide sequences reliun-able enough for evolutionary analysis. Stringent filtering func-tions and parameters are therefore needed to obtain reliable positive sites, and careful analytical design can achieve reliable results, even from low-quality genome sequences.
Evolutionary analysis usually starts with sequence alignment using software such as Clus-talW, MUSCLE or PRANK. In this study, we used PRANK (codon), because this software takes evolutionary information into consideration before placing the gaps [11], resulting in fewer mismatches but larger gaps compared with the other programs (S3 Table). Valid positive sites are likely to be located in alignments with low divergence and few gaps or mismatches, and sequence misalignments can thus generate false-positive sites in branch-site models. The
Table 2. Positive sites after BEB and SP-score filtering.
Class Distant-Species
Sites (BEB>0.95)
SP scoresfiltered sites
FPR Close-Species
Sites (BEB>0.95)
SP scoresfiltered sites
FPR
Non-seasonal
Human 26 16 38.46% Human 9 6 33.33%
Chimpanzee 103 65 36.89% Gorilla 158 84 46.84%
Cynomolgus 92 54 41.30% Chimpanzee 132 90 31.82%
Mouse 10 5 50.00% Cynomolgus 237 131 44.73%
Rat 66 42 36.36%
Seasonal Indian rhesus 532 206 61.28% Orangutan 444 246 44.59%
Chinese rhesus 153 77 49.67% Indian rhesus 531 299 43.69%
Dog 261 106 59.39% Chinese
rhesus
189 89 52.91%
Horse 262 134 48.85% Marmoset 364 232 36.26%
Rabbit 241 127 47.30%
branch-site model usually deletes columns with gaps in the alignments when calculating posi-tive sites, so some sites located in deficient alignments may be regarded as posiposi-tive, whereas some true-positive sites may be missed. SP-score filtering, which focuses on filtering out such false-positive sites, can be used to reduce the false-positive rate and ensure the quality of the fil-tered positive sites. On the other hand, cDNA mapping can exclude false-positive sites that originate from mistakes in genome sequence assembly and gene annotation. The combination of these processes can thus filter out many false-positive sites and identify low-quality genome sequences, such as those for cynomolgus monkey, horse, and orangutan in this study.
cDNA sequences in previous genome-wide studies have generally been used as references for gene annotation [45–47]. In contrast, we used cDNA mapping as a novel method to identify positive sites with high quality. Because cDNA sequences are usually relatively short, current sequencing techniques can provide reliable sequences. Moreover, some sites can be mapped to more than one corresponding cDNA sequence. cDNA mapping can thus ensure the quality of the remaining positive sites. However, there are some limitations. More than 90% of sites can-not be matched with corresponding cDNA sequences, and the validity of these sites therefore cannot be checked using this method. Because cDNA sequences are usually sequenced for a specific purpose, corresponding cDNA sequences may not be available for some putative posi-tive sites, and genes with important evolutionary implications may be missed.
Positively-selected genes in seasonal and non-seasonal breeders
Evolutionary analysis of genome sequences can be used to identify specific, positively-selected genes in various species. The genetic mechanisms and potential environmental adaptations as-sociated with seasonal and non-seasonal breeding can then be inferred by functional analysis of positively-selected genes in the respective species.
The functions of positively-selected genes in non-seasonal breeding species reflect reproduc-tive tendencies such as sperm generation and cell proliferation. Two key genes perform these functions in humans:CGA(glycoprotein hormones, alpha polypeptide) is a gonadotropin
Table 3. Positively-selected genes in non-seasonal species filtered by SP scoring and corrected by cDNA mapping.
Species Gene Symbol Species ID Set P-χ2 test FDR correction
Human CGA ENST00000369582 Distant-Sspecies 0.000000 0.000779
Human TOMM6 ENST00000398884 Distant-Sspecies 0.000046 0.035968
Human CD151 ENST00000397420 Close-Sspecies 0.000045 0.029687
Human RRP8 ENST00000254605 Distant-Sspecies 0.000040 0.033188
Human ACCN4 ENST00000358078 Distant-Sspecies 0.000000 0.000808
Close-Sspecies 0.000000 0.000609
Human CHRNA1 ENST00000261007 Close-Sspecies 0.000000 0.000115
CE SNX5 CE_ENSP00000366998 Distant-Sspecies 0.000000 0.000004
Close-Sspecies 0.000000 0.000002
CE NCAPG CE_ENSP00000251496 Close-Sspecies 0.000013 0.002031
CE VPS33A CE_ENSP00000267199 Distant-Sspecies 0.000046 0.009533
Mouse SWI5 ENSMUST00000113400 Distant-Sspecies 0.000032 0.032039
Mouse NID2 ENSMUST00000022340 Distant-Sspecies 0.000005 0.005636
Mouse DHDH ENSMUST00000011526 Distant-Sspecies 0.000066 0.047987
Mouse DNAH1 ENSMUST00000048603 Distant-Sspecies 0.000004 0.005318
Rat INVS ENSRNOT00000011622 Distant-Sspecies 0.000001 0.001202
Rat GALK2 ENSRNOT00000012447 Distant-Sspecies 0.000146 0.037931
subunit [48,49], whileCD151functions in promoting metastasis, and increases the expression of phospho-extracellular signal-regulated kinase (ERK) [50,51]. Given that ERK is a component of the mitogen-activated protein kinase pathway, positive selection pressure on this gene may influence cell proliferation and differentiation [52,53]. Mutation ofDnah1in mice has been re-ported to cause male infertility [54,55], suggesting that it may play an important role in influ-encing mating behavior. Another crucial gene in rats,Invs, is involved in controlling
cytoskeletal organization and cell division, which are essential for reproduction [56,57]. More-over, this gene can interact with NPHP1 and NPHP3 that influence the Wnt signaling pathway, which may in turn influence kidney function and renal cell formation linked to spermatocyte and spermatid generation in the testis [58–60]. These positively-selected genes may reflect mod-ulation of the reproductive system under environmental pressure in non-seasonal breeding spe-cies, enabling them to breed throughout the year. The identification of positive sites focused on sperm generation and cell proliferation suggests that mutations in these genes may influence sperm quantity or reproductive capacity.
Genes that were positively selected in seasonal breeding species differed from those in non-seasonal species in having less focused functions. However, the orangutan provided the most valid positive genes among these species, and their functional analysis may help to explain some predominant characteristics of seasonal breeding species. The key gene,THRAP3 (thy-roid hormone receptor associated protein 3, also known asThrap150), is a selective coactivator for CLOCK-BMAL1 and promotes CLOCK-BMAL1 binding to target genes [61]. Moreover, THRAP3 can also interact with HELZ2, which regulates adipocyte differentiation [62].Clock Table 4. Positively-selected genes in seasonal species filtered by SP scoring and corrected by cDNA mapping.
Species Gene Symbol Species ID Set P-χ2 test FDR correction
Orangutan TADA1 ENSPPYT00000000676 Close-Sspecies 0.000001 0.000150
Orangutan LGALS3BP ENSPPYT00000010154 Close-Sspecies 0.000000 0.000000
Orangutan ZFR ENSPPYT00000017875 Close-Sspecies 0.000000 0.000001
Orangutan THRAP3 ENSPPYT00000001838 Close-Sspecies 0.000000 0.000001
Orangutan MTMR12 ENSPPYT00000017872 Close-Sspecies 0.000000 0.000000
Orangutan TMCC2 ENSPPYT00000000349 Close-Sspecies 0.000000 0.000018
Orangutan SLC44A2 ENSPPYT00000011142 Close-Sspecies 0.000016 0.001520
Orangutan MIPEP ENSPPYT00000006166 Close-Sspecies 0.000010 0.001011
Orangutan XRN2 ENSPPYT00000012494 Close-Sspecies 0.000000 0.000000
Orangutan RBM47 ENSPPYT00000017075 Close-Sspecies 0.000000 0.000000
Orangutan MBTPS1 ENSPPYT00000008921 Close-Sspecies 0.000138 0.008620
Orangutan FAM69A ENSPPYT00000001379 Close-Sspecies 0.000199 0.011474
Orangutan SLC43A2 ENSPPYT00000009117 Close-Sspecies 0.000992 0.042126
Orangutan RAB1B ENSPPYT00000003634 Close-Sspecies 0.000026 0.002287
Orangutan CMTM6 ENSPPYT00000016330 Close-Sspecies 0.000000 0.000003
Orangutan DARS2 ENSPPYT00000000592 Close-Sspecies 0.000004 0.000458
Orangutan AARS ENSPPYT00000008865 Close-Sspecies 0.000002 0.000217
Orangutan TH1L ENSPPYT00000012980 Close-Sspecies 0.000000 0.000000
Rabbit PLEK ENSOCUT00000023428 Distant-Sspecies 0.000113 0.016744
Rabbit SNX25 ENSOCUT00000024747 Distant-Sspecies 0.000005 0.002487
Dog ALB ENSCAFT00000037121 Distant-Sspecies 0.000019 0.004967
Horse SMC4 ENSECAT00000024113 Distant-Sspecies 0.000108 0.015518
Horse ANO6 ENSECAT00000013517 Distant-Sspecies 0.000007 0.003137
Horse GLIPR1 ENSECAT00000016491 Distant-Sspecies 0.000035 0.007439
andBmal1have previously been reported to be closely related to seasonal breeding behaviors [63], theTHRAP3mutation may thus influence the circadian rhythm of the reproductive sys-tem. This is supported by a previous study showing that thyroid hormone catabolism within the mediobasal hypothalamus regulated seasonal gonadotropin-releasing secretion [64]. How-ever, because orangutans live in Indonesia, which has high temperature throughout the year [30,65], they may not need to adjust their physical condition, such as lipid storage, to cope with cold weather.THRAP3may thus influence adipocyte differentiation, while other function-ally-related genes such asMTMR12[66] andZFR[67] would be positively selected because of such environmental conditions. In addition toTHRAP3, the positively-selected genesTH1L
andCMTM6may also help to explain the seasonal breeding behavior. As TH1L may have a similar function to TH1, which attenuates androgen signaling [68], while CMTM6 functions in spermatogenesis [69–71]. Evidence from previous studies suggests that orangutans produce 14 times less sperm than chimpanzees, which is a closely-related, but non-seasonal breeder [72]. Seasonal breeding in orangutans may thus be a consequence of circadian rhythm and limited sperm production, which restrict their breeding to the period from December to May, the most productive months in terms of food (fruit) supply, to ensure adequate food and energy for ef-fective reproduction [73].
Diversity in breeding behaviors can generally be attributed to mutations affecting endocrine mechanisms. Such mutations may be related to specific environmental conditions, such as tem-perature and food supply. In this study, positively-selected genes related to sperm generation were identified in both types of breeding species. Indeed, previous reports have indicated rapid evolution of sperm proteins in mammals [74,75]. Evolutionary mutations in these genes may not lead to the unique consequences associated with different breeding strategies. However, previous studies have indicated that the reproduction behavior in seasonal breeding species is largely under the regulation of the circadian rhythm system [64]. This is consistent with our re-sults, which showed thatTHRAP3, which is functionally-related to the CLOCK-BMAL1 sys-tem, was under positive selection pressure. The mechanisms determining breeding behaviors can be complicated, but evolution leads to adaptation to the environment, enabling well-adapted lineages to persist for many generations.
Conclusions
In this study, we conducted a precise, genome-wide scan to detect genes that were positively se-lected between seasonal and non-seasonal breeding species. The evolutionary analysis was de-signed to reduce the incidence of false-positive sites by SP filtering and cDNA mapping. Although the lack of cDNA sequences means that some positive genes may have been missed, the identification of valid, positively-selected genes with functions relating to spermatogenesis, cell proliferation, and circadian rhythm might indicate possible molecular mechanisms under-lying the seasonal and non-seasonal reproductive behaviors. Further developments in genome-sequencing technologies will allow the genome-sequencing and assembly of higher-quality genomes, and more accurate gene annotation, while the availability of more cDNA sequences will in-crease the value of cDNA mapping for improving the accuracy of evolutionary analysis.
Supporting Information
S1 Fig. Sites with extended sequences alignments.(A). Perfect alignment. (B). Acceptable alignment. (C). Unacceptable alignment because of large number of gaps. (D). Unacceptable alignment because of putative positive sites located in poorly-aligned sequences. (E). False neg-ative. SP scoring filtered out mistaken acceptable alignments.
S1 Table. Positive sites mapped with the corresponding cDNA sequences. (XLSX)
S2 Table. 1:1 gene orthologs.Gene orthologs were generated by BLAST, and the best hit of human versus the other species was then reversed. All identities were>60%.
(XLSX)
S3 Table. Lengths of gene sequences before and after alignments with different aligners. (XLSX)
S4 Table. Positive sites (BEB>0.95). (XLSX)
S5 Table. SP scores of positive sites after sequence alignment. (XLSX)
S6 Table. Positive sites after SP-score filtering. (XLSX)
S7 Table. Positive genes filtered by SP scoring. (XLSX)
Acknowledgments
We thank Prof. Bruce Lahn for his advice and comments. We also thank BGI-Shenzhen who provided the Chinese rhesus monkey and cynomolgus macaque genomes.
Author Contributions
Conceived and designed the experiments: HD XW YM. Performed the experiments: YM WZ JZ JC ST. Analyzed the data: MZ Y. Zhong YM. Contributed reagents/materials/analysis tools: WZ ML Y. Zhang. Wrote the paper: YM WZ JZ HD Y. Zhong.
References
1. Prendergast BJ. Internalization of seasonal time. Hormones and behavior. 2005; 48(5):503–11. Epub 2005/07/20. doi:10.1016/j.yhbeh.2005.05.013PMID:16026787.
2. Hut RA. Photoperiodism: shall EYA compare thee to a summer's day? Current biology: CB. 2011; 21 (1):R22–5. Epub 2011/01/11. doi:10.1016/j.cub.2010.11.060PMID:21215931.
3. Ims RA. The ecology and evolution of reproductive synchrony. Trends in ecology & evolution. 1990; 5-(5):135–40. Epub 1990/05/01. doi:10.1016/0169-5347(90)90218-3PMID:21232341.
4. Yang Z. PAML: a program package for phylogenetic analysis by maximum likelihood. Computer appli-cations in the biosciences: CABIOS. 1997; 13(5):555–6. Epub 1997/11/21. PMID:9367129.
5. Zhang J, Nielsen R, Yang Z. Evaluation of an improved branch-site likelihood method for detecting pos-itive selection at the molecular level. Molecular biology and evolution. 2005; 22(12):2472–9. Epub 2005/08/19. doi:10.1093/molbev/msi237PMID:16107592.
6. Bakewell MA, Shi P, Zhang J. More genes underwent positive selection in chimpanzee evolution than in human evolution. Proceedings of the National Academy of Sciences of the United States of America. 2007; 104(18):7489–94. Epub 2007/04/24. doi:10.1073/pnas.0701705104PMID:17449636; PubMed Central PMCID: PMC1863478.
7. Kosiol C, Vinar T, da Fonseca RR, Hubisz MJ, Bustamante CD, Nielsen R, et al. Patterns of positive se-lection in six Mammalian genomes. PLoS genetics. 2008; 4(8):e1000144. Epub 2008/08/02. doi:10. 1371/journal.pgen.1000144PMID:18670650; PubMed Central PMCID: PMC2483296.
9. Fletcher W, Yang Z. The effect of insertions, deletions, and alignment errors on the branch-site test of positive selection. Molecular biology and evolution. 2010; 27(10):2257–67. Epub 2010/05/08. doi:10. 1093/molbev/msq115PMID:20447933.
10. Loytynoja A, Goldman N. An algorithm for progressive multiple alignment of sequences with insertions. Proceedings of the National Academy of Sciences of the United States of America. 2005; 102 (30):10557–62. Epub 2005/07/08. doi:10.1073/pnas.0409137102PMID:16000407; PubMed Central PMCID: PMC1180752.
11. Loytynoja A, Goldman N. Phylogeny-aware gap placement prevents errors in sequence alignment and evolutionary analysis. Science (New York, NY). 2008; 320(5883):1632–5. Epub 2008/06/21. doi:10. 1126/science.1158395PMID:18566285.
12. Markova-Raina P, Petrov D. High sensitivity to aligner and high rate of false positives in the estimates of positive selection in the 12 Drosophila genomes. Genome research. 2011; 21(6):863–74. Epub 2011/03/12. doi:10.1101/gr.115949.110PMID:21393387; PubMed Central PMCID: PMC3106319. 13. Edgar RC. MUSCLE: multiple sequence alignment with high accuracy and high throughput. Nucleic acids research. 2004; 32(5):1792–7. Epub 2004/03/23. doi:10.1093/nar/gkh340PMID:15034147; PubMed Central PMCID: PMC390337.
14. Thompson JD, Gibson TJ, Higgins DG. Multiple sequence alignment using ClustalW and ClustalX. Cur-rent protocols in bioinformatics / editoral board, Andreas D Baxevanis [et al]. 2002; Chapter 2:Unit 2 3. Epub 2008/09/17. doi:10.1002/0471250953.bi0203s00PMID:18792934.
15. Schneider A, Souvorov A, Sabath N, Landan G, Gonnet GH, Graur D. Estimates of positive Darwinian selection are inflated by errors in sequencing, annotation, and alignment. Genome biology and evolu-tion. 2009; 1:114–8. Epub 2009/01/01. doi:10.1093/gbe/evp012PMID:20333182; PubMed Central PMCID: PMC2817407.
16. Mallick S, Gnerre S, Muller P, Reich D. The difficulty of avoiding false positives in genome scans for nat-ural selection. Genome research. 2009; 19(5):922–33. Epub 2009/05/05. doi:10.1101/gr.086512.108 PMID:19411606; PubMed Central PMCID: PMC2675981.
17. Altschul SF. Gap costs for multiple sequence alignment. Journal of theoretical biology. 1989; 138 (3):297–309. Epub 1989/06/08. PMID:2593679.
18. Gupta SK, Kececioglu JD, Schaffer AA. Improving the practical space and time efficiency of the short-est-paths approach to sum-of-pairs multiple sequence alignment. Journal of computational biology: a journal of computational molecular cell biology. 1995; 2(3):459–72. Epub 1995/01/01. PMID:8521275. 19. Mitani JC, Watts DP, Muller MN. Recent developments in the study of wild chimpanzee behavior.
Evo-lutionary Anthropology: Issues, News, and Reviews. 2002; 11(1):9–25. doi:10.1002/evan.10008 20. Sun Z, Zeng L, Hong B, Zhang G. Primary Research on Reproduction of Cynomolgus Monkeys in an
In-door Breeding Mode in Beijing Area. Chinese Journal of Comparative Medicine. 2008; 11:33–5. 21. Bronson FH. The reproductive ecology of the house mouse. The Quarterly review of biology. 1979; 54
(3):265–99. Epub 1979/09/01. PMID:390600.
22. Perry JS. The Reproduction of the Wild Brown Rat (Rattus norvegicusErxleben). Proceedings of the Zoological Society of London. 1945; 115(1–2):19–46. doi:10.1111/j.1096-3642.1945.tb00849.x 23. Harcourt AH, Harvey PH, Larson SG, Short RV. Testis weight, body weight and breeding system in
pri-mates. Nature. 1981; 293(5827):55–7. Epub 1981/09/03. PMID:7266658.
24. Hou J, Qu W, Chen L, Zhang H. Study of the Reproduction Eco-Behavior of Macaca mulatta in Taihang Mountains. Chinese Journal of Ecology. 1998; 17:22–5.
25. Pal SK, Ghosh B, Roy S. Dispersal behaviour of free-ranging dogs (Canis familiaris) in relation to age, sex, season and dispersal distance. Applied Animal Behaviour Science. 1998; 61(2):123–32. doi:10. 1016/s0168-1591(98)00185-3
26. Johnson L, Thompson DL Jr., Effect of seasonal changes in Leydig cell number on the volume of smooth endoplasmic reticulum in Leydig cells and intratesticular testosterone content in stallions. Jour-nal of reproduction and fertility. 1987; 81(1):227–32. Epub 1987/09/01. PMID:3668953.
27. Brambell FWR. The Reproduction of the Wild Rabbit Oryctolagus cuniculus (L.). Proceedings of the Zoological Society of London. 1944; 114(1–2):1–45. doi:10.1111/j.1096-3642.1944.tb00210.x 28. Yang Z, dos Reis M. Statistical properties of the branch-site test of positive selection. Molecular biology
and evolution. 2011; 28(3):1217–28. Epub 2010/11/23. doi:10.1093/molbev/msq303PMID:21087944. 29. Watts DP. Mountain gorilla reproduction and sexual behavior. American Journal of Primatology. 1991;
24(3–4):211–25. doi:10.1002/ajp.1350240307
31. Sousa MBC, Peregrino HPA, Cirne MFC, Mota MTS. Reproductive patterns and birth seasonality in a South-American breeding colony of common marmosets,Callithrix jacchus. Primates. 1999; 40 (2):327–36.
32. Flicek P, Amode MR, Barrell D, Beal K, Brent S, Carvalho-Silva D, et al. Ensembl 2012. Nucleic acids research. 2012; 40(Database issue):D84–90. Epub 2011/11/17. doi:10.1093/nar/gkr991PMID: 22086963; PubMed Central PMCID: PMC3245178.
33. Yan G, Zhang G, Fang X, Zhang Y, Li C, Ling F, et al. Genome sequencing and comparison of two non-human primate animal models, the cynomolgus and Chinese rhesus macaques. Nature biotechnology. 2011; 29(11):1019–23. Epub 2011/10/18. doi:10.1038/nbt.1992PMID:22002653.
34. Altschul SF, Gish W, Miller W, Myers EW, Lipman DJ. Basic local alignment search tool. Journal of mo-lecular biology. 1990; 215(3):403–10. Epub 1990/10/05. doi:10.1016/s0022-2836(05)80360-2PMID: 2231712.
35. Villanueva-Canas JL, Laurie S, Alba MM. Improving genome-wide scans of positive selection by using protein isoforms of similar length. Genome biology and evolution. 2013; 5(2):457–67. Epub 2013/02/ 05. doi:10.1093/gbe/evt017PMID:23377868; PubMed Central PMCID: PMC3590775.
36. Arbiza L, Dopazo J, Dopazo H. Positive selection, relaxation, and acceleration in the evolution of the human and chimp genome. PLoS computational biology. 2006; 2(4):e38. Epub 2006/05/10. doi:10. 1371/journal.pcbi.0020038PMID:16683019; PubMed Central PMCID: PMC1447656.
37. Rhesus Macaque Genome S, Analysis C, Gibbs RA, Rogers J, Katze MG, Bumgarner R, et al. Evolu-tionary and biomedical insights from the rhesus macaque genome. Science (New York, NY). 2007; 316 (5822):222–34. Epub 2007/04/14. doi:10.1126/science.1139247PMID:17431167.
38. Vilella AJ, Severin J, Ureta-Vidal A, Heng L, Durbin R, Birney E. EnsemblCompara GeneTrees: Com-plete, duplication-aware phylogenetic trees in vertebrates. Genome research. 2009; 19(2):327–35. Epub 2008/11/26. doi:10.1101/gr.073585.107PMID:19029536; PubMed Central PMCID: PMC2652215.
39. Toll-Riera M, Laurie S, Alba MM. Lineage-specific variation in intensity of natural selection in mammals. Molecular biology and evolution. 2011; 28(1):383–98. Epub 2010/08/07. doi:10.1093/molbev/msq206 PMID:20688808.
40. Carneiro M, Albert FW, Melo-Ferreira J, Galtier N, Gayral P, Blanco-Aguiar JA, et al. Evidence for wide-spread positive and purifying selection across the European rabbit (Oryctolagus cuniculus) genome. Molecular biology and evolution. 2012; 29(7):1837–49. Epub 2012/02/10. doi:10.1093/molbev/mss025 PMID:22319161; PubMed Central PMCID: PMC3375474.
41. Laurie S, Toll-Riera M, Rado-Trilla N, Alba MM. Sequence shortening in the rodent ancestor. Genome research. 2012; 22(3):478–85. Epub 2011/12/01. doi:10.1101/gr.121897.111PMID:22128134; PubMed Central PMCID: PMC3290783.
42. Felsenstein J. PHYLIP: Phylogeny Inference Package. University of Washington, Seattle, WA. (http:// evolution.genetics.washington.edu/phylip.html). 1993.
43. Benjamini Y, Hochberg Y. Controlling the false discovery rate: a practical and powerful approach to multiple testing. Journal of the Royal Statistical Society Series B (Methodological). 1995:289–300. 44. Tamura K, Peterson D, Peterson N, Stecher G, Nei M, Kumar S. MEGA5: molecular evolutionary
genet-ics analysis using maximum likelihood, evolutionary distance, and maximum parsimony methods. Mo-lecular biology and evolution. 2011; 28(10):2731–9. Epub 2011/05/07. doi:10.1093/molbev/msr121 PMID:21546353; PubMed Central PMCID: PMC3203626.
45. Furuno M, Kasukawa T, Saito R, Adachi J, Suzuki H, Baldarelli R, et al. CDS annotation in full-length cDNA sequence. Genome research. 2003; 13(6B):1478–87. Epub 2003/06/24. doi:10.1101/gr. 1060303PMID:12819146; PubMed Central PMCID: PMC403693.
46. Kim DS, Huh JW, Kim YH, Park SJ, Lee SR, Chang KT. Full-length cDNA sequences from Rhesus monkey placenta tissue: analysis and utility for comparative mapping. BMC genomics. 2010; 11:427. Epub 2010/07/14. doi:10.1186/1471-2164-11-427PMID:20624290; PubMed Central PMCID: PMC2996955.
47. Uenishi H, Morozumi T, Toki D, Eguchi-Ogawa T, Rund LA, Schook LB. Large-scale sequencing based on full-length-enriched cDNA libraries in pigs: contribution to annotation of the pig genome draft se-quence. BMC genomics. 2012; 13:581. Epub 2012/11/16. doi:10.1186/1471-2164-13-581PMID: 23150988; PubMed Central PMCID: PMC3499286.
48. Rebers F, Tensen C, Schulz R, Goos HT, Bogerd J. Modulation of glycoprotein hormoneα-and gonad-otropin IIβ-subunit mRNA levels in the pituitary gland of mature male African catfish, Clarias gariepinus. Fish Physiology and Biochemistry. 1997; 17(1–6):99–108.
50. Yang W, Li P, Lin J, Zuo H, Zuo P, Zou Y, et al. CD151 promotes proliferation and migration of PC3 cells via the formation of CD151-integrin alpha3/alpha6 complex. Journal of Huazhong University of Science and Technology Medical sciences = Hua zhong ke ji da xue xue bao Yi xue Ying De wen ban = Huazhong keji daxue xuebao Yixue Yingdewen ban. 2012; 32(3):383–8. Epub 2012/06/12. doi:10. 1007/s11596-012-0066-yPMID:22684562.
51. Yue S, Mu W, Zoller M. Tspan8 and CD151 promote metastasis by distinct mechanisms. European journal of cancer (Oxford, England: 1990). 2013; 49(13):2934–48. Epub 2013/05/21. doi:10.1016/j. ejca.2013.03.032PMID:23683890.
52. Jang YN, Baik EJ. JAK-STAT pathway and myogenic differentiation. Jak-Stat. 2013; 2(2):e23282. Epub 2013/09/24. doi:10.4161/jkst.23282PMID:24058805; PubMed Central PMCID: PMC3710318. 53. Weber-Nordt RM, Mertelsmann R, Finke J. The JAK-STAT pathway: signal transduction involved in
proliferation, differentiation and transformation. Leukemia & lymphoma. 1998; 28(5–6):459–67. Epub 1998/06/05. doi:10.3109/10428199809058353PMID:9613975.
54. Ben Khelifa M, Coutton C, Zouari R, Karaouzene T, Rendu J, Bidart M, et al. Mutations in DNAH1, which encodes an inner arm heavy chain dynein, lead to male infertility from multiple morphological ab-normalities of the sperm flagella. American journal of human genetics. 2014; 94(1):95–104. Epub 2013/ 12/24. doi:10.1016/j.ajhg.2013.11.017PMID:24360805; PubMed Central PMCID: PMC3882734. 55. Neesen J, Kirschner R, Ochs M, Schmiedl A, Habermann B, Mueller C, et al. Disruption of an inner arm
dynein heavy chain gene results in asthenozoospermia and reduced ciliary beat frequency. Human mo-lecular genetics. 2001; 10(11):1117–28. Epub 2001/05/24. PMID:11371505.
56. Veland IR, Montjean R, Eley L, Pedersen LB, Schwab A, Goodship J, et al. Inversin/Nephrocystin-2 is required for fibroblast polarity and directional cell migration. PloS one. 2013; 8(4):e60193. Epub 2013/ 04/18. doi:10.1371/journal.pone.0060193PMID:23593172; PubMed Central PMCID: PMC3620528. 57. Werner ME, Ward HH, Phillips CL, Miller C, Gattone VH, Bacallao RL. Inversin modulates the cortical
actin network during mitosis. American journal of physiology Cell physiology. 2013; 305(1):C36–47. Epub 2013/03/22. doi:10.1152/ajpcell.00279.2012PMID:23515530; PubMed Central PMCID: PMC3725518.
58. Lienkamp S, Ganner A, Walz G. Inversin, Wnt signaling and primary cilia. Differentiation; research in bi-ological diversity. 2012; 83(2):S49–55. Epub 2011/12/31. doi:10.1016/j.diff.2011.11.012PMID: 22206729.
59. Benzing T, Simons M, Walz G. Wnt signaling in polycystic kidney disease. Journal of the American So-ciety of Nephrology: JASN. 2007; 18(5):1389–98. Epub 2007/04/13. doi:10.1681/asn.2006121355 PMID:17429050.
60. Nurnberger J, Kavapurackal R, Zhang SJ, Opazo Saez A, Heusch G, Philipp T, et al. Differential tissue distribution of the Invs gene product inversin. Cell and tissue research. 2006; 323(1):147–55. Epub 2005/07/12. doi:10.1007/s00441-005-0012-4PMID:16007506.
61. Lande-Diner L, Boyault C, Kim JY, Weitz CJ. A positive feedback loop links circadian clock factor CLOCK-BMAL1 to the basic transcriptional machinery. Proceedings of the National Academy of Sci-ences of the United States of America. 2013; 110(40):16021–6. Epub 2013/09/18. doi:10.1073/pnas. 1305980110PMID:24043798; PubMed Central PMCID: PMC3791755.
62. Katano-Toki A, Satoh T, Tomaru T, Yoshino S, Ishizuka T, Ishii S, et al. THRAP3 interacts with HELZ2 and plays a novel role in adipocyte differentiation. Molecular endocrinology (Baltimore, Md). 2013; 27 (5):769–80. Epub 2013/03/26. doi:10.1210/me.2012-1332PMID:23525231.
63. Lincoln GA, Andersson H, Loudon A. Clock genes in calendar cells as the basis of annual timekeeping in mammals—a unifying hypothesis. The Journal of endocrinology. 2003; 179(1):1–13. Epub 2003/10/ 08. PMID:14529560.
64. Yoshimura T. Neuroendocrine mechanism of seasonal reproduction in birds and mammals. Animal sci-ence journal = Nihon chikusan Gakkaiho. 2010; 81(4):403–10. Epub 2010/07/29. doi: 10.1111/j.1740-0929.2010.00777.xPMID:20662808.
65. Rijksen HD, Wageningen L. A fieldstudy on Sumatran orang utans (Pongo pygmaeus abelii, Lesson 1827): Ecology, behaviour and conservation: H. Veenman Netherlands; 1978.
66. Gupta VA, Hnia K, Smith LL, Gundry SR, McIntire JE, Shimazu J, et al. Loss of catalytically inactive lipid phosphatase myotubularin-related protein 12 impairs myotubularin stability and promotes centro-nuclear myopathy in zebrafish. PLoS genetics. 2013; 9(6):e1003583. Epub 2013/07/03. doi:10.1371/ journal.pgen.1003583PMID:23818870; PubMed Central PMCID: PMC3688503.
68. Yang Y, Zou W, Kong X, Wang H, Zong H, Jiang J, et al. Trihydrophobin 1 attenuates androgen signal transduction through promoting androgen receptor degradation. Journal of cellular biochemistry. 2010; 109(5):1013–24. Epub 2010/01/14. doi:10.1002/jcb.22484PMID:20069563.
69. Stittrich AB, Haftmann C, Sgouroudis E, Kuhl AA, Hegazy AN, Panse I, et al. The microRNA miR-182 is induced by IL-2 and promotes clonal expansion of activated helper T lymphocytes. Nature immunology. 2010; 11(11):1057–62. Epub 2010/10/12. doi:10.1038/ni.1945PMID:20935646.
70. Zhong W-d, Zeng G-q, Cai Y-b, Tan Y, Hen S, Dai Q, et al. Pathological changes in seminiferous tu-bules in infertility rats induced by chemokine-like factor I. Chin J Exp Surg. 2003; 20:1027–8. 71. Liu D, Yin C, Zhang Y, Tian L, Li T, Li D, et al. Human CMTM2/CKLFSF2 enhances the ligand-induced
transactivation of the androgen receptor. Chinese Science Bulletin. 2009; 54(6):1050–7.
72. Fujii-Hanamoto H, Matsubayashi K, Nakano M, Kusunoki H, Enomoto T. A comparative study on testic-ular microstructure and relative sperm production in gorillas, chimpanzees, and orangutans. Am J Pri-matol. 2011; 73(6):570–7. Epub 2011/02/03. doi:10.1002/ajp.20930PMID:21287585.
73. Wich SA, Utami-Atmoko SS, Setia TM, Rijksen HD, Schurmann C, van Hooff JA, et al. Life history of wild Sumatran orangutans (Pongo abelii). Journal of human evolution. 2004; 47(6):385–98. Epub 2004/ 11/30. doi:10.1016/j.jhevol.2004.08.006PMID:15566945.
74. Torgerson DG, Kulathinal RJ, Singh RS. Mammalian sperm proteins are rapidly evolving: evidence of positive selection in functionally diverse genes. Molecular biology and evolution. 2002; 19(11):1973– 80. Epub 2002/11/02. PMID:12411606.