THE INFORMATION CONTENT OF THE FARM AND UNIT LEVEL NUTRIENT
BALANCES FOR THE MANAGEMENT
A VÁLLALATI ÉS A FŐÁGAZATI SZINTŰ TÁPANYAGMÉRLEGEK
INFORMÁCIÓSZOLGÁLTATÁSA A VEZETŐI DÖNTÉSEKHEZ
SOMOGYI, T., HOFFMANN, A.
Tamás Somogyi, [email protected], * correspondence author,
András Hoffmann, University of Pannon, Georgikon Faculty of Agriculture, Keszthely, Hungary
Manuscript received: September 25, 2006; Reviewed: December 7, 2006; Accepted for publication: December 11, 2006
ABSTRACT
The farm gate balance is well known from the environmental literature. This method is not suitable in every case to show the nutrient load for the environment of agricultural companies that is the reason why unit level internal nutrient balances are applied to express the level of nutrient pollution on the environment. These also help to determine the source of the pollution. With the survey of the nutrient flows within the farm we determine the keystones of nutrient management to control the nutrient load of the pollution sources. On the basis of the results and the controlled data of the unit level internal balances we make recommendations for the most appropriate environmental policy instrument to reduce the nutrient pollution.
KEY WORDS: nutrient accounting system, internal nutrient balance, environmental pollution, agriculture
ÖSSZEFOGLALÁS
A tápanyag-könyvelési rendszer a szakirodalomban már igen elterjedt „farm gate balance” néven vált ismertté. E módszer azonban nem minden esetben alkalmas a mezőgazdasági vállalatok környezetre gyakorolt tápanyagterhelésének kimutatására, ezért a „farm gate balance” módszere mellett elsősorban főágazati szintű belső tápanyagmérlegeket állítottunk össze. Ez utóbbi mérlegek segítségével meghatározhatók a vállalat környezetszennyezésének forrásai is. A vállalaton belül lezajló tápanyagfolyamatok feltérképezésével, a tápanyag-gazdálkodás szempontjából fontos sarokpontok meghatározásával ellenőriztük a szennyező források környezetre gyakorolt tápanyagterhelését. A főágazati szintű belső tápanyagmérlegek eredményei alapján javaslatot fogalmaztunk meg a tápanyagterhelést csökkentő környezetpolitikai eszközök kiválasztására és alkalmazására.
INTRODUCTION
The fast industrial development substantially influenced European agriculture in the second half of the 20. century. The amount of fertilizers and pesticides utilized in the production processes increased; the number of intensive animal stocks and the efficiency of the agricultural production were expanded. These factors had large impact not only on the quality and quantity of the agricultural outputs but harmed the state of the environment. Development of cultivation and the use of chemicals engendered soil acidification, while the manure disposal problems induced the eutrophication of surface water and the nitrate problems of groundwater. Environmental problems caused by agriculture have appeared from the early 1970s and from this time they have become more and more intensive. Several publications mentioned and dealt with the harmful effects of agricultural production in the 1970s ([3], [7], [16]) and made suggestions for solving them ([4]). Despite the early recognition of the environmental side effects governmental policies and measures were imposed on agriculture to limit the environmental problems from only the 1980s ([9]). One of the first environmental policy instruments was introduced in 1986 in the Netherlands. The Dutch government regulated livestock husbandry through the imposition of phosphate based manure production rights ([19]). Afterwards different environmental policy instruments were initiated in some European countries (e. g. fertilizer tax in Sweden, Denmark and Norway) ([20]) but these instruments did not become general in the European Union.
“From the early 1990s onwards, European Union environmental policies and measures have increasingly affected agricultural production and started to overrule national environmental policies and measures” ([9]). Nowadays one of the most important environmental policy instruments in the agriculture of the European Union is the Nitrate Directive (91/676/EC), which was agreed upon by all member states in 1991. The objective of the Nitrate Directive is to decrease agricultural water pollution induced by nitrate and prevent further nitrate pollution. The Nitrate Directive limits not only the amount of animal manure that could be applied to agricultural land but the period of its application, too.
Countries where intensive animal production with small agricultural land is characteristic were affected disadvantageously by the regulation. In these countries the direct implementation of the manure application restriction could have contributed to a serious cutback in animal livestock ([12]). In this way the Mineral Accounting System (MINAS) was introduced in the Netherlands, which was completed by the manure
application restriction later.
The MINAS is a farm gate balance well known from the environmental literature that focuses on nutrients getting into the farming unit within purchased inputs and those leaving it in sold products (or in other ways) (see [2], [6], [8], [10], [17]). The positive difference of the farm gate balance is the nutrient surplus and the negative difference is the nutrient deficit both expressed in nutrient kg. The nutrient surplus can be considered as nutrient loss, which can be harmful for the environment. The main aims of the farm gate balance are to enhance the efficiency of nutrient management of the farms and to ensure compliance with the Nitrate Directive. In the cause of reducing nutrient loss a stimulating system was initiated in the same time with MINAS. On the basis of the stimulating system a certain amount of nutrient expressed in kg was determined, which is not considered to pollute the environment. But farms have to pay levies when nutrient surpluses exceed these target surpluses (arable land: 100 kg for nitrogen nutrient per ha, grassland: 180 kg for nitrogen nutrient per ha) ([10], [12]).
The farm gate balance, however, could not become general in the European Union. The main criticism against the method is that the farm gate balance is based on the “black box” principle comparing the amounts of nutrients entering the farm from the input markets to those leaving it towards the output markets, considering the difference between the two as nutrient loss ([18]). Farm gate balance does not take into account nutrient flows within the farm. In this way this method could not manage the stock changes. Due to the unsold products at the end of the farming year the difference in the nutrient contents of the purchased and sold materials can be higher than in the former year. The major part of the difference is not a loss, nor is it stored in the soil, but is contained in the unsold stocks of the farm ([18]).
In Hungary the agricultural farms generally have unsold stock at the end of the farming year. If they adopt the concept of farm gate balance for determining the nutrient loss of the production progress the amount of balance of the purchased and sold nutrients would distort the information about the nutrient management of the farm. To avoid this problem it needs to identify the nutrient flows within the farm, in order to clarify the “black box” principle. Instead of farm gate balance it is worth setting up the internal nutrient balance at farm level comparing the annual yields and the annual amounts of nutrient utilized in the farm. The farm level internal nutrient balance shows more precise information about the nutrient management of farms than the farm gate balance ([17], [18]).
method in practice. If the agricultural firm has several different units (crop production and animal husbandry enterprises) and the production processes of these units are integrated with each other, the internal nutrient balance at farm level could lead to false information about the nutrient management of the farm.
The internal nutrient balance at farm level could show an efficient nutrient management as a result while nutrient processes may have happened in opposite directions in the units of the farm. Nutrient deficit in the crop production unit means the utilization of nutrients having been spread in the former years. The nutrient surplus in the animal husbandry means nutrient accumulation in the environment. The sum of the positive (nutrient surplus) and negative (nutrient deficit) nutrient differences could obscure the inefficiency of the farm nutrient management. To solve this problem the internal nutrient balances could be set up at unit level, and in this way nutrient flows between the units could also be surveyed.
MATERIALS AND METHODS
The objective of our study was to set up farm and unit level nutrient balances for nitrogen and phosphorus nutrients for the 2001 – 2003 farming years. We examined whether MINAS is suitable or not to reduce the nutrient load for the environment, and determined the nutrient load of the units of the farm. At the end of our examination we surveyed the main keystones of the unit level internal nutrient balances to control our results.
The main agricultural activity of the farm is animal husbandry, which is served by the crop unit. The major part of the crop yields is consumed by animals and the smaller part of the crop yield is sold. It has a cattle enterprise specialized to dairy farming of nearly 700 animals, for which the fodder is produced mainly by the company’s own arable land (above 1000 hectares) and by the silage coming from its 300 hectares meadow and pasture area. The smaller part of the fodder is purchased from the market.
In the first place we dealt with internal nutrient balances, which could whiten the “black box” principle; internal nutrient balances were divided into 3 separate balances (the crop, fodder mixer and animal husbandry units. Differences in the approaches may be found, some of the researchers (see e.g. [10]) do not count with all possible components (e.g. the nitrogen fixation by legumes, atmospheric deposition), while others (as e.g. [11], [15]) include these components in their calculations. In our analyses we made an effort to take into account only precise objective data found in the analytic records of inventories of the farm. But once we made an exception
for the amount of ammonia in nitrogen kg volatilized from the production processes, which was taken into account by the data of the literature ([3]).
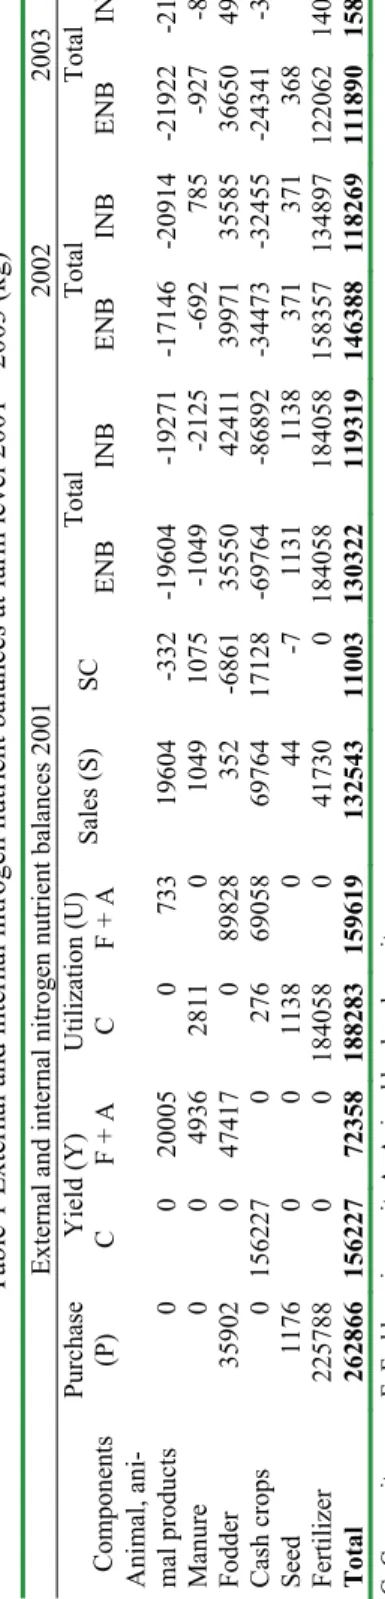
The primary data sources for farm and unit level nutrient balances are usually available within the traditional accounting system, namely the quantities given in the analytic records of inventories. The respective nutrient contents of the various plant and animal materials and products (e.g. crop yields, fodders, fertilizers, manures, livestock, animal products, etc.) are attached to the quantities of these materials given by the analytic records according to the form of stock change. The unit nutrient contents may be found in the relevant literature ([1], [5], [13], [14]) and in research results by Katalin Sárdi. Then the following values were computed ([18]):
• The external nutrient balance (ENB, farm gate balance) is the difference of nutrients entering the farm with purchased materials (P) and leaving it with sold stock (S) including perished animals (ENB = P - S). • The internal nutrient balance (INB) is the difference of nutrients utilized by the production processes (U) and the nutrients leaving the farm with the yields or outputs (Y) (INB = U - Y).
• The stock change (SC) is the difference of nutrients of closing balance and opening balance of the inventories, and is the same as the difference of external and internal nutrient balances (SC = ENB – INB). The balances of the main farming units can be defined in a similar way to those of the “whole farm balances”: • The internal nutrient balance of the animal husbandry enterprise (AINB) is the difference of nutrients utilized for livestock production and the yields of the livestock enterprise.
• The internal nutrient balance of the crop production enterprise (CINB) is the difference of nutrients utilized for crop production and the yields of the crop enterprise.
RESULTS AND DISCUSSIONS
Table 1 and 2 show that there is some difference between the results of the external and internal nutrient balances at farm level. The differences confirm our former statement that in the presence of the stock changes at an agricultural firm it is better to set up the internal nutrient balance instead of external nutrient balance (farm gate balance) at farm level to get information about the nutrient management.
According to the results (both nitrogen and phosphorus) of internal nutrient balances at farm level we can establish that the efficiency of the nutrient utilization changed for the worse in 2003. (The amounts of nutrient surpluses - both nitrogen and phosphorus - are the highest in 2003). The results cannot give suitable information for the management to reduce surpluses and to improve the efficiency of nutrient management. The reason is that the internal nutrient balance at farm level cannot explore which unit or production process needs to get intervention to stop the inefficiency of nutrient utilization. In favour of supporting management it is important to know which unit causes significant nutrient loads for the environment. For this reason, in the following analyses we dealt only with setting up internal nutrient balances at unit level. Table 3 was completed for a new factor, is the ammonia volatilized from the production processes expressed in nitrogen kg. The reason to count with ammonia is that one of the aims of the Nitrate Directive is to reduce the nitrogen surplus gone to the soil. In this way nutrient balances should not contain the amount of nitrogen which is volatilized into the air as ammonia. In our analyses in farm level internal nutrient balance we did not take into account the amount of ammonia. Disregarding ammonia we could compare the information content of the external nutrient balance with the internal nutrient balance at farm level.
Table 3 shows the results of the unit level internal nutrient balances. We could establish that each unit of the farm contributed to the nitrogen loss. The detailed amounts could explain the increased nitrogen surplus in 2003 (compared to the former years). The decrease of the efficiency of utilized nutrient could be connected to the crop enterprise; the main reason of the decrease of efficiency was the extremely dry weather. However, there is nitrogen nutrient loss gone to the soil in the animal husbandry enterprise, too. The inefficiency of utilized nitrogen nutrient probably derived from the lack of suitable manure disposal. To identify the nutrient inefficiency of the production processes at unit level is the first step for the management to solve the nutrient management problems.
If the Mineral Accounting System (farm gate balance, ENB) were set up in the case of the farm it would not
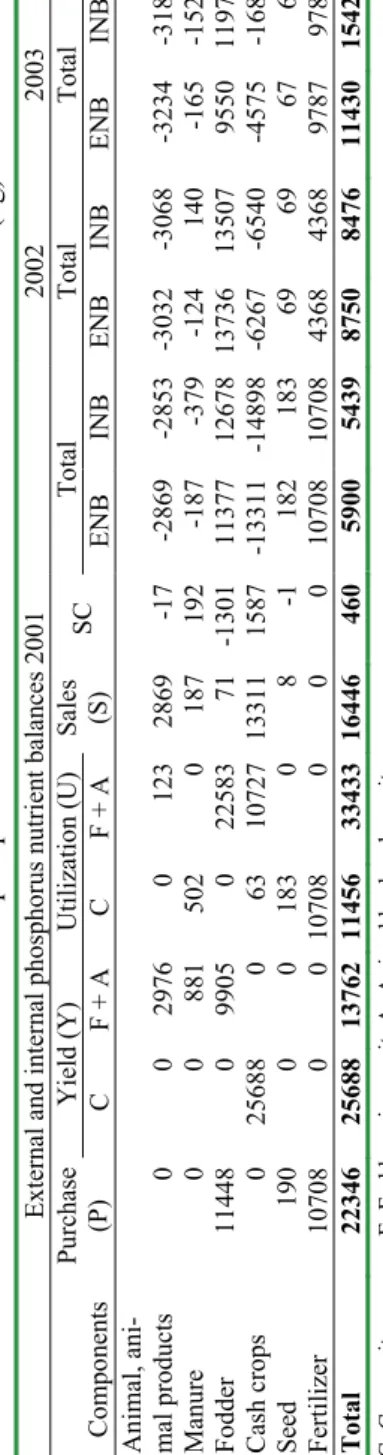
Ta bl e 2 Ex te rn al a nd in te rn al p ho sp ho ru s n ut rie nt b al an ce s a t f ar m le ve l 2 00 1 – 20 03 (k g) Ex te rn al a nd in te rn al p ho sp ho ru s n ut rie nt b al an ce s 2 00 1 20 02 20 03 Y ie ld (Y ) U til iz at io n (U ) To ta l To ta l To ta l Components Purchase (P ) C F + A C F + A Sa le s (S ) SC ENB INB ENB INB ENB INB A ni m al , a ni -mal products 0 0 2976 0 123 2869 -17 -2869 -2853 -3032 -3068 -3234 -3189 Manure 0 0 881 502 0 187 192 -187 -379 -124 140 -165 -1529 Fodder 11448 0 9905 0 22583 71 -1301 11377 12678 13736 13507 9550 11971 Cash crops 0 25688 0 63 10727 13311 1587 -13311 -14898 -6267 -6540 -4575 -1686 Seed 190 0 0 183 0 8 -1 182 183 69 69 67 67 Fertili zer 10708 0 0 10708 0 0 0 10708 10708 4368 4368 9787 9787 Total 22346 25688 13762 11456 33433 16446 460 5900 5439 8750 8476 11430 15421 C : C ro p un it F: F od de r m ix er u ni t A : A ni m al h us ba nd ry u ni t
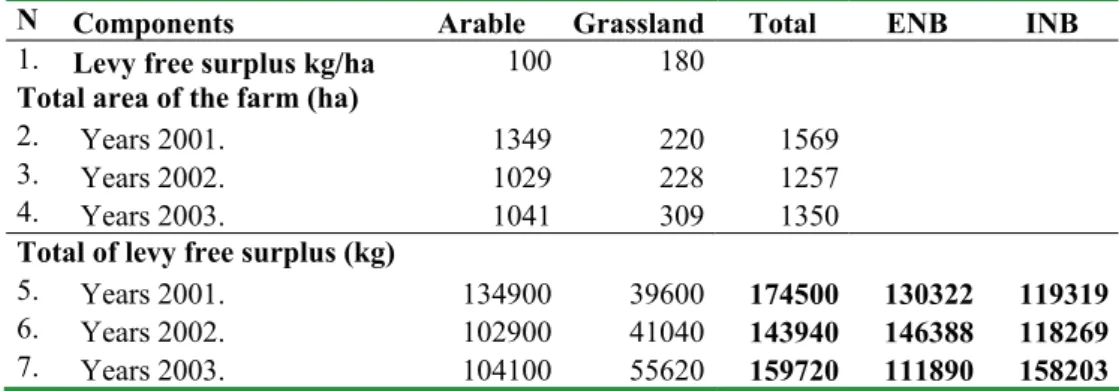
stimulate the management to reduce the nutrient losses of the units. The nutrient amount of levy free surpluses defined by MINAS exceeds or is nearly equal to the results of the external nutrient balance (farm gate balance) at farm level (Table 4). The high amounts of levy free surpluses could hide the nutrient load for the environment and whenever the nutrient surpluses exceed the target amount for the farm, it does not influence significantly the fiscal policy of the farm.
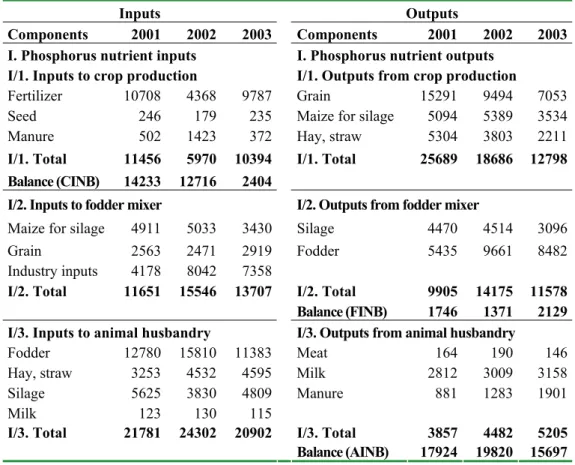
The detailed results of the internal phosphorus balances at unit level show that the nutrients flowed in opposite directions between the units of the farm (Table 5). The phosphorus amount of output exceeded the amount of input in the crop production unit that records the exhaustion of the nutrient resources gone to the soil in the former years. However, there were phosphorus accumulations in the animal husbandry unit from 2001 to 2003. The results of the internal phosphorus balances at unit level reinterpret the information content of the farm level internal phosphorus balance. We can establish that the reason for the favourable phosphorus surpluses at farm level in 2001 (5439 kg) and 2002 (8477 kg) was the significant nutrient deficits in the crop enterprise. The phosphorus deficits of the crop unit could reduce at farm level the amount of nutrient accumulations of the animal husbandry one (Diagram 1). The amounts on the top of the columns represent the overall results of the farm level internal phosphorus balances.
The data of the internal phosphorus balances at unit level could question the information content of the farm level internal phosphorus balance because the management can get false information about the nutrient management without the results of the unit level internal nutrient balances.
Table 3 Internal nitrogen nutrient balances at unit level 2001 – 2003 (kg)
Inputs Outputs
Components 2001 2002 2003 Components 2001 2002 2003 I. Nitrogen nutrient inputs I. Nitrogen nutrient outputs
I/1. Inputs to crop production I/1. Outputs from crop production
Fertilizer 184058 134897 140762 Grain 79440 50868 36360 Seed 1415 1070 1356 Maize for silage 28489 30839 18528 Manure 2811 7968 2084 Hay, straw 48298 34223 21277
I/1. Total 188284 143935 144202 I/1. Total 156227 115930 76165 Balance (CINB) 32057 28005 68037 I/2. Inputs to fodder mixer I/2. Outputs from fodder mixer
Maize for silage 26843 27634 17592 Silage 25786 26454 17029 Grain 12863 12283 15178 Fodder 21631 35975 45952 Industry inputs 9348 26061 32528
I/2. Total 49054 65978 65298 I/2. Total 47417 62429 62981 Balance (FINB) 1637 3549 2317 I/3. Inputs to animal husbandry I/31. Outputs from animal husbandry
Fodder 49540 49684 52033 Meat 3286 3799 2913 Hay 29351 42858 39391 Milk 16719 17890 18779 Silage 30940 22269 28077 Manure 4936 7183 10645 Milk 733 776 684 I/32. Non-market outputs from animal husbandry
Ammonia 57612 60448 59923
I/3. Total 110564 115587 120185 I/3. Total 82553 89320 92260 Balance (AINB) 28011 26267 27925
Table 4 Results of the examination of nitrogen surplus taxation
N Components Arable Grassland Total ENB INB 1. Levy free surplus kg/ha 100 180 Total area of the farm (ha)
2. Years 2001. 1349 220 1569 3. Years 2002. 1029 228 1257 4. Years 2003. 1041 309 1350 Total of levy free surplus (kg)
5. Years 2001. 134900 39600 174500 130322 119319 6. Years 2002. 102900 41040 143940 146388 118269 7. Years 2003. 104100 55620 159720 111890 158203
of nitrogen nutrient content of manure estimated by the data of the literature ([3]). The results of the diagram show that the factors of the internal nutrient balances at animal husbandry in 2001 could estimate approximately well the whole nutrient management of the enterprise from the data of traditional accounting. The amounts
Table 5 Internal phosphorus nutrient balances at unit level 2001 – 2003 (kg)
Inputs Outputs
Components 2001 2002 2003 Components 2001 2002 2003 I. Phosphorus nutrient inputs I. Phosphorus nutrient outputs
I/1. Inputs to crop production I/1. Outputs from crop production
Fertilizer 10708 4368 9787 Grain 15291 9494 7053 Seed 246 179 235 Maize for silage 5094 5389 3534 Manure 502 1423 372 Hay, straw 5304 3803 2211
I/1. Total 11456 5970 10394 I/1. Total 25689 18686 12798 Balance (CINB) 14233 12716 2404
I/2. Inputs to fodder mixer I/2. Outputs from fodder mixer
Maize for silage 4911 5033 3430 Silage 4470 4514 3096 Grain 2563 2471 2919 Fodder 5435 9661 8482 Industry inputs 4178 8042 7358
I/2. Total 11651 15546 13707 I/2. Total 9905 14175 11578 Balance (FINB) 1746 1371 2129 I/3. Inputs to animal husbandry I/3. Outputs from animal husbandry
Fodder 12780 15810 11383 Meat 164 190 146 Hay, straw 3253 4532 4595 Milk 2812 3009 3158 Silage 5625 3830 4809 Manure 881 1283 1901 Milk 123 130 115
I/3. Total 21781 24302 20902 I/3. Total 3857 4482 5205 Balance (AINB) 17924 19820 15697
CONCLUSIONS
On the basis of our examination we can establish that it is worth setting up the unit level internal nutrient balances instead of farm level internal and external (farm gate balance) nutrient balances to determine the efficiency of the nutrient utilization (nutrient management) of the farm. The results of the nutrient balances at farm level could not provide appropriate (well-detailed) information for the management about the nutrient management of the production processes when there is both nutrient surplus and nutrient deficit in the various units of the farm. The contribution of the units to the nutrient surpluses or deficits varies one by one. In this way different environmental policy instruments are needed to reduce the inefficiency of utilized nutrients and the nutrient load for the environment. In the analysed case study the nitrogen nutrient surpluses in the crop unit are higher than in the animal husbandry and fodder mixer ones. On the other hand the nutrient load of the crop enterprise is lower than the others. The reason is that the nutrient surpluses in the crop enterprise are spread over the lands
Directive. The regulation contributes to improve the manure disposal by initiating the construction of manure storage facilities.
ACKNOWLEDGEMENT
The authors gratefully acknowledge the financial support from the Hungarian National Scientific Research Fund (OTKA), research project no. OTKA K 060444.
REFERENCES
[1] Barabás E., A takarmányozás zsebkönyve, Mezőgazdasági Kiadó, Budapest, 1975.
[2] Breeembroek J. A., Koole B., Poppe K. J., Wossink G. A. A., Environmental Farm Accounting, The Case of the Dutch Nutrients Accounting System, Agricultural Systems, (1996) 51. 1. 29-40.
[3] Csaba L., Kiss O., Szinay M., Vermes L.,
5439 8477 15421
-20000 -10000 0 10000 20000 30000
2001 2002 2003
Ph
os
ph
or
us
k
g
Crop enterprise Fodder mixer enterprise Animal husbandry enterprise
Diagram 1 The results of the unit level internal phosphorus balances
Diagram 2. The results of nitrogen nutrient flows in the animal husbandry enterprise in 2001 (kg) Nitrogen inputs = Nitrogen outputs
49540
29351
30940 733
Fodder Hay Silage Milk
3286 16719
82303 8256
Meat Milk Theoritical manure Difference
Hígtrágya-hasznosítás, Mezőgazdasági Kiadó, 1978. [4] Csávás I., Fekete L., Kiss O., Vermes L., A hígtrágya kezelési módszereinek vizsgálata szakosított sertéstelepeken, Akadémiai Kiadó, Budapest, 1975.
[5] Füleky Gy. szerk., Tápanyag-gazdálkodás, Mezőgazda Kiadó, Budapest, 1999.
[6] Halberg N., Kristensen E. S., Kristensen I. S., Nitrogen turnover on organic and conventional mixed farms. Journal of Agriculture and Environmental Ethics, (1995) 8: 30-51.
[7] Horn P., A nagyüzemi állattartás környezetvédelmi kérdései, in: Környezetvédelmi oktatási irányelvek a MÉM felsőoktatási intézményei számára I.-II. 1974, pp. 265-271.
[9] Oenema O., Governmental policies and measures regulating nitrogen and phosphorus from animal manure in Europen agriculture, American Society of Animal Science (2004) 82: 196-206.
[10] Oenema, O., Nitrogen Cycling and Losses in Agricultural Systems; Identification of Sustainability Indicators, in: Nitrogen Cycle and Balance in Polish Agriculture, 1998, pp. 25-44.
[11] Oenema O., Velthof , G., L., Developing Nutrient Management Strategies at a National and Regional Levels in the Netherlands, Scientific Basis to Mitigate the Nutrient Dispersion into the Environment, (1999) 36-56.
[12] Ondersteijn C. J. M., Beldman A. C. G., Daatselaar C. H. G., Giesen G. W. J., Huirne R. B. M, The Dutch Mineral Accounting System and the European Nitrate Directive: Imlications for N and P management and farm performance, Agriculture, Ecosystems, and Environment (2002) 92 (2-3), 283-296.
[13] Sarkadi J., A műtrágyaigény becslésének módszerei, Mezőgazdasági Kiadó, Budapest. 1975.
[14] Kakuk T., Schmidt J., szerk., Takarmányozási táblázatok. Mezőgazdasági Kiadó, Budapest, 1998
[15] Spiess E., Nutrient Balances of Swiss Agriculture
between 1975 and 1995, in: Scientific Basis to Mitigate the Nutrient Dispersion into the Enviroment, 1999, pp. 25-36.
[16] Stefanovits P., Intenzív műtrágyázás hatása a környezetre, in: Környezetvédelmi oktatási irányelvek a MÉM felsőoktatási intézményei számára I.-II. 1974, pp. 72-83.
[17] Urfi P., Bacsi Zs., Sárdi K., Polgár J. P., Az üzemi tápanyagmérleg mint a környezeti menedzsment egyik lehetséges eszköze a mezőgazdaságban. „Ötven éves az Acta Agronomica Hungarica” Jubileumi Tudományos Ülés, Martonvásár. (2002) 335-341.
[18] Urfi P., Kántor B., Sárdi K., Polgár J. P., Bacsi Zs., Növénytermesztésre és baromfihízlalásra szakosodott vállalkozások üzemi tápanyagmérlegeinek sajátosságai. IX. Nemzetközi Agrárökonómiai Tudományos Napok, Gyöngyös, 2004. március 25-26. (CD, oldalszám nélkül. ISBN 963 214 313 2. 6 pp.)
[19] Vukina T., Wossink A. Environmental Policies and Land Values: Evidence from the Dutch Nutrient Quota System, Land Economics (2000) 76 (3): 413-429.