Vol-7, Special Issue3-April, 2016, pp162-171
http://www.bipublication.com
Short Communication
Effect of Carbohydrate Supplementation On
The Immune System of Futsal Players
Ghaleb Echreshzadeh
Department of Science,
Petroleum University of Technology, Abadan, Iran Email: [email protected]
ABSTRACT
One of the effective supplements in proper functioning of immune system is carbohydrate supplements which can have a positive effect on athletes. An athlete who continues his training in carbohydrate depletion, experience more increase in circulating stress hormones in the blood, and more disorders n various indicators of safety performance. The aim of the present study is to investigate the effect of 4 periodic 90-minute sessions during carbohydrate supplementation on the response of immune system cells among futsal players in Iran. For this purpose, 12 professional futsal players were selected, divided into three groups who (1) consuming carbohydrates, (2) consuming placebo as well as(3) control group. Collected data were analyzed using SPSS. The results of descriptive statistics showed that the indicators of immune systems among athletes consuming carbohydrate and placebo were increased remarkably at the end of second and fourth sessions (after supplementation) compared to the time before implementation, but on the other hand, immune systems indicators of control group at the end of second and fourth sessions had no significant changes compared to the time before implementation. Also there was not any significant difference in the number of white blood cells, neutrophil, and cortisol among the groups but a significant increase was observed in glucose in first group compared to the second group.
Keywords: Carbohydrate supplements, immune system, periodic physical activity, futsal players
1. INTRODUCTION
Sports nutrition is a sub-branch of the sports science, scientifically studies the athletes’ nutrition, and offers guidelines for nutrition before, during, and after physical activity. Such researches are along with new findings day by day, and will lead to the growing development of professional sport, and further success in sports competitions. According to the conducted researches on the professional athletes, who participated in heavy, breathtaking training programs and sports, it was concluded that they are exposed to dangerous, infectious diseases due to the temporary disruption of the immune
Considering the relationship between stress hormones and immune response to the long-term intense activities, consuming carbohydrates can maintain plasma glucose level, reduce the increase of stress hormones, and thus make change in the immune system. In addition, lack of carbohydrate oxidation during the exercise can create some problems for the athlete (Edward, 1992); Therefore, it seems that consuming carbohydrates during the exercise minimizes or decreases the regulating hormones disorder and indicators of immune such as the number of cells and the T-lymphocyte function (Katherine et al, 2003). The effect of one exercise session on the immune system was investigated in the previous researches but few researches have been carried out on immunological changes, which occur after a period of increasing the amount or intensity of the exercise (Malm et al, 2004). The results of researches, which were conducted on the effect of the reduced training intensity on the physiological changes, have shown that although the disorders induced by hard exercise and training are temporary;lack of returning of the immune system to its initial state can cause disease. Exposing to such conditions frequently and in a short-term period can lead to further occurrence of stress responses, and different qualitative, quantitative responses in comparison with further pressures (Ronsen et al, 2002). Many researchers have shown that carbohydrate consumption can lead to the drop in the immune system after many complex physical activities by reducing the release of cortisol. According to the results of these researches, the group which consumed carbohydrate experienced a decrease in cortisol response, and less disorder of immune cells in comparison with the group which consumed placebo (Gleeson et al, 1998). Vigorous physical activity triggers the activation of the hypothalamus, pituitary and adrenal, and finally leads to adrenal cortex hormone secretion. In other words, vigorous physical activity triggers adrenal cortex gland to produce and secrete
cortisol. For achieving this goal, lowering blood glucose is another stimulus. It is a way in which carbohydrate affects the immune function (Shi and Gisolfi, 1998). Therefore, with regard to the relationship between stress hormones and immune response to the long-term strenuous exercise, eating carbohydrates can maintain the plasma glucose levels, and reduce the increasing stress hormones and consequently the immune system changes as well(Pedersen et al, 1997). Based on what was said, it seems that no clear answer has been given to the effect of carbohydrate supplementation on the athletes’ immune system since now. Although, according tothe most of the researches, the influence of consuming carbohydrate on the immune system response is observed after doing long-term physical activity, this influence is also experienced by a large number of athletes after doing short-term physical due to the intensity of the activities. Given the above, in this paper we want to give a clear answer to the function of the immune system cells during a severe 90-minitue periodic protocol for athletes particularly futsal players.
2. MATERIALS AND METHODS 2.1. Literature Review
The hypothesis of the influence of carbohydrate supplementations on the immune system of body was first investigated by Nieman(1998) in relation to the immune response to 2.5 hours of run among a group of 30 marathon runners . Following this research, the effect of consuming carbohydrate on immune responses was examined among 10 triathletes by 2.5 hours running and cycling on treadmill or bicycle ergometer at 75% VO2max speed (Nieman et al,
concluded that a part of the mechanism of the responses and decrease in cortisol responses are due to maintain the level of plasma glucose concentration.
In 1999 Niemanet al examined the influence of the consuming carbohydrate and placebo beverages on the immune responses to normal rowing training sessions among 15 elite female rowers. Metabolic measures indicated that training was performed at moderate intensities, with some high intensity intervals interspersed throughout the sessions. It was concluded that glucose and insulin were significantly lower after two hours of rowing with drinking placebo beverage comparing with carbohydrate beverage. The patterns of change in cortisol, growth hormone, epinephrine, and nor epinephrine as well as the patterns of changes in blood lymphocyte and lymphocyte subset counts, and lymphocyte proliferative responses, except for a slight difference in NK cell counts and activity did not differ between placebo and carbohydrate groups. In the same year, Bishop et al (1999) investigated the effect of carbohydrates versus placebo beverage consumption on the immune response to a soccer-specific exercise protocol.The players received carbohydrates or placebo beverage before, during, and after two 90-min soccer-specific exercise bouts(3 days apart). After 90 minutes of exercise, plasma glucose concentration was lower among a group of players, who received placebo beverages than the other group of players, who received the carbohydrate beverages but the pattern of change in cortisol and circulating lymphocyte count did not significantly differ between the carbohydrate and placebo trials (Bishop et al, 1999).These findings seems logical, because the cells of the immune system greatly require blood glucose as an energy substrate, and carbohydrate consumption can prevent from decreasing in the efficiency of the immune system after the physical activity by reducing cortisol release.
Van Hall et al (1998) examined the influence of carbohydrate supplementation on plasma glutamine during prolonged exercise and recovery. Muscle glycogen and glucose have been suggested to be carbon-chain precursors for glutamine synthesis in skeletal muscle. Therefore, the aim of the present study is to investigate whether carbohydrate supplementation affects plasma glutamine and other amino acids during exercise and 7 h of recovery. Eight well-trained subjects cycled at an alternating workload of 50 and 80% Wmax until
prolonged exercise with or without carbohydrate (CHO) supplementation. Eight subjects cycled at approximately 70% of maximal oxygen uptake to fatigue [134 +/- 19 (SE) min] on the first occasion (control, CON) and at the same work load and duration on the second occasion but with CHO ingestion during exercise. Blood reduced glutathione (GSH) concentration increased from 0.55 +/- 0.05 mM at rest to 0.77 +/- 0.09 mM after 120 min of exercise during CON (P < 0.01) but remained constant during CHO exercise. Blood glutathione disulfide (GSSG) levels were unchanged during CON and CHO exercise. Blood GSH + GSSG content and GSH/GSSG ratio were also significantly (P < 0.05) elevated during CON but not during CHO exercise. The increases in GSH and GSH + GSSG in CON were associated with decreases in plasma glucose and insulin levels. Activities of blood GSH peroxidase, GSSG reductase, and glucose-6-phosphate dehydrogenase were significantly increased during the CHO exercise, whereas only GSSG reductase activity was elevated during the CON ride.
It is concluded that blood GSH increases during prolonged exercise and that CHO supplementation may prevent blood GSH increase possibly because of its inhibitory effects on hepatic hormonal releases, which stimulate GSH output. Haff et al (1999) conducted a research on the effects of carbohydrate (CHO) supplementation on multiple sets of resistance training exercise during the second training session on a given training day. The subjects participated in a randomized, counter balanced, double-blind protocol with testing days separated by at least 1 week. A CHO supplement consisting of 0.3 g/kg bodymass-1 or placebo (P) was ingested during the morning training session, 4 hours of recovery, and the sets of squats performed to exhaustion (STE).STE consisted of sets of10 repetitions of squats performed at 55% of 1 repetition maximum, with a 3-minute rest between sets, performed to muscular failure.
Performance measured in number of sets was statistically different between the CHO and P trials.
The results suggest that CHO supplementation enhances the performance of multiple STEs during the second workout on a given day.
2.2. Research methodology
In this study, statistical population was consisted of professional futsal players in Iran. Among this, 12 futsal players were selected as the study sample by random sampling technique. Data collection tool was a researcher-made questionnaire. First, the questionnaires were distributed among them, and after collecting, data were analyzed using SPSS.
3. RESULTS AND DISCUSSION 3.1. Descriptive statistics
In this section, descriptive statistics related to participants and study variables are presented in tables 1-4.
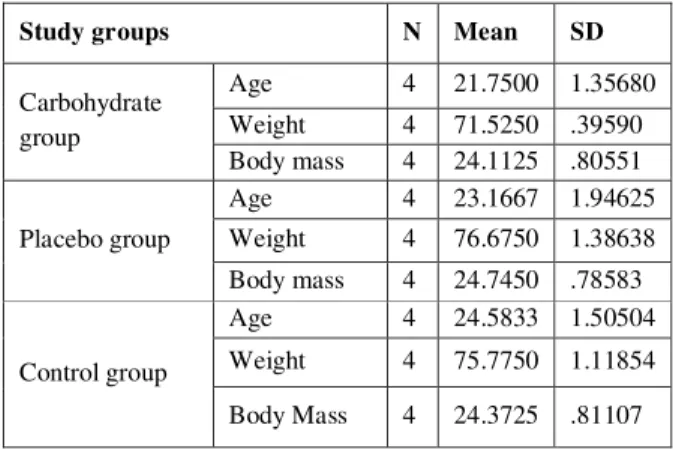
Table 1. Meanand standard deviation related to participants in terms of age, weight, and body masses in three groups
Study groups N Mean SD
Carbohydrate group
Age 4 21.7500 1.35680
Weight 4 71.5250 .39590
Body mass 4 24.1125 .80551
Placebo group
Age 4 23.1667 1.94625
Weight 4 76.6750 1.38638
Body mass 4 24.7450 .78583
Control group
Age 4 24.5833 1.50504
Weight 4 75.7750 1.11854
Body Mass 4 24.3725 .81107
mean values of placebo group athletes’ age, weight, and mass body are respectively equal to 23.161.94, 76.671.38, and 24.740.785. in control group,the average of athletes’ ages,
weights, and body massesare 24.581.50, 75.771.11, and 24.370.811 respectively.
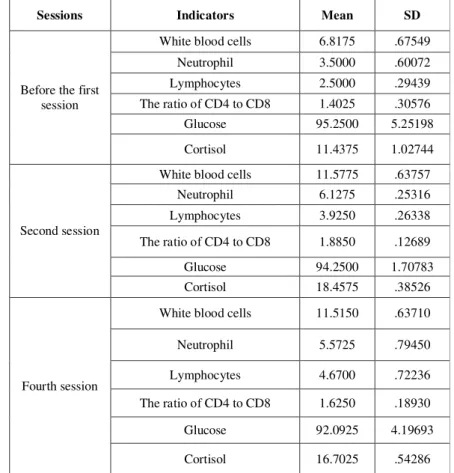
Table 2. Mean and standard deviation of immune system indicators in carbohydrate group in three periods
Sessions Indicators Mean SD
Before the first session
White blood cells 6.8175 .67549
Neutrophil 3.5000 .60072
Lymphocytes 2.5000 .29439
The ratio of CD4 to CD8 1.4025 .30576
Glucose 95.2500 5.25198
Cortisol 11.4375 1.02744
Second session
White blood cells 11.5775 .63757
Neutrophil 6.1275 .25316
Lymphocytes 3.9250 .26338
The ratio of CD4 to CD8 1.8850 .12689
Glucose 94.2500 1.70783
Cortisol 18.4575 .38526
Fourth session
White blood cells 11.5150 .63710
Neutrophil 5.5725 .79450
Lymphocytes 4.6700 .72236
The ratio of CD4 to CD8 1.6250 .18930
Glucose 92.0925 4.19693
Cortisol 16.7025 .54286
Based on table 2, mean and standard deviation values of indicators of immune system among the carbohydrate group athletes are calculated in three periods of time. As it can be seen, their indicators of immune system have been increased considerably at the end of second and fourth sessions in comparison with the time before the first session.
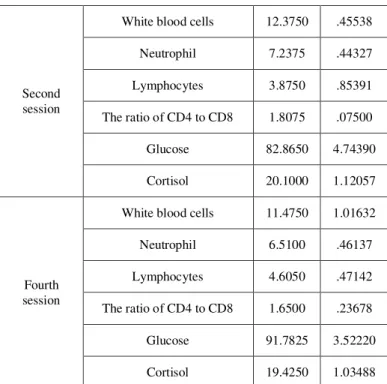
Table 3.Mean and standard deviation of immune system indicators inplacebo group in three periods
Sessions Indicators Mean SD
Before the first session
White blood cells 7.6625 .68908
Neutrophil 4.3075 .79584
Lymphocytes 2.6000 .24495
The ratio of CD4 to CD8 1.3450 .18646
Glucose 91.7500 3.68556
Second session
White blood cells 12.3750 .45538
Neutrophil 7.2375 .44327
Lymphocytes 3.8750 .85391
The ratio of CD4 to CD8 1.8075 .07500
Glucose 82.8650 4.74390
Cortisol 20.1000 1.12057
Fourth session
White blood cells 11.4750 1.01632
Neutrophil 6.5100 .46137
Lymphocytes 4.6050 .47142
The ratio of CD4 to CD8 1.6500 .23678
Glucose 91.7825 3.52220
Cortisol 19.4250 1.03488
As it is presented in table 3, mean and standard deviation values of indicators of immune system among athletes in placebo group have been calculated in three periods of time. Based on table 3, the indicators of immune system among athletes in placebo group have been significantly increased at the end of second and fourth sessions comparing before the first session.
Table 4.Mean and standard deviation of immune system indicators in control group in three periods
Sessions Indicators Mean SD
Before the first session
White blood cells 7.3525 .59818
Neutrophil 3.6675 .53119
Lymphocytes 2.6850 .33441
The ratio of CD4 to CD8 1.1925 .16460
Glucose 87.2500 3.30404
Cortisol 12.4675 .52627
Second session
White blood cells 6.4075 .34635
Neutrophil 3.8150 .25053
Lymphocytes 2.5350 .27683
The ratio of CD4 to CD8 1.5200 .20720
Glucose 95.3975 3.38963
Cortisol 14.8825 1.16743
Fourth session
White blood cells 6.5800 .60997
Neutrophil 3.2850 .39946
Lymphocytes 2.3625 .22750
The ratio of CD4 to CD8 1.3625 .18733
Glucose 91.0525 4.32894
As it is presented in table4, mean and standard deviation values of control group athletes’ indicators of immune system have been estimated in three periods of time. Based on table 4, control group athletes’ indicators of immune system have not been changed considerably at the end of second and fourth sessions compared to before the first session.
3.2. Inferential statistics
Now we compare three groups with each other at the time before the first session, second session, and fourth sessions. Results are shown in tables 5-7.
Table 5.Comparison of three study groups before the first session
Indicators Study groups Mean difference p-value
White blood cells
Carbohydrate group Placebo group -.84500 .102
Control group -.53500 .278
Placebo group Control group .31000 .520
Neutrophil Carbohydrate group Placebo group -.80750 .114
Control group -.16750 .725
Placebo group Control group .64000 .199
Lymphocytes Carbohydrate group Placebo group -.10000 .641
Control group -.18500 .396
Placebo group Control group -.08500 .692
The ratio of
CD4 to CD8 Carbohydrate group
Placebo group .05750 .729
Control group .21000 .224
Placebo group Control group .15250 .368
Glucose Carbohydrate group Placebo group 3.50000 .265
Control group 4.00000 .164
Placebo group Control group 4.50000 .161
Cortisol Carbohydrate group
Placebo group -.07750 .891
Control group -1.03000 .093
Placebo group Control group -.95250 .116
Table 5 shows that there is not any significant difference among carbohydrate, placebo, and control groups before the first session.
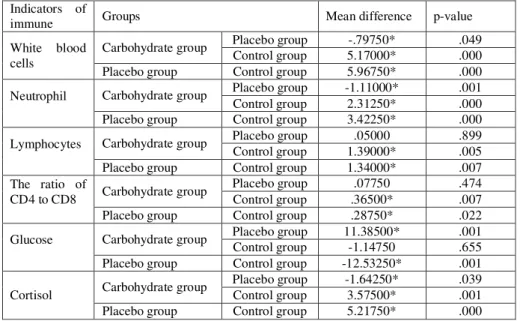
Table 6.Comparison of three study groups after second session
Indicators of
immune Groups Mean difference p-value
White blood cells
Carbohydrate group Placebo group -.79750* .049
Control group 5.17000* .000
Placebo group Control group 5.96750* .000
Neutrophil Carbohydrate group Placebo group -1.11000* .001
Control group 2.31250* .000
Placebo group Control group 3.42250* .000
Lymphocytes Carbohydrate group Placebo group .05000 .899
Control group 1.39000* .005
Placebo group Control group 1.34000* .007
The ratio of
CD4 to CD8 Carbohydrate group
Placebo group .07750 .474
Control group .36500* .007
Placebo group Control group .28750* .022
Glucose Carbohydrate group Placebo group 11.38500* .001
Control group -1.14750 .655
Placebo group Control group -12.53250* .001
Cortisol Carbohydrate group
Placebo group -1.64250* .039
Control group 3.57500* .001
Placebo group Control group 5.21750* .000
in comparison with placebo group. Also in terms of neutrophil indicator, there is difference among three groups. Neutrophil has been increased significantly in carbohydrate group in comparison with control group, and decreased significantly compared to the placebo group. Also, in terms of lymphocytes and the ratio of CD4 to CD8, there is a significant difference between carbohydrate and placebo groups as well as between carbohydrate and control groups, and no significance difference has been observed between placebo and carbohydrate groups. In terms of the indicator of glucose, carbohydrate group experienced a significant increase in comparison with placebo group, and a significant reduction in comparison with control group. Also, there is a significant reduction in glucose in placebo group comparing with control group. A significant difference in cortisol is observed among each of three groups. Cortisol in control group has been increased significantly compared to the control group, and decreased significantly comparing with placebo group.
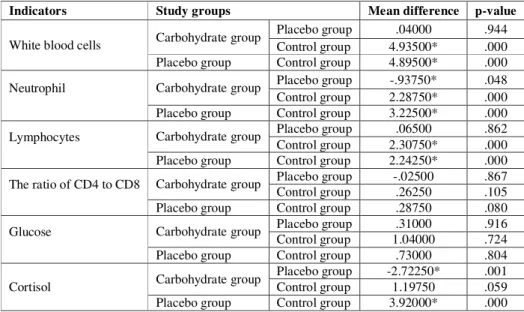
Table 7.Comparison of three study groups after fourth session
Indicators Study groups Mean difference p-value
White blood cells Carbohydrate group
Placebo group .04000 .944
Control group 4.93500* .000
Placebo group Control group 4.89500* .000
Neutrophil Carbohydrate group Placebo group -.93750* .048
Control group 2.28750* .000
Placebo group Control group 3.22500* .000
Lymphocytes Carbohydrate group Placebo group .06500 .862
Control group 2.30750* .000
Placebo group Control group 2.24250* .000
The ratio of CD4 to CD8 Carbohydrate group Placebo group -.02500 .867
Control group .26250 .105
Placebo group Control group .28750 .080
Glucose Carbohydrate group Placebo group .31000 .916
Control group 1.04000 .724
Placebo group Control group .73000 .804
Cortisol Carbohydrate group
Placebo group -2.72250* .001
Control group 1.19750 .059
Placebo group Control group 3.92000* .000
Table 7 shows that there is significant difference in the indicator of white blood cells between carbohydrate and placebo groups, and control group, and in indicator of neutrophil among all the three groups. It should be mentioned that neutrophil has been significantly increased in carbohydrate group comparing with control group, and decreased in comparison with placebo group. There is a significant difference inlymphocytes between carbohydrate and placebo groups, and control group, and there is not any significant difference between placebo and carbohydrate groups in this regard. None of the groups significantly differ from each other in the ratio of CD4 to CD8 and glucose. The indictor of cortisol decreased significantly in carbohydrate group comparing the placebo
group, but no significant difference was observed in the indicator of cortisol in carbohydrate group comparing with control group. Cortisol significantly increased in placebo group in comparison with control group.
4. CONCLUSION
and fourth sessions (after supplementation) rather than before the first session, but minor changes were made in the indicators of immune system among control group athletes at the end of second and fourth session comparing before the first session. The results showed that there was not any significant difference between carbohydrate and placebo groups, and control group before the first session. A significant difference was observed in the indicator of the white blood cells. The white blood cells were significantly increased among carbohydrate group comparing the control group, and decreased in comparison with placebo group. Also, there was a significant difference among all of the three groups over the indicator of Neutrophil, and carbohydrate group experienced a significant increase in Neutrophil comparing the control group, and a significant decrease in comparison with placebo group. There was also a significant difference in the indicators of lymphocyte and the ration of CD4 to CD8 between carbohydrate group and placebo groups as well as carbohydrate and control groups. In terms of the indicator of glucose, a significant increase was only occurred among the carbohydrate group comparing to the placebo group.
REFERENCES
1. Mackinnon, L.T., Ginn, E., and Seymour,G.J. (1993) Temporal relationship Between Exercise- Induced Decrease in Salivary IgA and Subsequent Appearance of Upper Respiratory Tract Infection in Elite Athletes. Journal of Medicine Sports, 25: 49-99.
2. Haffman , J. (2002). Physiological Aspects of Sport Training and Performance. Human Kinetics Publisher, Inc; P: 67-68.
3. Aoi , w. (2009). Exercise and food factors, Forum Nutr ,Basel ,Karger, 61:147-55. 4. Edward , F.C. (1992). Carbohydrate
supplementation during Exercise, Journal of Nutrition, Coyle 122 (3): 788.
5. Katherine ,J.G. Susan, J.C. and David, G.R. (2003). Carbohydrate supplementation and exercise-induced changes in T-lymphocyte Function, Journal of Applied physiology, 95:1216-1223.
6. Malm , C., Ekblim ,O., and Ekbolm , B.(2004). Immune System Altration in Response to Increased Physical Training during Five Day Soccer Training. Camp. Int. J Sports Med. 25:477-476
7. Ronsen , O., Kjeldsen-Kragh, J., Haug, E., Bahr, R., and Pedersen B.K. (2002). Recovery Time Affects Immunoendocrine responses to a Second Bout of Endurance Exercise. The American Journal of Physiology - Cell Physiology, 283(6): c1612-c1620.
8. Shi , X., and Gisolfi, C.V.(1998) Fluid and Carbohydrate Replacement during intermittent Exercise, Journal of Sports Medicine , 25: 157-172.
9. Pedersen ,B.k., Bruunsgaard, H., and Klokker, M. et al (1997). Exercise induced immunomodulation –Possible roles or neuroendocrine and metabolic factor. Int Sport Med., 18, Suppl 1:s2-7.
10.Nieman , D.C. (1998). Influence of Carbohydrates on the Immune Response to Intensive, prolonged exercise.Journal of Exercise Immunology Review,4:64-76
11.Nieman, D. C., and Nehlsen-Cannarella, S. L., Fagoga, O. R, (1998) Influence of Mode and Carbohydrate on the Granulocyte Response to Intensive, Prolonged Exercise, J Appl Physiol. 84: 1252-9.
12.Bishop , N.C., Blatmin, A. K., Robsen, P. J., Walsh and Gleenson , M.(1999). The effects of carbohydrate supplementation on immune responses to a soccer-specific exercise protocol. Journal of Sport Science. 17: 787-796.
14.Gleeson , M., Blannin,A.K., and Walsh, N.P.(1998). Effect of low and high carbohydrate diets on the plasma glutamine and circulation leukocyte responses to exercise. International Journal of Sports Nutrition. 8(1): 49-59.
15.Van Hall G, Saris WH, Wagenmakers A.J.(1998). Effect of carbohydrate supplementation on plasma glutamine during prolonged exercise and recovery. International Journal of Sports Medicine . 19(2):82-86. 16.Ji, L.L., Katz, A., Fu, R., Griffiths, M.,
Spencer, M.(1993). Blood glutathione status during exercise: effect of carbohydrate supplementation. Journal of Applied Physiology Published. 74(2): 788-792