www.epjournal.net – 2009. 8(2): 173-188
¯ ¯ ¯ ¯ ¯ ¯ ¯ ¯ ¯ ¯ ¯ ¯ ¯ ¯ ¯ ¯ ¯ ¯ ¯ ¯ ¯ ¯ ¯ ¯ ¯ ¯ ¯ ¯
Original Article
Testosterone Fluctuations in Young Men: The Difference Between Interacting
With Like and Not-Like Others
M. Catherine DeSoto, Department of Psychology, University of Northern Iowa, Cedar Falls, Iowa, USA. Email: [email protected] (Corresponding author).
Robert T. Hitlan, Department of Psychology, University of Northern Iowa, Cedar Falls, Iowa, USA. Rory-Sean S. Deol, Department of Psychology, University of Northern Iowa, Cedar Falls, Iowa, USA. Derrick McAdams, Department of Psychology, University of Northern Iowa, Cedar Falls, Iowa, USA.
Abstract: The current study investigated young men’s testosterone level changes as a result of interacting with other men. Male participants (n = 84) were led to believe that a
group they would be interacting with was either similar to them or not similar. The interaction was then one of two types: the other group members were inclusive, or the others excluded the participant during the group interaction. Participants provided saliva samples before and after the interaction. Results suggest that interacting with highly similar men increases circulating testosterone whereas interacting with highly dissimilar men actually lowers testosterone. The nature of the interaction was less important than similarity. Considering that testosterone surges may relate to attempts to gain status within one’s group, the results are interpreted as consistent with viewing hormonal changes as a mechanism to alter current behavioral propensities in ways that are likely to be most adaptive. Exploratory analyses suggest a methodologically interesting suppressor effect of the self-report items in predicting testosterone changes.
Keywords: testosterone, in-groups, hormones, male behavior, challenge hypothesis ¯ ¯ ¯ ¯ ¯ ¯ ¯ ¯ ¯ ¯ ¯ ¯ ¯ ¯ ¯ ¯ ¯ ¯ ¯ ¯ ¯ ¯ ¯ ¯ ¯ ¯ ¯ ¯ ¯ ¯ ¯ ¯ ¯ ¯ ¯ ¯ ¯ ¯ ¯ ¯ ¯ ¯ ¯ ¯ ¯ ¯ ¯ ¯ ¯ ¯ ¯ ¯ ¯ ¯ ¯ ¯ ¯ ¯ ¯ ¯ ¯ ¯ ¯ ¯ ¯ ¯ ¯ ¯ ¯ ¯ ¯ ¯ ¯ ¯ ¯ ¯ ¯ ¯ ¯ ¯ ¯ ¯ ¯ ¯ ¯ ¯ ¯ ¯ Introduction
desire for social dominance (see Archer, 2006; or Mazur and Booth, 1998 for reviews); individual testosterone levels have been found to be linked with others’ perceptions of that individual being less friendly (Dabbs, 1997), and studies incorporating exogenous administration have demonstrated that testosterone causes shifts in attentional biases, such as a reduced noting of anger in faces (van Honk et al., 2005). It seems that interacting with women generally results in an increase in circulating testosterone (Roney, Mahler, and Maestripieri, 2003), and some research suggests that successful competition increases testosterone (Archer, 2006; Gladue, Boechler, and McCaul, 1989). Overall, most of the effects and cues seem to be related to status, competition, and issues of control (Mazer and Booth, 1998), and testosterone surges may make it more likely that a man will engage in male–male competition (Mehta and Josephs, 2006). The current study was designed to investigate how characteristics of the group that a man interacts with might affect his testosterone levels.
High status within a group that one interacts with clearly has many benefits (mate access, control of resources, etc.). As such, any mechanism that can foster effective dominance seeking within one’s group could be viewed as highly adaptive. On the other hand, high status among a distant group that one has little contact with would presumably have less benefit, at least by comparison. One way to view testosterone is as a hormone that, among other things, guides attempts to effectively move up in a social hierarchy. In general, hormones appear to be able to function as a component in a complex feedback system that serves to help fine-tune motivations and behavior to a situation, and, ultimately bring about situations that are favorable to the individual. Viewed in this light, one function of testosterone changes could be conceptualized as a vehicle that allows external circumstances to guide short-term behavioral tendencies regarding when to be competitive and perhaps aggressive, and when not to act competitively. This view is not unlike the challenge hypothesis which originally sought to explain aggression in bird species and then primate behavior, and has of course been related to human behavior as well (Archer, 2006). Generally, it is thought that testosterone will be increased by male–male competition or the presence of women, and that the temporary surge in testosterone would be adaptive by increasing aggressiveness at those times when aggressively seeking status is most likely to benefit the individual. We agree, and consistent with the views of Mehta and Josephs (2006) and Carre and McCormick (2008) also suspect that testosterone may have been shaped to broadly guide behavior by actively tuning down competitive instincts when necessary.
they are competing, and are associated with increased success in competitions.
In-group and Out-group Interactions
When one meets individuals that are seen as potentially part of one’s in-group, it is likely a phenomenologically different experience than when one interacts with a group of dissimilar others. The recognition and bias for in-group members (even novel ones) appears to be neurally based. Van Baval, Packer, and Cunningham (2008) have found that the specific neural activations that occur when one encounters new in-group member may be automatic and pervasive. Activity in certain areas of the brain (prefrontal cortex) occurred when participants reported liking the novel in-group faces, but this effect did not depend on the participant consciously attending to in-group status. The authors interpreted the overall findings as suggesting an automatic, neurally based in-group bias, perhaps guiding conscious liking. Generally speaking, different behavioral responses would be called for when one encounters individuals thought to be similar to self as opposed to dissimilar others. As such, we might expect identical behavior performed by self-similar in-group members and dissimilar out-group members might rightly elicit different reactions from an evolutionary standpoint. For example, being excluded by members of one’s racial in-group appears more salient than being excluded by members of an out-group. Krill and Platek (2009) demonstrated that participants show a greater neural response and expressed greater distress when persons who look more similar to them exclude them than when others (whom appear more dissimilar) do so. Moreover, a large body of literature on intergroup relations suggests that participants respond differently to in-group and out-group encounters (Brown and Zagefka, 2005; Fiske, 2005; Gaertner and Dovidio, 2005; Sherif, 1966; Tajfel and Turner, 1986). Of particular import, the same types of behaviors (e.g., exclusion) elicit different neural responses as a function of group membership (Krill and Platek, 2009). We reasoned that the most adaptive response in terms of dominance seeking behaviors would vary based on characteristics of the group (even when the behavior of the group is the same). Consistent with this reasoning, we hypothesized that interacting with highly similar individuals would result in a different hormonal response than when interacting with highly dissimilar individuals.
To reiterate basic evolutionary theory, men have much to gain by passing on their genes to the next generation. By achieving a high status and access to many mates, male-male competition (for power and status) is more common than female-male-female-male competition. If dominance seeking behaviors have a differential payoff to men, then a fluctuating hormone that exists in higher quantities in men would be a plausible mechanism to guide such status seeking behavior. Sometimes it is not wise to challenge other men if the overall goal is survival. In terms of cost/benefit to dominance seeking behaviors: even if one gained dominance among dissimilar others, it may provide little, if any, future payoff with one’s own comrades; and, a lone man challenging the dominance hierarchy within a dissimilar and unfamiliar group could result in injury or even death. Thus, we hypothesize that a lone man interacting with others viewed as a highly dissimilar out-group would call for avoidance of high risk, low pay off confrontations and result in decreasing testosterone levels.
Baseline and Change Are Not the Same
(baseline individual levels) and which can effect behavior, but also a hormone whose levels are affected by the environment (the reciprocal hypothesis, Mazur and Booth, 1998), teasing apart which behavioral responses are caused by hormonal levels and which behaviors and situations cause hormonal changes is not possible with a single measure of circulating testosterone. Controlling for baseline individual differences requires either administering the hormone directly or measuring hormone levels both before and after an event of interest. We have measured testosterone before and after the event.
Recent studies have supported the importance of changes from baseline. Specifically, changes in testosterone level have been shown to have a stronger effect on guiding future behavior than preexisting baseline level (Carre’ and McCormick, 2008). This is not surprising if hormonal systems are conceptualized as a means for nature to alter behavior to most effectively match a set of environmental cues. Some research suggests the relationship between testosterone changes and competition effort has multiple mediators (Suay et al., 1999) and may not be a straightforward relationship. We sought to better understand what sorts of environmental cues might alter testosterone changes when men interact. Many findings related to intergroup relationships suggest that when men interact with dissimilar out-groups, there should be more conflict than with interactions among similar persons (see Yamagishi and Mifune, 2009 for a recent example) and, thus, might lead to the prediction that there will be more attempts to gain status when interacting with dissimilar others, and perhaps concomitant increases in testosterone. However, this was not our prediction.
First, much of the research about out-group and in-group interactions (i.e., Yamagishi and Mifune, 2009) refers to cases whereby groups of similar men are interacting
with groups of other men. However, the current study is an investigation of a lone
individual either interacting with a similar or dissimilar group of others. Second, our design
separates the perception of similarity from how one is being treated by the group. That is, actual conflict (in this case exclusionary treatment or cooperation) is held constant while manipulating the belief that others are similar or not. Finally, we think it should be considered that dominance seeking among comrades may be a form of competition, but is not always the same as exploitive conflict. In fact, some aspects of competitiveness appear to be associated with a greater sense of companionship, at least among men (Schneider, Woodburn, del Toro, and Udvari, 2005). Perhaps like rough and tumble play among boys, vying for status does not necessarily include a desire to harm others. In sum, we wish to disentangle competition from conflict. They may often be related, but they are not necessarily identical. If testosterone is more linked with gaining status within a group rather than aggression and conflict per se, then an individual might be more likely to have testosterone surges when interacting with similar men rather than unknown, novel, out-group men.
something that could risky for an individual among a novel out-group. For example, a failure to notice a threat display by others may be a disadvantage. Increases in testosterone have been shown to reduce noticing anger in faces (van Honk et al., 2005), something that an individual ought to be particularly wary of when among strangers. We hypothesized that a laboratory situation engineered to mimic an individual encountering a group of dissimilar other men should not increase testosterone, regardless of the behavior of the group. Specifically, it was hypothesized that interacting with similar conspecifics would increase testosterone, and interacting with newly encountered men that one has little in common with would not.
Materials and Methods
Participants included 84 young men who were students at a Midwestern university who participated in the study during autumn (from mid-October to early December) of the same year. Participant ages ranged from 18-33. The mean age for participants was 19.49 years (SD = 2.17, Mdn = 19). The majority of participants indicated being Caucasian
(non-Hispanic, 84.5%), followed by Hispanic (3.6%), Asian or Pacific Islander (3.6%), and African-American (1.2%).
Procedure
Recruiting information described the study as investigating how different modes of communication affect group-based interactions in a task-oriented work group. Participants were instructed that they would be interacting with three other individuals and would be providing saliva samples at different points during the course of the research. Participants were instructed to refrain from eating or drinking for one hour prior to participating. All participants were tested between 2:00 p.m. and 6:00 p.m. in the evening to control for variations of testosterone as a function of time of day.
Upon arrival participants were greeted by a male experimenter and asked to read and sign an informed consent document if they wished to participate. All protocol and measures were approved by the University IRB. Saliva samples were collected at the beginning and at the conclusion of the experiment, just under one hour apart. The first saliva sample was provided immediately after participants completed the informed consent sheet. Prior to providing their first sample, participants rinsed their mouth with water and were instructed on how to provide a saliva sample. Collection of all saliva samples followed the protocol developed by Salimetrics, Inc. for collecting unstimulated whole saliva samples by passive drool. After providing an initial saliva sample, participants completed a computer-based demographics questionnaire which took approximately 15 minutes to complete. In addition to age, race, gender, and other demographic information, the survey queried about political views, interests and various personality traits.
culture. The results of the “comparative analysis” (actually bogus similarity feedback based on random assignment) were then presented to participants via the group chat-room. Participants received one of two types of feedback as the result of the comparative analysis: that they were highly similar to the other members of their discussion group or that they were very dissimilar to the other members of their discussion group. Specifically, in the highly similar condition participants were provided the following information:
Based on the analyses performed on the information each of you provided in your demographic profile, it appears that all four participants in this group are highly similar to each other based on their demographic characteristics and attitudinal measures. We generally see an average similarity index of approximately 58% across all group members indicating some similarity. However, in the case of your group, the average similarity rating was 85%. The similarity indices indicated that Participants 1, 2, 3, and 4 were highly similar (similarity indices ranging from 80% to 93% between participants). It is rare to see similarity indices this high among group members. We usually only find such high similarity ratings when examining close siblings.
In contrast, participants in the highly dissimilar condition were provided the following information:
Based on the analyses performed on the information each of you provided in your demographic profile, it appears that Participant 1 is very different from the other three participants on their demographic characteristics and attitudinal measures. However, the similarity index among the other three group members indicates a very high degree of overlap. We generally see an average similarity index of approximately 58% across all group members indicating some similarity. However, in the case of your group, the average similarity rating was 21%. This low rating was found to be due to responses from Participant 1. Participant 1 seems to be the outlier such that Participants 2, 3, and 4 were highly similar (similarity indices ranging from 80% to 93% between participants). In contrast, the similarity index computed between Participant 1 and each of the other group members ranged from 12% to 27% across group members. This indicates that Participant 1 is substantially different from the remaining group members. It is rare to see similarity indices this low, and usually only occurs when studying individuals from quite different cultures.
Participants were then given a few minutes to review the comparison analysis prior to interacting with the other group members.
several items they happened to find in their vehicle or in their pockets. The group’s task was to select the top six items (out of 9 items) that would best ensure survival until help arrived. Groups were further informed that their group performance would be compared to other groups participating in this research project.
After participants were provided with the instructions for the task-oriented discussion, the second experimental manipulation was employed. During the discussion half of the participants were randomly assigned to be actively included by the other group members throughout the entire discussion period. In contrast, the other half of participants were assigned to be excluded by their group members after an initial introductory period of three minutes. Any attempts by participants in the exclusion condition to be included (making suggestions on which items to retain, responding to other group members suggestions) were ignored or rejected by the other group members who proceeded to direct the remainder of the discussion to one another. The chat room interaction took approximately 20 minutes to complete.
Upon completing the chat-room interaction participants completed a final questionnaire designed to assess their perceptions of and experiences with the other group members. This post-interaction questionnaire took approximately 20 minutes to complete. Part of the actual purpose of the latter survey was to allow time to pass between the exclusion experience and the final salivary collection. While research on testosterone reactivity is limited, research suggests that changes have been observed around 20 minutes after completing a competitive event (such as the group based task used in the current research; Kivlighan, Granger, and Booth, 2005).
The final survey also included information on the effectiveness of the experimental manipulations and other attitudinal variables. After completing the final questionnaire, participants provided an additional saliva sample. Finally, participants were orally debriefed about the true nature of the research and dismissed.
Measures
Similarity. Participants level of perceived similarity to their group members was
assessed by two items (i.e., How similar do you feel toward the other members of your group? I share the same beliefs as the other members of my group). Responses were
obtained on a 5-point scale with appropriately labeled endpoints. Higher numbers indicate greater perceived similarity to the other discussion group members. The reliability coefficient (alpha) for this scale was .84.
Exclusion. The extent to which participants felt excluded from the group discussion
was assessed via two questions (i.e., How much do you feel you were ignored by the other members of your discussion group? How much do you feel like you were excluded by the other members of your group?). All responses were obtained on 5-point scales with
endpoints of 1 (Not at all) to 5 (Extremely). High scores indicate greater levels of perceived
exclusion. The reliability coefficient (alpha) for this scale was .96.
Control. The extent to which participants felt a threat to their sense of control was
assessed using five items (e.g., I felt I was unable to influence the action of others, I felt the other players decided everything.). These items were designed based on other questions
and less ability to control. The reliability coefficient for this scale was .91.
Anger. State anger wasassessed using 15 items from the State Anger and Anxiety
Scale (Spielberger, Jacobs, Russell, and Crane, 1983; e.g., I feel irritated, I am burned up).
All responses were obtained on 5-point scales with endpoints of 1 (Not at all) to 5 (Very Much). High scores indicate greater levels of state anger. The reliability coefficient (alpha) for this scale was .95.
Immigrant Attitudes. Attitudes towards immigrants were assessed using revised
items from the Modern Sexism Scale (Swim, Aiken, Hall, and Hunter, 1995). Old Fashioned Prejudice was assessed using five items (e.g., Immigrants are generally not as smart as U.S. citizens.). Each item was assessed on 7-point response scales from 1
(Strongly Disagree) to 7 (Strongly Agree). The reliability coefficient (alpha) for the scale
was .63.
Salivary Assays. Salivary testosterone levels in men are correlated with serum levels
(Shirtcliff and Granger, 2002) and salivary assay represents a non-invasive way to measure circulating testosterone levels in men. Participants were instructed to salivate by passive drool into a polypropylene funnel connected to a 2 ml cryovial. The sample was unstimulated and the participants allowed all saliva to be collected without interruption until a sufficient sample was collected. During the saliva collection, and in order to facilitate salivation, participants were invited to imagine the smell of something good to eat or to simulate chewing something good to eat. Samples were frozen within the hour at –40 degrees Fahrenheit, and later packed in dry ice and sent via overnight mail to an independent laboratory to be assessed for testosterone (Salimetrics, State College, PA); the procedure was a double antibody radioimmunoassay which has been detailed elsewhere (see Granger, Schwartz, Booth and Arenz, 1999). The method employed uses 25 µl of saliva per determination, has a lower limit of sensitivity of 1.0 pg/mL, standard curve range from 6.1 pg/mL to 600 pg/mL, an average intra-assay coefficient of variation of 4.6% and an average inter-assay coefficient of variation of 8.25% (Salimetrics, State College, PA). The assays were tested in singlet.
Results
Manipulation Checks
Based on an oral debriefing which probed participants thoughts about the nature of the study, two participants expressed a strong suspicion as to the true nature of the chat room interaction and, as a result, were not included in subsequent analyses. Results indicated that participants in the high similarity condition viewed themselves as more similar to their group members (M = 3.40, SD = .97) than those in the low similarity
condition (M = 2.80, SD = 1.18), t(80)= -2.51, p = .014. Results also indicated that
excluded participants perceived of themselves as significantly more excluded during the group interaction (M = 4.16, SD = 1.37) than included participants (M = 1.43, SD = 1.03), t(80) = -10.19, p < .001. Furthermore, informal qualitative analysis of the chat room
Testosterone
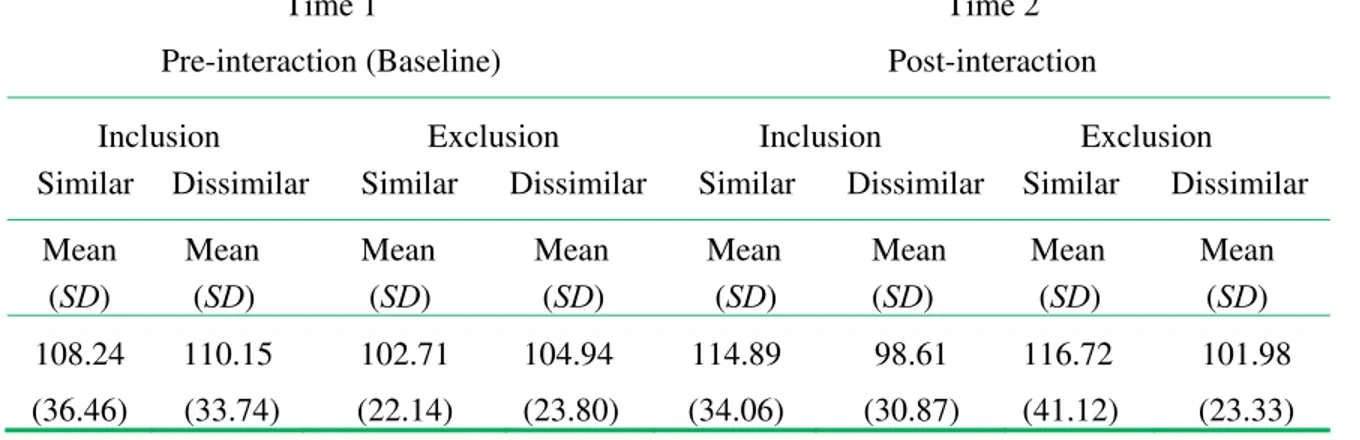
The initial, pre-event baseline testosterone level (Time 1) ranged from 28.61 pg/mL to 374.38 pg/mL with a mean of 110.55 pg/mL (SD = 46.59; all testosterone levels are
reported at picograms per milliliter and hereafter the pg/mL will be omitted). The post-event testosterone measure had a mean of 108.74 (SD = 35.57; range = 49.20-239.98).
Means, standard deviations for pre- and post- T levels by similarity and exclusion condition
are noted in Table 1.
Table 1. Testosterone levels across time as a function of inclusion/exclusion and similarity/dissimilarity manipulations.
Time 1
Pre-interaction (Baseline)
Time 2 Post-interaction
Inclusion Exclusion Inclusion Exclusion
Similar Dissimilar Similar Dissimilar Similar Dissimilar Similar Dissimilar
Mean (SD)
Mean (SD)
Mean (SD)
Mean (SD)
Mean (SD)
Mean (SD)
Mean (SD)
Mean (SD)
108.24 (36.46) 110.15 (33.74) 102.71 (22.14) 104.94 (23.80) 114.89 (34.06) 98.61 (30.87) 116.72 (41.12) 101.98 (23.33)
While the means and ranges are consistent with prior research using salivary testosterone in men (DeSoto, Bumgardner, Close, and Geary, 2007), research has suggested that hormone assessments are apt to be non-normally distributed whereby violating a basic assumption of parametric hypothesis tests (Mehta and Josephs, 2006; Tabachnick and Fidell, 2006). Inspection of the baseline (Time 1) Testosterone (T) levels indicated
significant skew (2.834, SE = .267), z = 10.61, p < .001, and kurtosis (13.36, SE = .529), z = 25.26, p < .001. Based on these findings, two outliers were identified (more than +3 SD
above the mean) and removed from the T distribution. After removal of these two
participants, both skew (.345, SE = .271), z = 1.27, p > .05, and kurtosis (-.277, SE = .535), z = -.52, p > .05, were no longer different from zero (0). After removing the two outliers the
new baseline T level mean was 105.13 (SD = 30.94). Also of import, baseline T levels were
not significantly different across experimental conditions, F(3, 75) = .38, p = .77.
Additionally, the pre- and post- event T levels were significantly correlated across
individuals, r(79) =.66, p < .001, which would be expected due to individual differences in
average testosterone levels.
Similarity, Exclusion, and Testosterone Change
To test the effects of similarity and exclusion on T change levels, a two-way mixed
design ANOVA was computed using similarity and exclusion as the between-participant independent variables and T levels (i.e., Time) as the within-participant dependent variable.
Results indicated a significant within-participant Time x Similarity interaction, F(1, 75) =
8.76, p = .004, η2 = .11. As illustrated in figure 1, follow-up analyses indicated that
baseline T levels (Time 1) were not significantly different for participants in the high
29.27), t(77) = .73, p = .73, ns. However, after the group interaction (Time 2 T levels), the
difference between participants in the high similarity (M = 114.11, SD = 37.81) and high
dissimilarity conditions (M = 99.64, SD = 26.93) was much more pronounced, t(77) =
-1.98, p = .05. As predicted, simple slope analysis indicated a significant rise in T levels
after male participants interacted with highly similar group members, t(41) = -2.14, p =
.039, d =.33. The predicted opposite pattern emerged after participants interacted with
highly dissimilar group members, t(36) = 2.27, p = .029, d = .37. Interacting with highly
dissimilar others resulted in a significant decline in T levels, compared to baseline (Time 1) T levels. Overall, these results would indicate that similarity manipulation affected
testosterone, and this was largely independent of how the others treated the individual.
Figure 1.
The lack of an obtained interaction between similarity and exclusion suggests that the change in T levels (from Time1 to Time 2) is similar for included and excluded participants
across similar and dissimilar conditions.
Relations between Similarity, Exclusion, Control, and Anger
In an attempt to more fully understand the relations between similarity and potential mediators, zero-order correlations were computed between similarity and participant’s perceived control and anger. Results indicated that, while the experimental manipulation of similarity was not related to self reported feelings of exclusion, r(80) = -.05, ns, anger, r(80) = -.03, ns, or control threat, r(77) = -.01, ns., one’s psychological perception of
similarity (as indexed via the manipulation check) was negatively related to exclusion,
r(80) = -.49, p < .001, anger, r(80) = -39, p < .001, and control threat, r(80) = -.57, p <
members decreased, participants felt more excluded, angry, and threat to their sense of control over their immediate environment. Results also indicated that the exclusion manipulation increased both anger, r(80) = .47, p < .001 and control threat, r(80) = .59, p <
.001.
Relations between Testosterone Change, Control, Anger, and Intergroup Attitudes
To assess the relations between testosterone change and other experimental and attitudinal variables a series of partial correlations were computed controlling for Time 1 T
levels. Results indicated that T change was positively related to the experimental
manipulation of group similarity, r(76) = .32, p = .004, and old fashioned prejudicial
attitudes toward immigrants, r(76) = .36, p = .001. As discussed earlier, T levels increased
after interacting with highly similar others. In addition, increasing T levels were associated
with more negative attitudes toward immigrants. Marginal relations emerged between T
change and anger, r(76) = .20, p = .075, and control threat, r(76) = .21, p = .06. Increasing
levels of T were related to more reported anger and more threatened control after the
interaction between the participant and the other group members.
Exploratory Analyses
Although the correlation between the similarity manipulation and the self- reported perception of similarity to the group was easily significant, r(80) = .29, p = .01, the effect
size is not as large as one might expect. Furthermore, as above, the experimental manipulation of similarity was not related to self-report variables of anger, control threat,
or feelings of exclusion – while the participant’s self report of similarity was related to these other self-report measures. This is in the context of these variables relating to the biological measure of testosterone change. This appeared incongruent in that there was an apparent disconnect between the experimental manipulation of similarity and participants psychological perception of similarity. Moreover, the actual experimental manipulation of similarity was more closely associated with measured testosterone change than self-reported “psychological” similarity. To attempt to understand this, we computed an additional series of partial correlations.
Somewhat surprising, we found that statistically controlling for anger did not lessen the correlation between our experimental manipulation of similarity and the change in T
level. This would seem to mean that anger was not playing any mediating role in the connection between our similarity manipulation and T change. We did the same for our
prejudice variable, and also for control threat. Controlling for these variables did not decrease the variance accounted for – rather in each case there was a slight increase in the variance accounted for. When anger was controlled, the correlation between similarity and
T Change increased from r = .321 to r = .335. When control threat was partialled out, the
same effect occurred: the correlation increased from r = .321 to r = .335. When old
fashioned prejudice was controlled, the correlation increased to r = .321 to r = .36. None of
these variables were mediating the relationship; rather each appeared to be working as a slight suppressor variable – that is removing irrelevant variance.
resulted in these variables sharing a significant proportion of common method variance. These commonalities might be “response style” or “method variance” (Campbell and Fiske, 1959; Ganster, Henneessey, and Luthans, 1983; Kaplin and Saccuzzo, 2009). For example, response style has been defined as a tendency to respond to items “in a certain way regardless of the content” and reflects an individual’s approach to paper and pencil attitudinal surveys (p. 350, Kaplin and Sacuzzo, 2009). Response style may be shared variance that is irrelevant to the change in testosterone. Simply, there may be “noise” in each of the self-report variables not correlated with T change but by controlling for
self-reported psychological similarity we can suppress (or account for) this noise and leave the other variables (e.g., anger, threat, etc.) as improved predictors of T change (cf. Ganster et
al., 1983). To assess this, we computed a series of partial correlations between T change
and the experimental manipulations and self-reported attitude variables after controlling for both baseline T levels and psychological similarity. Results provided support for the
suppressor role of perceived psychological similarity. Of some interest, the partial correlations indicated that the strength of the relations between T-change and the exclusion
manipulation, r(75) = .22, p = .055, anger, r(75) = .29, p = .011, and control threat, r(75) =
.36, p = .001, all increased from previously non-significant to significant levels.
Discussion
To our knowledge, this is the first investigation of the neuroendocrine effects of young men interacting with similar others versus dissimilar others. The design is unique in that it controls for negative interactional effects and considers an individual interacting with a potential in-group versus an out-group. These results suggest that the neuroendocrine effects of a positive social interaction are different when the socializing occurs via a disparate out-group. As a whole, the results suggest that perceived similarity to others with whom one is interacting is more important than the nature of the interaction, at least in terms of testosterone response. The main effect for similarity suggests that when one interacts with others perceived as highly similar, there tends to be a rise in testosterone. Speculating on why nature might work this way, we considered that being told the other participants are surprisingly similar to you might prime a healthy desire to set oneself apart from (and possibly) above highly similar others. This is similar to the need for uniqueness argument advanced by some researchers (Zarate et al., 2004). This may also indicate that competing for dominant status among similar conspecifics is the normal response to positive social interactions among men. We also suspect that competition with those similar to oneself can be something like adult rough and tumble play, in that there is little risk of lethal escalation.
consider others as potential rivals or as future members of one’s in-group. In fact, in the real world attempts to gain dominance in such a situation are unlikely to offer significant future payoffs, and could be potentially dangerous.
When trying to fully understand the reasons behind the drop in testosterone, it is interesting to observe that, in absolute terms, the largest drop in testosterone occurs when those dissimilar to oneself behave in an inclusive manner. If testosterone is about vying for
dominance as a sub-strategy for passing on the most genes, why would having strangers be inclusive engender a drop in testosterone?
Perhaps in a situation where new and unknown men appear inclusive and not challenging, the correct guide to behavior is to tone-down the normal surge in testosterone that the anticipation of male-male interactions usually engenders (Suay et al., 1999). We hypothesized that a healthy social interaction among one’s peers should elicit healthy attempts to gain social dominance, whereas overtures indicating interest and inclusiveness by a new out-group calls for waiting. Results suggest this may be correct in that there was an average increase of 7 pg/mL when a healthy social interaction occurred among those perceived as highly similar, whereas a mean drop of 10 pg/ml was observed among participants who were interacting with highly dissimilar others but were inclusive. This was a post-hoc exploratory test, but it was a significant difference (p < .05).
We found the lack of decrease in the strength of the relationship between the experimental similarity manipulation and T change, after controlling for anger and control threat, of some interest. We interpret this as at least tentative support for the idea that social interactions among men are not always negative – and that negative feelings (such as those associated with threat to one’s control or anger) are not driving the effect of similarity on testosterone change during male-male interactions. Of some interest in terms of methodology, many of the attitudinal survey items appear to be able to function as suppressor variables in that partialling out their variance from the relation between the experimental manipulation of similarity and testosterone change was able to increase the predicative ability of other variables on testosterone change. Future research is needed to better understand the attitudinal variables associated with the testosterone change in this paradigm, but it seems possible that negative emotional reactions (anger, control threat) may be of lesser importance than other variables.
friendly rather than dominant and initially aggressive. Men in a new group are not likely to welcome someone who will result in a drop in their own status. Overall, one would need to be accepted first before climbing the dominance ladder. Thus it might be that when a group of new and dissimilar men are giving friendship cues, a temporary drop in testosterone might be better than a rise. We believe this research fits well with recent research (e.g., Carre and McCormick, 2008; DeSoto, Geary, Hoard, Sheldon, and Cooper, 2003) that suggests that when seeking hormonal correlates of external situations or behavioral tendencies it will often be the change in hormonal levels and not the absolute values that will tell the clearest story.
Acknowledgements: We would like to thank the College of Social and Behavioral Sciences and the Department of Psychology at the University of Northern Iowa for funding this research. We thank Ben Barclay, Anthony Leuken and Benjamin Stone for assistance with data collection.
Received 19 October 2009; Revision submitted 19 February 2010; Accepted 9 April 2010
References
Archer, J. (2006). Testosterone and human aggression: An evaluation of the challenge hypothesis. Neuroscience and Biobehavioral Reviews, 30, 319-345.
Brown, R., and Zagefka, H. (2005). Ingroup affiliations and prejudice. In J. F. Dovidio, P. Glick, and L. A. Rudman (Eds.), On the nature of prejudice: Fifty years after Allport (pp. 54-70). Malden, MA: Blackwell.
Carre, J. M., and McCormick, C. M. (2008). Aggressive behavior and change in salivary testosterone concentrations predict willingness to engage in a competitive task.
Hormones and Behavior,54, 403-409.
Cohen, J., and Cohen, P. (1983). Applied multiple regression/correlation for the behavioral sciences. Hillsdale, NJ: Erlbaum.
Campbell, D. T., and Fiske, D. W. (1959). Convergent and discriminant validation by the multitrait-multimethod matrix. Psychological Bulletin,56, 81-105.
Dabbs, J. M. (1997). Testosterone, smiling, and facial appearance. Journal of Nonverbal Behavior, 21, 45-55.
DeSoto, M. C., Bumgardner, J., Close, A., and Geary, D. C. (2007). Investigating the role of hormones in theory of mind. North American Journal of Psychology, 9, 535-544.
DeSoto, M. C., Geary, D. C., Hoard, M. K., Sheldon, M. S., and Cooper, L. (2003).
Estrogen fluctuations, oral contraceptives and borderline personality.
Psychoneuroendocrinology, 28, 751-766.
Fiske, S. T. (2005). Social cognition and the normality of prejudgment. In J. F. Dovidio, P. Glick, and L. A. Rudman (Eds.), On the nature of prejudice: Fifty years after Allport (pp. 36-53). Malden, MA: Blackwell.
Gaertner, S. L., and Dovidio, J. F. (2005). Categorization, recategorization, and intergroup
bias. In J. F. Dovidio, P. Glick, and L. A. Rudman (Eds.), On the nature of
prejudice: Fifty years after Allport (pp. 71-88). Malden, MA: Blackwell.
effects: Three alternative models. Academy of Management Journal, 26, 321-331.
Geary, D. C. (1998). Male, Female: The evolution of human sex differences. American
Psychological Association: Washington, DC.
Gladue, B., Boechler, M., and McCaul, K. (1989). Hormonal response to competition in human males. Aggressive Behavior,15,409-422.
Granger, D. A., Schwartz, E. B., Booth, A., and Arenz, M. (1999). Salivary testosterone determination in studies of child health and development. Hormones and Behavior, 35, 18-27.
Grant, V. J., and France, J. T. (2001). Dominance and testosterone in women. Biological Psychology,58, 41-47.
Johnson, H. R., Myhre, S. A., Ruvalcaba, R. H., Thuline, H. C., and Kelley, V. C. (1970). Effects of testosterone on body image and behavior in Klinefelter's syndrome: A pilot study. Developmental Medicine and Child Neurology,12, 454-60.
Kaplin, R. M., and Saccuzzo, D. P. (2009). Psychological testing: Principles, applications, and issues. Belmont, CA: Wadsworth.
Kivlighan, K. T., Granger, D. A., and Booth, A. (2005). Gender differences in testosterone and cortisol response to competition. Psychoneuroendocrinology, 30, 58-71.
Klinkova, E., Hestermann, M., and Hodges, J. K. (2004). Social parameters and urinary testosterone level in male chimpanzees (Pan troglodytes). Hormones and Behavior, 46, 474-481.
Krill, A. and Platek, S. M. (2009). In-group and out-group membership mediates anterior cingulated activation to social exclusion. Frontiers of Evolutionary Neuroscience,
Epub Apr 13, 2009.
Mazur, A., and Booth, A. (1998). Testosterone and dominance in men. Behavioral and
Brain Sciences,21, 353-363.
Mehta, P. H., and Josephs, R. A. (2006). Testosterone change after losing predicts the decision to compete again. Hormones and Behavior,50, 684-692.
Muehlenbein, M. P., Watts, D. P., and Whitten, P. L. (2004). Dominance rank and fecal testosterone levels in adult male chimpanzees (Pan troglodytes schweinfurthii) at
Ngogo, Kibale National Park, Uganda. American Journal of Primatology, 64,
71-82.
Muller, M. N., and Wrangham, R. W. (2004). Dominance, aggression and testosterone in wild chimpanzees: A test of the challenge hypothesis. Animal-Behavior, 67,
113-123.
Olweus, D., Mattsson, Å., Schalling, D., and Löw, H. (1988). Circulating testosterone
levels and aggression in adolescent males: A causal analysis. Psychosomatic
Medicine,50, 261-272.
Roney, J., Mahler, S., and Maestripieri, D. (2003). Behavioral and hormonal responses of men to brief interactions with women. Evolution and Human Behavior, 24,
365-375.
Schneider, B. H., Woodburn, S., del Pilar Soteras del Toro, M., and Udvari, S. J. (2005). Cultural and gender differences in the implications of competition for early adolescent friendship. Merrill Palmer Quarterly, 51, 163-191.
Sherif, M. (1966). In common predicament: Social psychology of intergroup conflict and Cooperation. Boston, MA: Houghton-Mifflin.
testosterone measured in saliva by immunoassay. Hormones and Behavior,42,
62-69.
Sidanius, J., Pratto, F., and Bobo, L. (1994). Social dominance orientation and political psychology of gender: A case of invariance. Journal of Personality and Social Psychology, 67, 998-1011.
Spielberger, C. D., Jacobs, G., Russell, S., and Crane, R. S. (1983). Assessment of anger: The state-trait anger scale. Advances in Personality Assessment, 2, 159-187.
Suay, F., Salvador, A., Gonzalez-Bono, E., Sanchis, C., Martinez, M., Martinez-Sanchis, S., Simon, V. M., and Montoro, J. B. (1999). Effects of competition and its outcome on serum testosterone, cortisol, and prolactin. Psychoneuroendocrinology, 24,
551-566.
Swim, J. K., Aikin, K. J., Hall, W. S., and Hunter, B. A. (1995). Sexism and racism: Old-fashioned and modern prejudices. Journal of Personality and Social Psychology, 68, 199-214.
Tabachnick, B. G., and Fidell, L. S. (2007). Using multivariate statistics (5th ed.). Boston,
MA: Allyn and Bacon.
Tajfel, H., and Turner, J. C. (1986). The social identity theory of intergroup conflict. In S. Worchel and W. G. Austin (Eds.), Psychology of intergroup relations (pp. 7-24).
Chicago: Nelson-Hall.
Tremblay, R. E., Schaal, B., Boulerice, B., Arseneault, L., Soussignan, R. G., Paquette, D., and Laurent, D. (1998). Testosterone, physical aggression, dominance, and physical development in early adolescence. International Journal of Behavior Development, 22, 753-777.
Ukens, L. L. (1998). Arctic expedition manual. San Francisco, CA: Wiley.
Van Bavel, J. J., Packer, D. J., and Cunningham, W. A. (2008). The neural substrates of in-group bias: A functional magnetic resonance imaging investigation. Psychological Science, 19, 1131-1139.
van Honk, J., Peper, J. S., and Schutter, D. J. (2005). Testosterone reduces unconscious fear but not consciously experienced anxiety: Implications for the disorders of fear and anxiety. Biological Psychiatry,58, 218-225.
Williams, K. D. (2001). Ostracism: The power of silence. New York: Guilford Press.
Williams, K. D. (2006). Ostracism. Annual Review of Psychology, 58, 425-452.
Yamagishi, T., and Mifune, N. (2009). Social exchange and solidarity: In-group love or out-group hate. Evolution and Human Behavior, 30, 229-237.
Zarate, M. A., Garcia, B, Garza, A. A., and Hitlan, R. T. (2004). Cultural threat and perceived realistic group conflict as predictors of attitudes towards Mexican immigrants. Journal of Experimental Social Psychology, 40, 99-105.