Anisotropic spreading of liquid metal on a rough
intermetallic surface
Wen Liu∗ Duˇsan P. Sekuli´c†
Abstract
An anisotropic wicking of molten Sn-Pb solder over an intermetallic rough surface has been studied. The phenomenon features preferential spreading and forming of an elliptical spread domain. A theoretically formulated model was established to predict the ratio of the wicking distance along the long axis (rx) to that along the short axis (ry) of
the final wicking pattern. The phenomenon was simultaneously experi-mentally observed and recorded with a hotstage microscopy technique. The anisotropic wicking is established to be caused by a non-uniform topography of surface micro structures as opposed to an isotropic wick-ing on an intermetallic surface with uniformly distributed surface mi-cro features. The relative deviation between the theoretically predicted rx/ry ratio and the corresponding average experimental value is 5%.
Hence, the small margin of error confirms the validity of the proposed theoretical model of anisotropic wicking.
Keywords: Surface tension driven flow, anisotropic spreading, rough surface.
1
Introduction
Wetting of the topographically complex interfaces and associated wicking phenomena over rough surfaces or porous domains have been for a long time of keen interest in a broad range of applications, including brazing, solder-ing, inkjet printing and micro fluid management [1-3]. A number of research
∗Department of Mechanical Engineering, College of Engineering, University of Ken-tucky, Lexington, KY 40506, USA
†Department of Mechanical Engineering, College of Engineering, University of Ken-tucky, Lexington, KY 40506, USA, e-mail: [email protected]
efforts have been made on isotropic wetting/wicking on rough/structured surfaces in the last two decades [4-13]. Virtually all of these studies de-scribe only the isotropic wetting/wicking phenomena. In most cases, a clas-sical Washburn type flow model [14] was implemented. In recent years, an anisotropic wetting/wicking begins to gain more attention as develop-ments in surface engineering and other micro scale applications became more prominent. Anisotropic wetting/wicking is usually achieved at a room tem-perature by using (i) micro/nano scale regular grooved structures engineered on a surface [15-17], (ii) micro/nano symmetric/asymmetric structures [18-20], and (iii) selective chemical patterning on surfaces [21-22]. As a rule, these studies are not fully devoted to kinetics of spreading. Only a few the-oretical models describing the liquid flow kinetics were reported under these conditions.
In this study, we demonstrate first an anisotropic wicking phenomenon at a temperature of ∼ 260 oC for the case of spreading of a molten Sn-Pb solder. This liquid metal spreading is caused by the capillary action involving micro scale topographic features on the so called IMC3 surface [10, 11]. Subsequently, the focus is shifted toward establishing a theoretical model for predicting the ratio of the wicking distances along two orthogonal and directions. Finally, corroboration of the theoretical model and empirical data was performed.
2
Phenomenological description and problem
for-mulation
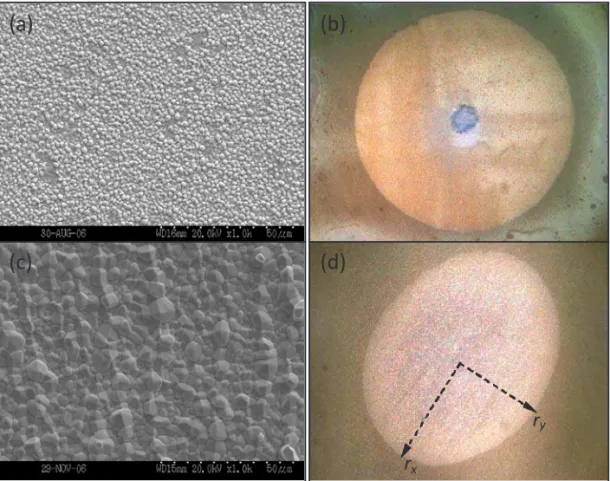
in the two orthogonal directions. Such non-uniformity of the topographical features leads to an anisotropic wicking of the molten metal. Figure 1 (d) offers an ultimate wicking pattern of the molten Sn-Pb solder on an IMC3 surface. This pattern resembles an ellipse, featuring a long and a short axis.
(a)
(b)
rx
ry
(c)
(d)
(a)
(b)
rx
ry
(c)
(d)
Figure 1: (a) SEM images Topography of IMC1 surface. (b) Wicking pattern (Circle) of Sn-Pb on IMC1. (c) Topography of IMC3 surface. (d) Wicking pattern (Ellipse) of Sn-Pb on IMC3.
IMC3, Figure 1 (c) and (d), the network channels formed by grains featur-ing non-uniform distribution directs molten metal into different directions with a different wicking rate. The most pronounced difference occurs in two orthogonal directions and results in an appearance of a long and short axis of the final wicking pattern with an elliptical shape. Figures 1 (b) and (d) indicate clearly ultimate triple line locations of molten metal on IMC1 and IMC3 surfaces, respectively.
3
Theoretical model
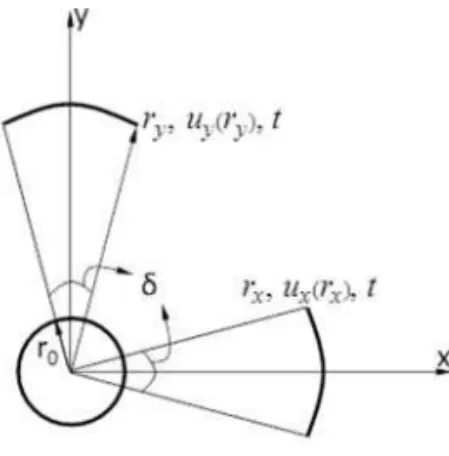
In Figure 2, a model configuration is presented for two orthogonal directions. The x and y axes represent the directions of the long and short radii of the preferential directions of an ellipse of Figure 1 (d). For both directions, a control volume within a very small angle δ is taken for analysis. The radiusr0 is the initial radius of the solder material;rx represents a random radial location of the wicking front radius within the range from r0 to the final radius, associated with ux(rx) andt; ry represents the same for the y direction. The model is established with the assumptions discussed in [12] as the experimental setup and materials used in these two series of experiments are identical.
Figure 2: Model configuration for an anisotropic wicking on IMC3 surface
ele-ment within the marked control volume, [23]
v=−1
µ[K· ∇p] (1)
where v is the velocity vector, µ is the dynamic viscosity, and K is an intrinsic permeability tensor of the porous medium. The pressure gradient ∇p is associated with the real flow path driven by the capillary force. The simplified equation for the velocity associated withrx in x direction may be expressed as
ux(rx) = kx
µ(− ∂p
∂x) (2)
The velocity of liquid while it flows through the location of rx at the corresponding time instant tcan also be expressed by definition as
ux(rx) =
d(rxτx)
dt (3)
where τx is tortuosity along the long axis, defined as the ratio of the real extended curved path that fluid passes through the micro channels to the shortest distance between the ends of the real path.
Equality of velocityux(rx) expressions of in equation (2) by Darcy’s law and definition of velocity in equation (3) will lead:
kx µ(−
∂p ∂x) =
d(rxτx)
dt (4)
The product (τxrx), which corresponds to an arbitrary positionrx, is the path of the molten metal flowing through IMC3 surface alterations. This product introduces tortuosity into the model, τx [24]. The tortuosity τx is along the long axis direction on the IMC3 surface.
The pressure gradient at a location rx in equation (2) can be approxi-mated as −∂p ∂x rx
∼ ∆p
τxrx
(5)
Combining Eq.(4) and (5) leads to
kx µτ2
x
∆p=rx drx
dt (6)
the open grooves formed by roughness features of the surface. In order to assess the capillary pressure, capillary force Fσ and associated areaA(α, θ) are introduced. The dominant feature of surface grooves is experimentally assessed to be of a V-shape [25]. Based on [12], [26], but with the groove of the profile height h0 only partially filled (h=ηh0), one gets
Fσ = 2ηh0σ
sinα [cosθ−
(α−θ) cosα
sin(α−θ) ] (7)
whereηis the filling factor which is introduced in our recent work [12], [13]. The actual cross sectional area of liquid in a single V-groove can be expressed as, [13]
A(α, θ) = (ηh0)2sin
2(α−θ) tanα−(α−θ) + sin(α−θ) cos(α−θ)
tan2(α) sin2(α−θ) (8)
Note that equation (10) includes an impact of the filling factor η [12, 13], not present in the modeling referred to in [26].
With ∆p = Fσ/A(α, θ), Fσ and A(α, θ) from equation (7) and (8) re-spectively, an integration of equation (6) with respect to time from t0 tot across the domain of spreading from r0 torx, respectively, leads to
r2x= 4 1 ηh0
kx τ2 x
σ
µG(α, θ)t+r
2
0 (9)
Applying the same consideration for the flow in the y direction will lead to the relation betweenry andt, that is
ry2= 4 1 ηh0
ky τ2 y
σ
µG(α, θ)t+r
2
0 (10)
Equations (9) and (10) include both the same geometric parameter, G, i.e.,
G(α, θ) = [cosθ
−(α−θ) cosα
sin(α−θ) ] tan2(α) sin2(α−θ)
sinα[sin2(α−θ) tanα−(α−θ) + sin(α−θ) cos(α−θ)] (11)
of the two radii, Equations (9) and (10), offers the relationship between the wicking distance in x direction (the long axis) to that in the y direction (the short axis). rx ry = kx τ2 x
+ µηh0r20
4σG(α,θ)t ky
τ2
y
+ µηh0r20
4σG(α,θ)t
1/2
≈ τy
τx
(
kx ky
)1/2
(12)
where τx, τy are the tortuosity along the long axis (x-axis) and the short axis (y-axis) of the ellipse, respectively. The quantities kx and ky are the permeabilities associated with the x-axis and y axis, respectively. Hence, the ratio of the wicking radii in two orthogonal directions is expressed as a function of tortuosity and permeability. A careful consideration of the order of magnitude of the terms on the right-hand side of the first equality in equation (12) reveals that [µηh0r20/4σG(α, θ)t]≪[kx/τx2], where [µηh0r02/4σG(α, θ)t]∼O(10−17) and [kx/τx2]∼[ky/τy2]∼O(10−14). Conse-quently, the second equality would hold with a high level of precision.
4
Materials and experimental procedures
The substrate was manufactured from a virgin Cu sheet. A Cu plate was dipped into the molten Sn at 260˚C, then the re-solidified Sn coating was etched away to expose the IMC layer formed at the interface. The details of this procedure were described in [10, 11].
Subsequently, the manufactured substrate was exposed to an experimen-tal procedure aimed at establishing the kinetics of the liquid meexperimen-tal spread-ing. The hot stage microscopy was used to analyze kinetics of the triple line movement. A substrate coupon having overall dimensions of 10 mm × 10 mm × 0.3 mm (or 0.5 mm) is positioned within the chamber of the LINKAM THMS 600 hot stage installed on an OLIMPUS BX51M optical microscope. A solder specimen was covered with a thin layer of RMA flux [EC-19S-8, Tamura Corp.]. The chamber was filled with ultra high purity N2 (99.999%), after purging with nitrogen for 120 minutes before an initiation of the heating cycle. The purging has secured at least 30 chamber’s volume replacements. The purging was continued during a test. The heating cycle consists of a ramp up, dwell and quench assisted by a liquid nitrogen cooling system.
readings for a given instant of time at the onset of melting, with the eutec-tic solder melting point temperature known. Correspondingly, temperature readings were corrected and the bias was eliminated. The series of thermal contact resistances includes (i) Ag heating block - quartz glass interface, (ii) quartz - glass -interface - substrate, and (iii) substrate-solder interface, in presence of flux. The peak temperature is set to be consistently 30K above the liquidus temperature of the corresponding solder. During the heating/cooling cycle, digital imaging is performed with a 22 frames/s dig-ital camera system. Movie clips were digdig-itally decomposed into individual frames and associated with digitally recorded corresponding substrate tem-perature histories. The ratio of the wicking distance along the long axis to that along the short axes rx/ry indicated in Figure 1 (d) is experimentally measured after performing four different tests. Data handling was performed using the ImagePro Plus software. The measured ratios were 1.25, 1.40, 1.26 and 1.47, respectively. The average value is 1.35 with the standard deviation of 0.11.
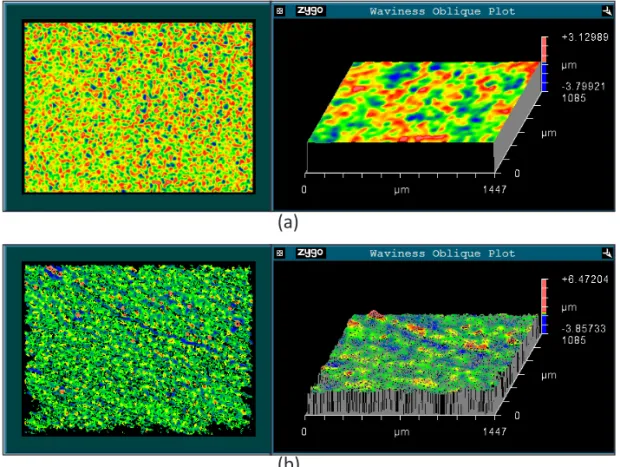
Each IMC surface was also scanned by a Zygo 3D optical surface profiler for an area of 1.447 mm×1.085 mm with an optical magnification of 200×. The Zygo optical profilometer has a vertical resolution of 0.1 nm and field of view of 0.04 – 17.5 mm. The surface topography measurements were done at ambient conditions.
Figure 3 (a) and (b) offers respectively the topography analysis results for IMC1 and IMC3 generated by the Zygo 3D optical surface profiler. The surface scanning was conducted on a random location with a scanning area of 1.447mm × 1.085mm on both IMC1 and IMC3 surfaces. The scanning results indicate clearly the topographic difference of IMC1 and IMC3 sur-faces. Comparing to IMC1, the surface topographical structures on IMC3 are with a larger size, and are distributed with a much less uniformity and a preferential anisotropy. The surface structures on IMC1 and IMC3, with various sizes and different distributions of the surface topographical features, resulted in either isotropic or anisotropic wicking behavior, respectively.
5
Results and discussion
The permeability is expressed as a function of the surface porosity [27], [12] and roughness [28].
ktheor= ε 6(
2ε B)
(a)
(b)
Figure 3: (a) Roughness analysis of IMC1 surface with Zygo optical profiler. (b) Roughness analysis of IMC3 surface with Zygo optical profiler.
where ktheor is theoretically derived permeability; ε is the porosity; B is the ratio of total surface area of voids throughout the porous medium to the total volume of the porous medium. Note that the total volume of the porous medium in this study is the product of the projected area and the height of the IMC substrate.
value of that ratio is 1.35, with the standard deviation of 0.11. With all the measured parameters for the topographical features, the theoretical ratio presented in equation (12) is calculated to be 1.42. Correspondingly, the relative deviation between theoretically predictedrx/ry ratio (1.42) and the average experimental value (1.35) is only 5%. This small margin of error verifies the validity of the theoretically derived model of the considered anisotropic wicking.
6
Conclusion
An anisotropic wicking phenomenon involving spreading of molten Sn-Pb solder on a fabricated intermetallic rough surface was modeled and studied experimentally with the aid of hotstage microscopyin situ and in real time.
Comparison of IMC1 and IMC3 indicates that IMC3 has non-uniformly distributed surface structures. The rough intermetallic surface is ultimately characterized by experimentally measured surface porosity and roughness. A theoretically derived model was established to predict the ratio of wicking distance along the long axis (rx) to that along the short axis (ry) of the final wicking pattern featuring an elliptical shape. The relative deviation between theoretically predicted rx/ry ratio and the average experimental value is around 5%. This small margin of error proves validity of the theoretically established model. Thus, an anisotropic wicking can be predicted with an analytical model proposed.
Acknowledgment
This research is supported in part through 829-RDE-007 and KSEF-1490-RDE-010 grants. Authors appreciated preliminary experimental work conducted by and assistance of Dr. H. Zhao and Dr. H. Wang during their tenure as postdoctoral fellow and a graduate student, respectively in the Brazing Laboratory of the University of Kentucky.
References
[1] De Gennes, P.G. (1985) Wetting: statics and dynamics, Reviews of Modern Physics, Vol. 57, No. 3, pp.827-863
[3] Qu´er´e, D. (2008) Wetting and Roughness, Ann. Rev. Mater. Res., Vol. 38, pp.71-99
[4] Sekulic, D. P. (2011) Wetting and spreading of liquid metal through open micro grooves and surface alterations, Heat Transfer Engineering, Vol. 32 (7-8), pp. 648-657
[5] Cazabat, A.M.; Cohen Stuart, M.A. (1986) Dynamics of wetting: Effects of surface roughness, J. Phys. Chem., Vol.90, pp.5845-5849
[6] Bico, J.; Tordeux, C.; Qu´er´e, D. (2001) Rough wetting, Europhys. Lett., Vol. 55 (2), pp.214-220
[7] Dussaud, A.D.; Adler, P.M.; Lips, A. (2003) Liquid transport in the networked microchannels of the skin surface, Langmuir, Vol. 19, pp.7341-7345
[8] Hay, K.M.; Dragila, M.I.; Liburdy, J. (2008) Theoretical model for the wetting of a rough surface, Journal of Colloid and Interface Science, Vol. 325, pp.472-477
[9] Chen, Y.K.; Melvin, L.S.; Rodriguez, S.; Bell, D.; Weislogel, M.M. (2009) Capillary driven flow in micro scale surface structures, Microelectronic Engineering, Vol. 86, pp.1317-1320
[10] Zhao, H.; Wang. H.; Sekulic, D.P.; Qian, Y. (2009a) Spreading Kinetics of Liquid Solders over an intermetalic solid surface, Part 1: Lead solders, Journal of Electronic Materials, Vol.38, pp.1838-1845
[11] Zhao, H.; Wang. H.; Sekulic, D.P.; Qian, Y. (2009b) Spreading Kinetics of Liquid Solders over an intermetalic solid surface, Part 2: Lead-free solders, Journal of Electronic Materials, Vol.38, pp.1846-1854
[12] Liu, W and Sekulic, D.P (2011) Capillary driven molten metal flow over topograph-ically complex substrates, Langmuir, Vol. 27(11), pp. 6720-6730
[13] Liu, W.; Li, Y.; Cai, Y.; Sekulic, D.P. (2011) Capillary Rise of Liquids over a Microstructured Solid Surface, Langmuir, Vol. 27(23), pp. 14260-14266
[14] Washburn, E.W. (1921) The dynamics of capillary flow, Phys. Rev. Vol. 17, pp. 273-283.
[15] Zhao, Y., Lu, Q., Li, M., and Li, X. (2007) Anisotropic wetting characteristics on submicrometer-scale periodic grooved surface, Langmuir, Vol. 23, pp. 6212-6217
[16] Li, W., Fang, G., Li, Y., and Quan, G. (2008) Anisotropic wetting behavior arising from super hydrophobic surfaces: parallel grooved structure, J. Phys. Chem. B, Vol.112, pp. 7234-7243
[18] Priest, C., Albrecht, T.W.J., Sedev, R. and Ralston, J. (2009) Asymmetric wetting hysteresis on hydrophobic microstructured surfaces, Langmuir, Vol. 25(10), pp. 5655-5660
[19] Anantharaju, N., Panchagnula,V., and Vedantam, S. (2009) Asymmetric wetting of patterned surfaces composed of intrinsically hysteretic materials, Langmuir, Vol. 25(13), pp. 7410-7415
[20] Chu, K-H., Xiao, R. and Wang, E.N. (2010) Uni-directional liquid spreading on asymmetric nanostructured surfaces, Nature Materials, Vol. 9, pp. 413-417
[21] Dupuis, A, Leopoldes, J., Bucknall, D. G. & Yeomans, J. M (2005) Control of drop positioning using chemical patterning, Appl. Phys. Lett., Vol. 87, 024103
[22] Gleiche, M., Chi, L. F. & Fuchs, H. Nanoscopic channel lattices with controlled anisotropic wetting, Nature, Vol. 403, pp. 173-175
[23] Flow through Porous Media (1970) American Chemical Society (Symposium on Flow Through Porous Media, 1969, Washington, D.C.)
[24] Epstein, N. (1989) On Tortuosity and the Tortuosity Factor in Flow and Diffusion through Porous Media, Chemical Engineering Science, Vol. 44, No. 3, pp.777-779
[25] Liu, W., Lu, L., Li, Y., Cai, Y. and Sekulic, D.P. (2011) Preferential spreading of molten metal over an anisotropically microstructured surface, to be published.
[26] Rye, R.R.; Mann, J.A. Jr.; Yost, F.G. (1996) The flow of liquid in surface grooves, Langmuir, Vol.12, pp.555-565
[27] Hubbert, M.K. (1957) Darcy’s Law and the Field Equations of the Flow of Under-ground Fluids, Hydrological Sciences Journal, Vol.2, Issue 1 (March 1957), pp.23-59
[28] Wenzel, R.N. (1936) Resistance of Solid Surfaces to Wetting by Water, Industrial and Engineering Chemistry, Vol. 28, No. 8, pp. 988-994
[29] Boving, T.B., and Grathwohl, P. (2001) Tracer Diffusion Coefficients in Sedimentary Rocks: Correlation to Porosity and Hydraulic Conductivity, Journal of Contaminant Hydrology, Vol.53, pp.85-100
Anizotropno prostiranje teˇcnog metala na hrapavoj metalnoj povrˇsini
Anizotropno prostiranje rastopljene legure Sn-Pb koje je uzrokovano de-jstvom sila povrˇsinskog napona preko hrapavog metalnog substrata anal-izirano je koriˇs´cenjem teorijskog modela i serije eksperimenata. Anizotropna topografija substrata uzrokije anizotropno prostiranje trojne linije teˇcnosti i formiranje eliptiˇcnog prostornog domena. Analiticki model je zasnovan na uvaˇzavanju zakona Darci-ja i oˇcuvanja mase.Analizirana pojava je eksper-imentalno registrovana u realnom vremenu, in situ, koriˇs´cenjem optiˇcke
mikroskopije na poviˇsenim temperaturama. Topografija substrata je anal-izirana optiˇckom profilometrijom i atomskom mikroskopijom. Relativno odstupanje koliˇcnika glavnih radijusa eliptiˇcnog domena prostiranja odred-jeno teorijskim predvidjanjem i eksperimentalnim merenjem je reda veliˇcine 5 procenata.