www.the-cryosphere.net/6/625/2012/ doi:10.5194/tc-6-625-2012
© Author(s) 2012. CC Attribution 3.0 License.
The Cryosphere
Multi-decadal marine- and land-terminating glacier recession
in the Ammassalik region, southeast Greenland
S. H. Mernild1, J. K. Malmros2, J. C. Yde3, and N. T. Knudsen4
1Climate, Ocean, and Sea Ice Modeling Group, Los Alamos National Laboratory, New Mexico, USA 2Department of Geography and Geology, University of Copenhagen, Denmark
3Sogn og Fjordane University College, Sogndal, Norway
4Department of Geoscience, Aarhus University, Aarhus, Denmark
Correspondence to: S. H. Mernild (mernild@lanl.gov)
Received: 26 January 2012 – Published in The Cryosphere Discuss.: 7 February 2012 Revised: 9 May 2012 – Accepted: 15 May 2012 – Published: 6 June 2012
Abstract. Landsat imagery was applied to elucidate glacier fluctuations of land- and marine-terminating outlet glaciers from the Greenland Ice Sheet (GrIS) and local land-terminating glaciers and ice caps (GIC) peripheral to the GrIS in the Ammassalik region, Southeast Greenland, dur-ing the period 1972–2011. Data from 21 marine-terminatdur-ing glaciers (including the glaciers Helheim, Midgaard, and Fen-ris), the GrIS land-terminating margin, and 35 GIC were ex-amined and compared to observed atmospheric air atures, precipitation, and reconstructed ocean water temper-atures (at 400 m depth in the Irminger Sea). Here, we docu-ment that net glacier recession has occurred since 1972 in the Ammassalik region for all glacier types and sizes, except for three GIC. The land-terminating GrIS and GIC reflect lower marginal and areal changes than the marine-terminating out-let glaciers. The mean annual land-terminating GrIS and GIC margin recessions were about three to five times lower than the GrIS terminating recession. The marine-terminating outlet glaciers had an average net frontal retreat for 1999–2011 of 0.098 km yr−1, which was significantly higher than in previous sub-periods 1972–1986 and 1986– 1999. For the marine-terminating GrIS, the annual areal re-cession rate has been decreasing since 1972, while increas-ing for the land-terminatincreas-ing GrIS since 1986. On average for all the observed GIC, a mean net frontal retreat for 1986– 2011 of 0.010±0.006 km yr−1and a mean areal recession of around 1 % per year occurred; overall for all observed GIC, a mean recession rate of 27±24 % occurred based on the 1986 GIC area. Since 1986, five GIC melted away in the Ammas-salik area.
1 Introduction
The Greenland Ice Sheet (GrIS) – land- and marine-terminating outlet glaciers on the periphery of the GrIS – and local land-terminating glaciers and ice caps (GIC) periph-eral to the GrIS have undergone rapid changes over the last decades. Most notable changes are thinning, leading to desta-bilization and accelerated retreat of GrIS marine-terminating glaciers (Joughin et al., 2004, 2010; Howat et al., 2005, 2008; Rignot and Kanagaratnam, 2006; Moon and Joughin, 2008; Nick et al., 2009), and increasing mass loss, thinning, and retreat of land-terminating GIC (Yde and Knudsen, 2007; Mernild et al., 2011a; Radi´c and Hock, 2011).
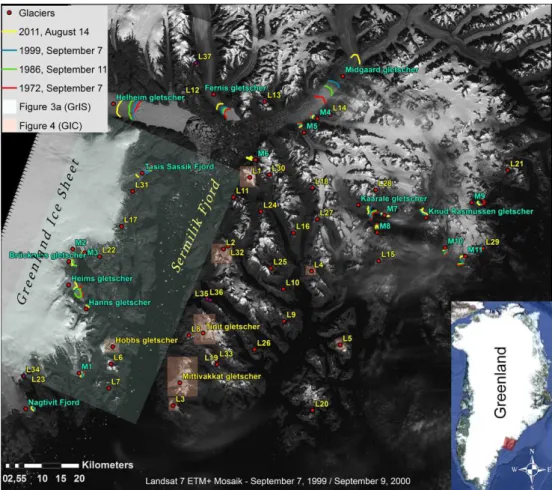
Fig. 1. The Ammassalik region, including the Sermilik Fjord and parts of the southeastern sector of the GrIS. The marine-terminating glacier
margins are marked with positions (lines) for each of the survey years: 1972 (red color), 1986 (green), 1999 (blue), and 2011 (yellow) (the location names are written in turquoise). The 35 local land-terminating glaciers and ice caps (GIC) peripheral to the GrIS are written in yellow, where eight are marked with shaded areas; marginal changes for those eight GIC and the GrIS are illustrated in detail. The GIC marked with L33–L37 are examples of GIC that melted away during 1986–2011. The inset figure indicates the general location of the Ammassalik region in Southeast Greenland (source: Landsat 7 ETM+ Mosaik, 7 September 1999/9 September 2000).
been driven mainly by higher surface temperatures (increas-ing surface ablation) and decreas(increas-ing precipitation (decreas-ing snow accumulation) since the mid-1900s (Mernild et al., 2011a).
The glacier contribution to sea-level rise from Greenland marine-terminating glaciers has been analyzed by satellite. Howat and Eddy (2011) identified changes in ice-frontal positions from 210 GrIS marine-terminating glaciers with fronts wider than 1 km (spanning nearly four decades, 1972– 2010). These results show a trend of accelerated recession, where 90 % of the observed glaciers receded between 2000 and 2010. Box and Decker (2011) identified areal changes at 39 of the widest Greenland marine-terminating glaciers (2000–2010). Collectively, the 39 glaciers lost a cumula-tive area of 1368 km2. For the Ammassalik region – a re-gion including the Ammassalik Island, the Sermilik Fjord (the largest fjord system in Southeast Greenland) and its sur-rounding landscape – only frontal changes of major GrIS marine-terminating glaciers, such as Helheim, Fenris, and
Midgaard glaciers, have been observed in earlier studies; however, at least 21 marine-terminating glaciers have been identified; all 21 were included in this study (Fig. 1).
For the land-terminating GIC in Greenland, margin retreat has been sparsely observed (Yde and Knudsen, 2007), and the only currently published time series of whole glacier in-situ mass balance observations (since 1995/1996) is from the Mittivakkat Gletscher, located in the Ammassalik region (WGMS, 2009; Mernild et al., 2011a), even though thou-sands of individual GIC are located on the land-strip between the GrIS and ocean, of which several hundred are situated in the Ammassalik region (Mernild et al., 2012). Thus, there is a need for more information about contemporary glacier fluc-tuations of Greenlandic GIC and their coupling to climate change.
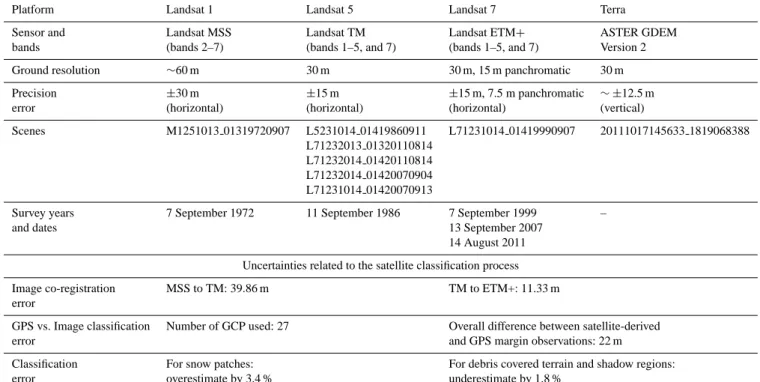
Table 1. Satellite platform, sensors, band information, scenes used in the analysis, and uncertainties related to the satellite classification
process.
Platform Landsat 1 Landsat 5 Landsat 7 Terra
Sensor and Landsat MSS Landsat TM Landsat ETM+ ASTER GDEM
bands (bands 2–7) (bands 1–5, and 7) (bands 1–5, and 7) Version 2
Ground resolution ∼60 m 30 m 30 m, 15 m panchromatic 30 m
Precision ±30 m ±15 m ±15 m, 7.5 m panchromatic ∼ ±12.5 m
error (horizontal) (horizontal) (horizontal) (vertical)
Scenes M1251013 01319720907 L5231014 01419860911 L71231014 01419990907 20111017145633 1819068388 L71232013 01320110814
L71232014 01420110814 L71232014 01420070904 L71231014 01420070913
Survey years 7 September 1972 11 September 1986 7 September 1999 –
and dates 13 September 2007
14 August 2011
Uncertainties related to the satellite classification process
Image co-registration MSS to TM: 39.86 m TM to ETM+: 11.33 m error
GPS vs. Image classification Number of GCP used: 27 Overall difference between satellite-derived
error and GPS margin observations: 22 m
Classification For snow patches: For debris covered terrain and shadow regions:
error overestimate by 3.4 % underestimate by 1.8 %
behaviour of glacier changes for the past four decades for the identified marine-terminating glaciers, the GrIS land-terminating margin, and the GIC during a period of cli-mate warming. The average multi-decadal glacier recession in the Ammassalik region (65◦N, 37◦W) was examined, rather than the annual range of variability, even though re-cent observations suggest that major changes in the dy-namics of Greenland marine-terminating glaciers take place over timescales of 3–10 yr (Howat et al., 2007; Nick et al., 2009; Andresen et al., 2011; Johannessen et al., 2011), rather than over several decades or centuries as previously believed (Truffer and Fahnestock, 2007).
Here, on approximately decadal scale we examine net frontal position and area fluctuations using multispectral Landsat satellite data, observing 21 marine-terminating glaciers from 1972–2011, land-terminating glacier frontal positions for parts of the GrIS, and of 35 GIC from 1986– 2011 for the Ammassalik region – a region including the ther-modynamic transition zone from the North Atlantic Ocean into the Arctic Ocean through the Denmark Strait. Changes were considered in the context of meteorological observa-tions and reconstructed ocean water temperature time series. As part of the study, the cumulative net area changes for the marine-terminating glaciers were examined. Finally, we in-vestigate differences in marginal change rates between the marine and the terrestrial glacier environments.
2 Data and methods
The Landsat and Advanced Spaceborne Thermal and Reflec-tion Radiometer (ASTER) Global Digital ElevaReflec-tion Model Version 2 (GDEM v2) scenes were selected and acquired through WIST (http://reverb.echo.nasa.gov/reverb/redirect/ wist: EOSDIS, 2009): Landsat 1 carried the four-band Mul-tispectral Scanner (MSS); Landsat 5 carried the seven-band Thematic Mapper (TM); and Landsat 7 carried the eight-band Enhanced Thematic Mapper Plus (ETM+), having a ground resolution of∼60, 30, and 30 m (15 m in the panchro-matic band 8), respectively. The ASTER GDEM v2 provides a ground resolution of 30 m (Table 1) and is used to estimate minimum, mean, and maximum GIC elevations.
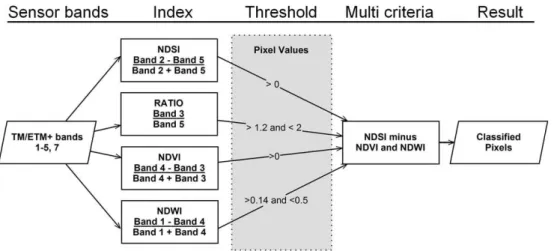
Fig. 2. An example of the multi-criteria analysis for the Landsat 5 TM and Landsat 7 ETM+ scenes. For the latter the corresponding values
were 1999 NDSI>0, NDWI>0.16 and<0.45, and NDVI<0, and for 2011 NDSI>0, NDWI>0.15 and<0.5, and NDVI<0. Band ratios were the same for all scenes. The analysis was carried out using the tool BandMath in ENVI™.
minimize misclassification. All imagery and features were projected in WGS84, UTM Zone 24 N, and the selected scenes were radiometricly calibrated using the Landsat cali-bration tool in ENVI™ software package (http://www.ittvis. com/ProductServices/ENVI.aspx), converting the band val-ues to “At Surface Reflectance”. The individual bands (TM and ETM+ bands 1–5, and 7, and MSS bands 2–7) were standardized using the ENVI™ Dark Subtract (DS) tool be-fore ratio and indices were calculated. Standard pixel er-rors associated with the different scenes and sensors were
±30 m (MSS), ±15 m (TM), ±15 m (7.5 m panchromatic) (ETM+), and±30 m (ASTER GDEM v2). The error associ-ated with the ASTER GDEM v2 is expected to be∼ ±12.9 m vertically (Table 1); however, larger uncertainty might oc-cur vertically in steep terrain and in areas of poor contrasts (Tachikawa et al., 2011).
The image co-registration errors associated with the indi-vidual sensor types were 39.86 m (MSS-TM) and 11.33 m (TM-ETM+) (due to the root mean square, RMS), based on 27 near-sea ground control points (GCP) for each sen-sor type (Table 1). The supervised classification process used for the 1986, 1999, and 2011 scenes was based on a multi-criteria analysis involving the calculation of a set of indices (Fig. 2): normalized difference snow index (NDSI; Dozier and Warren, 1982); normalized difference water in-dex (NDWI; Gao, 1996); NDVI (normalized difference veg-etation index; Rouse et al., 1973); and RATIO bands 3/5 TM/ETM+. The RATIO was used in reference due to bet-ter performance than the NDSI index in mountainous areas (like the Ammassalik region) capturing ice and snow cov-ered areas influenced by shadows and debris (Paul, 2004). The NDVI was used to filter out vegetation and the NDWI to identify and filter out lakes in the margin area of the GrIS and GIC. The resulting classifications were converted to (1) poly-gon files and cleaned up manually in ESRI™ ArcMap by
visual inspection, (2) poly-line files for visual presentation; and (3) point shapes with a 30-m distribution along the lines and used to examine the mean and median center of the mar-gin distribution for each year. The 1972 scene was not in-cluded in the classification process since the spectral bands of the Landsat 1 MSS sensor used different wavelengths and band distribution than both the TM and ETM+ sensors, and thus is not eligible for this type of snow/ice classification. The raw model precision errors for each year compared with the cleaned up classification were found to be 5.2 % (over-estimate by 3.4 % due to snow patches and under(over-estimate by 1.8 % due to heavily debris covered terrain and shadow re-gions) overall, with 1999 being the most troublesome year (Table 1).
The GrIS and GIC margin positions were digitized for each of the years, and the distance between the margins was calculated at the dominant glacier’s flow direction using a centerline method approach. The expected errors related to the classification and determination of the glacier margin po-sitions are shown in Table 1.
The selection of the 35 GIC was randomly chosen: (1) fol-lowing the regional distribution due to size, aspect, and el-evation, and (2) trying to avoid area where the 2011 scene SLI failure could influence the classification. The 2007 scene gap-fill was used in reference only when absolutely neces-sary.
Fig. 3. A comparison between the Landsat-derived Mittivakkat
Gletscher margin and the observed margin based on portable GPS observations (green line with dots) for August 2011. The inset fig-ure indicates the location of the observed margin at Mittivakkat Gletscher. The oblique black lines are due to the SLI malfunction.
The observed meteorological data, air temperature and precipitation were obtained from the Danish Meteorological Institute (DMI) station in Tasiilaq for 1972–2011, located less than 10 km from the Sermilik Fjord outlet, and recon-structed ocean subsurface water temperatures at 400 m depth in the Irminger Sea were used as a proxy for the variability of the subsurface warm Atlantic water in the Sermilik Fjord (Johannessen et al., 2011).
3 Results and discussion
3.1 Marine-terminating glaciers
For the Ammassalik region, the 21 observed marine-terminating glaciers, on average for the survey period 1972– 2011, receded at a net rate of 0.053±0.113 km yr−1 (here and below, the ±standard deviations are included) with a median of 0.025 km yr−1(Table 2). For 1999–2011, the mean net recession rate was 0.098±0.171 km yr−1, which is in ac-cordance with the mean net recession rate of 0.11 km yr−1
for 210 GrIS marine-terminating outlet glaciers (2000–2010) determined by Howat and Eddy (2011). For the sub-periods the fraction of marine-terminating glaciers in net recession increased from 57 % (1972–1986), 86 % (1986–1999) to 100 % (1999–2011), indicating complete marine-terminating glacier retreat for the Ammassalik region since 1999. For Southeast Greenland, Howat and Eddy (2011) estimated an increasing fraction of net retreat from 55 % (1972–1985), 73 % (1985–2000) to 89 % (2000–2010) (n=38). For the last period, this was almost in the same order of magnitude as the fraction of glacier recession determined for the Am-massalik region.
On an individual glacier scale, Midgaard, Helheim, Tasis Sassik Fjord, Heims, and Fenris had (as listed) the five highest net recession rates of 0.365 km yr−1 (this equals a net frontal recession of 14.3 km), 0.155 km yr−1 (6.0 km), 0.130 km yr−1 (5.1 km), 0.075 km yr−1 (2.8 km), and 0.065 km yr−1(2.6 km), respectively (Fig. 4) for 1972– 2011. All five glaciers are outlets from the GrIS, receiving ice from the interior of the ice sheet, having the largest GrIS catchment areas within the Ammassalik region and probably also the greatest ice thickness and therefore more susceptible to enhanced submarine melting via warmer water intruding beneath the ice, than the other observed outlet glaciers (due to their shallow depth of the glacier bases). Overall for the Ammassalik region, 80 % of the marine-terminating glaciers receded at rates less than 0.050 km yr−1(Fig. 4), and Thomas et al. (2009) suggested that outlet glaciers without deep beds are changing far more slowly. The mean net recession rates during the period 1972–2011 for the glaciers Midgaard, Hel-heim, and Fenris compared well with the recession rates de-termined by Howat and Eddy (2011) for 1972–2010.
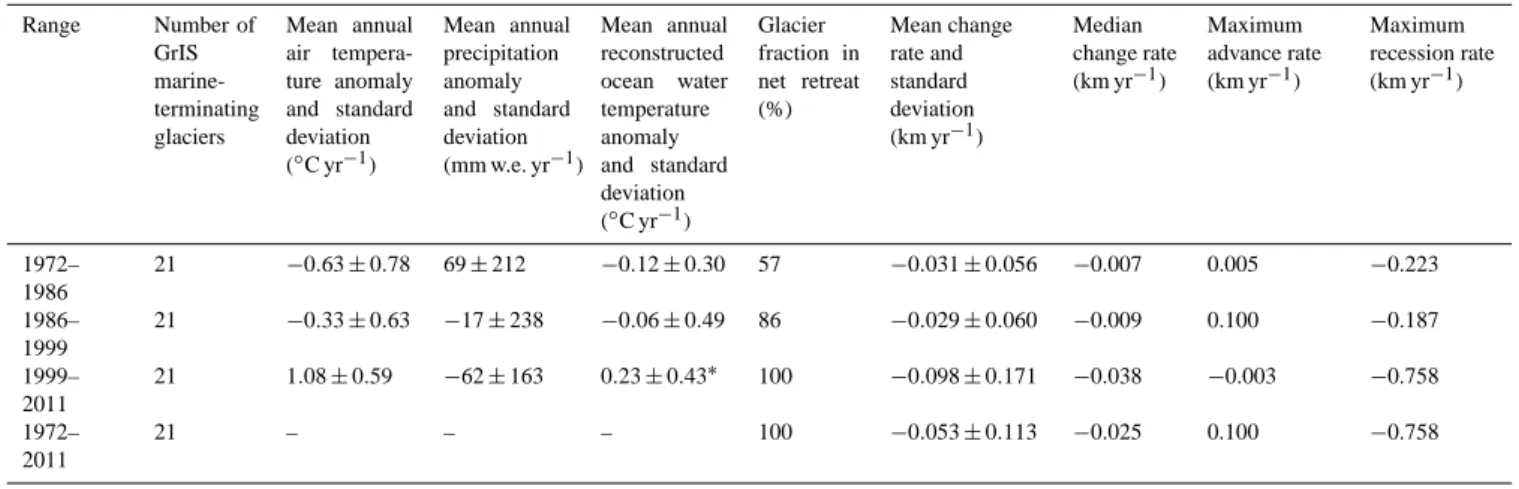
Table 2. Frontal position change rate statistics for the period 1972–2011 for the GrIS marine-terminating glaciers in the Ammassalik region,
mean annual air temperature and precipitation anomaly from the DMI meteorological station in Tasiilaq, and mean annual reconstructed ocean water temperature anomaly at 400 m depth in the Irminger Sea (Johannessen et al., 2011).
Range Number of GrIS marine-terminating glaciers
Mean annual air tempera-ture anomaly and standard deviation (◦C yr−1)
Mean annual precipitation anomaly and standard deviation (mm w.e. yr−1)
Mean annual reconstructed ocean water temperature anomaly and standard deviation (◦C yr−1)
Glacier fraction in net retreat (%)
Mean change rate and standard deviation (km yr−1)
Median change rate (km yr−1)
Maximum advance rate (km yr−1)
Maximum recession rate (km yr−1)
1972– 1986
21 −0.63±0.78 69±212 −0.12±0.30 57 −0.031±0.056 −0.007 0.005 −0.223 1986–
1999
21 −0.33±0.63 −17±238 −0.06±0.49 86 −0.029±0.060 −0.009 0.100 −0.187 1999–
2011
21 1.08±0.59 −62±163 0.23±0.43∗ 100 −0.098±0.171 −0.038 −0.003 −0.758 1972–
2011
21 – – – 100 −0.053±0.113 −0.025 0.100 −0.758
∗Data are missing from 1995 and 1996, and only present until 2009.
Fig. 4. Satellite-derived net frontal recession for the 21 marine-terminating glaciers in the Ammassalik region for the sub-periods 1972–1986
(green), 1986–1999 (blue), and 1999–2011 (yellow). For glacier locations, see Fig. 1.
small fluctuations in glacier frontal positions (1972–1985) to moderately widespread recession in the southeast and west-ern parts of GrIS (1985–2000), followed by an accelerated net recession in all regions of the ice sheet (2000–2010).
Since 1972, the 21 marine-terminating glaciers showed a cumulative net area loss of 281 km2, with mean annual
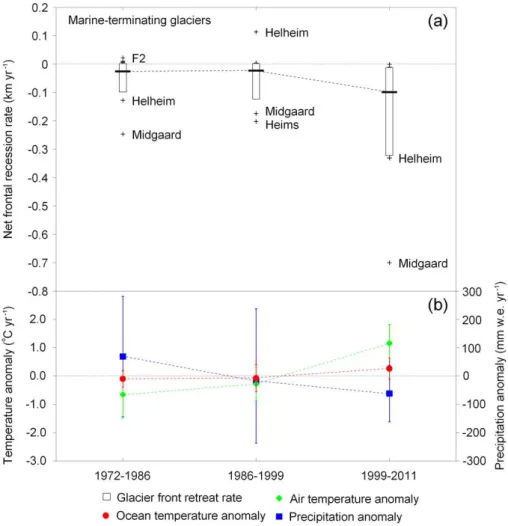
Fig. 5. (a) Box plots of frontal-position change for the sample 21 marine-terminating glaciers in the Ammassalik region with measurements
in each of the 1972–1986, 1986–1999, and 1999–2011 survey periods. The edges of the boxes denote 25 % and 75 % percentiles and the vertical line mean. Data points outside this range are considered outliers and are plotted as crosses and labeled; (b) mean annual air temperature anomaly (observed at the DMI meteorological station in Tasiilaq), mean annual ocean water temperature anomaly at 400 m depth in the Irminger Sea (Johannessen et al., 2011), mean annual precipitation anomaly (uncorrected) (observed at the DMI meteorological station in Tasiilaq) and standard deviations are shown.
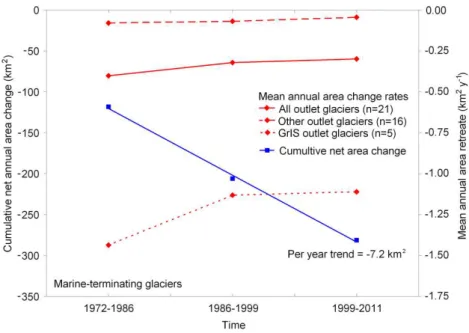
4 km2 during the period 1972–2011. Also, the 21 ob-served marine-terminating glaciers had a trend towards lower annual area loss rates (Fig. 6): for the sub-periods 1972–1986, 1986–1999, and 1999–2011, the mean area loss rates were 8.5 km2yr−1 (equal to 118 km2 and 0.40 km2yr−1glacier−1), 6.8 km2yr−1 (88 km2 and 0.32 km2yr−1glacier−1), and 6.3 km2yr−1 (75 km2 and 0.30 km2yr−1glacier−1), respectively (Fig. 6), indicating decreasing area loss rates since 1972. This is probably be-cause the side fjords to the Sermilik Fjord decreased in width the further up the fjord the marine-terminating moves. When looking at the mean GrIS outlet glaciers (Midgaard, Helheim, Tasis Sassik Fjord, Heims, and Fenris (n=5)) and the non-GrIS outlet glaciers (n=16), they both had a mean trend towards lower annual area loss rates (Fig. 6); however, the absolute mean area loss rates were higher for the GrIS outlet
glaciers. This suggests that outlet glaciers without deep beds are retreating far more slowly.
Box and Decker (2011) measured area change at 39 of the widest GrIS marine-terminating glaciers based on Mod-erate Resolution Imaging Spectroradiometer (MODIS) be-tween 2000 and 2010, including the glaciers Midgaard, Hel-heim, and Fenris. Overall for the 39 glaciers, they exposed a cumulated net area of 1368 km2. On individual glacier scale, the observed area loss rates for the glaciers Midgaard, Helheim, and Fenris were −2.9, −2.0, and −0.4 km2yr−1 for 1999–2011, respectively, compared to −3.6, −2.5, and
Fig. 6. Mean annual area change rates and cumulative net area change for all 21 marine-terminating glaciers, the five GrIS outlet glaciers,
and other sixteen outlet glaciers for the Ammassalik region 1972–2011.
Fjord, even compared with the entire Southeast Greenland according to Box and Decker (2011).
Several authors (e.g., Holland et al., 2008; Murray et al., 2010; Straneo et al., 2010; Andresen et al., 2011) suggest that ocean warming and warm subsurface waters caused large changes to submarine melting, marine-terminating glacier frontal positions and thinning, reduced resistive stress and ice discharge acceleration. In recent decades the 21 marine-terminating glaciers in the Ammassalik region have experi-enced increasing frontal recession rates and decreasing area exposure rates that are synchronous with both increasing mean annual air temperature (MAAT) (∼0.06◦C yr−1, sig-nificant atp <0.01, wherep is level of significance) from the DMI meteorological station in Tasiilaq and reconstructed annual ocean water temperature (∼0.12◦C yr−1, significant p <0.025; at 400 m depth in the Irminger Sea penetrat-ing into the Sermilik Fjord and expospenetrat-ing the lower part of glaciers such as Helheim and Fenris to warm waters with temperatures up to 4◦C; Johannessen et al., 2011) (Figs. 5b and 6). The mean glacier retreat was more widespread for 1999–2011 (approximately the first decade of the 21st cen-tury) than for the earlier sub-periods (1972–1986 and 1986– 1999). The observed accelerated recession of the marine-terminating glaciers in the Ammassalik region coincided with the onset of a warming trend in the sub-polar North Atlantic Ocean (Myers et al., 2007; Straneo et al., 2010), likely initiated by the influx of warmer deep water origi-nating in the Irminger Sea (Holland et al., 2008; Hanna et al., 2009). This supports the hypothesis that ocean warm-ing associated with shifts in the Irmwarm-inger and East Green-land currents caused increasing submarine melt at the ice-ocean interface, and retreat, thinning, and acceleration as the
loss of resistive stress at the terminus recedes (Joughin et al., 2010). However, oceanographic studies have demonstrated that although subtropical ocean waters reach glacial fjords in Southeast Greenland, there is no proof that they come into direct contact with glaciers (Walsh et al., 2012). Mechanisms driving the circulation of warmer North Atlantic waters are, however, still not well understood (e.g., Straneo et al., 2010). On the other hand, Johannessen et al. (2011) have argued (due to statistical correlation) that, based on annual frontal positions of Helheim Gletscher, 24 % of the ice-front fluc-tuations could be accounted for by ocean temperatures and 56 % by air temperatures, even though changes in frontal po-sitions were influenced by a number of local factors, e.g., up-glacier ice dynamics and bed geometry. Overall, several studies using a range of different methods show that GrIS marine-terminating glaciers recede and mass loss might be influenced by atmospheric and probably more importantly by oceanographic impacts, especially in the southeastern part of the GrIS (Luthcke et al., 2006; Velicogna and Wahr, 2006; van den Broeke, 2009; Velicogna, 2009).
3.2 The land-terminating ice sheet
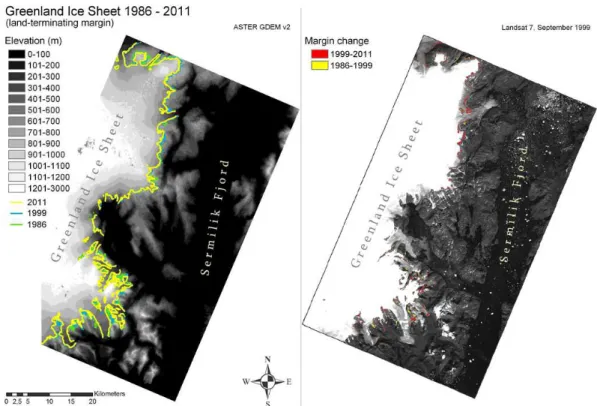
Fig. 7. The location of the GrIS land-terminating margin for the survey years 1986 (green), 1999 (blue), and 2011 (yellow) in the Ammassalik
region, and the marginal changes between the survey years. The topography has black and gray shaded colors (source: ASTER GDEM v2 and Landsat 7).
Table 3. GrIS land-terminating margin-position change rate statistics for each survey year and period for the Ammassalik region.
Years GrIS margin length
for the highlighted section in Ammassa-lik region (km)
GrIS area for the sec-tion for the highlighted section in Ammassalik region (km2)
Area in percentage related to the 1986 area (%)
1986 686 1166 100
1999 589 1153 99
2011 544 1124 96
GrIS mean margin change rate (km yr−1)
GrIS mean margin change (km)
1986–1999 −0.010 −0.127
1999–2011 −0.026 −0.316
1986–2011 −0.018 −0.443
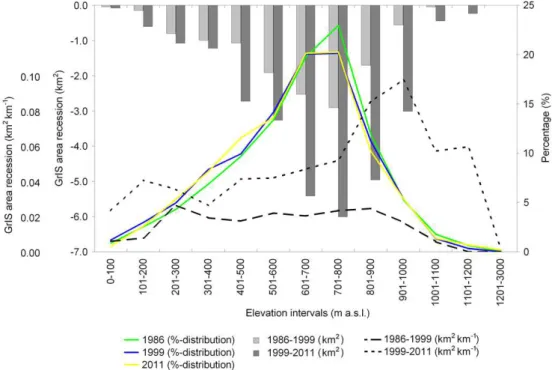
respectively, indicating an increasing trend in area expo-sure since 1986. The land-terminating area expoexpo-sure was unevenly distributed for the GrIS (Fig. 7). A division of the ice sheet into 100-m elevation bands indicated that the largest GrIS area recession occurred at the elevation be-tween 701–800 m a.s.l. for both survey periods, with rates of 0.22 km2yr−1(1986–1999) and 0.50 km2yr−1(1999–2011) (Figs. 7 and 8). Along with this area reduction, the GrIS land-terminating margin decreased ∼20 % in total length from 686 km (1986) to 544 km (2011), because the 2011 margin
Fig. 8. GrIS land-terminating area recession rates for different elevation intervals, Ammassalik region, for the sub-periods 1986–1999 (light
gray) and 1999–2011 (dark gray), area recession rate related to changes in margin length for 1986–1999 (black dashed line, long dashed) and 1999–2011 (black dashed line, short dashed), and the percentage of margin elevation for the different elevation intervals for the years 1986 (green), 1999 (blue), and 2011 (yellow) (see Fig. 7 for location of the margin).
where the net mass balance is zero), and the margin eleva-tion distribueleva-tion, where approximately 20 % of the margin was located between 701–800 m a.s.l. (1986–2011) (Fig. 8).
The mean net recession rate of the GrIS land-terminating margin was 0.018±0.009 km yr−1(equal to a net recession of 0.443 km) for 1986–2011, comprised of a mean reces-sion rate of 0.010 km yr−1 (0.127 km) for 1986–1999, and 0.026 km yr−1 (0.316 km) for 1999–2011 (Table 3). This land-terminating recession rate for the GrIS over this pe-riod of 1986–2011 is about three times lower the mean rate of recession of the marine-terminating GrIS. Sohn et al. (1998) measured recession rates of the GrIS land-terminating margin near Jakobshavn Isbræ, West Greenland, of 0.016–0.040 km yr−1, averaging 0.026 km yr−1for 1962– 1992. This may suggest that the recession rate can be ex-pected to be within this order of magnitude along many parts of the GrIS land-terminating margin.
Net GrIS land-terminating marginal recession for the Am-massalik region, including increasing area exposure, oc-curred for the period 1972–2011, during a period of in-creasing MAAT (∼0.06◦C yr−1)and decreasing annual pre-cipitation (−7.0 mm water equivalent (w.e.) yr−1, significant at p <0.025; Fig. 5b) – probably heading towards future warmer and drier conditions in the region (Mernild et al., 2011a). The average increase in MAAT generally favors sur-face ablation (evaporation, sublimation, and melt), and an earlier start of the ablation season by decreasing the “cold
content” of the snowpack (Bøggild et al., 2005; Mernild et al., 2011a), whereas a decrease in annual precipitation may lead to earlier exposure of glacier ice melt and summer firn surface of previous years (having a lower albedo than fresh snow, promoting increased solar absorption). Therefore, the combination of increasing air temperature and decreasing precipitation is likely to increase ablation and GrIS margin thinning and recession, and if MAAT and precipitation con-tinue to follow these trends, then it is expected that the GrIS land-terminating margin will continue its recession, leading to increased area exposure. However, changes in the hypso-metric distribution along the GrIS margin may influence re-cession rates on a decadal timescale.
3.3 Land-terminating glaciers and ice caps
Fig. 9. Distribution of the 35 observed land-terminating GIC: (a) size; (b) mean elevation; and (c) aspect.
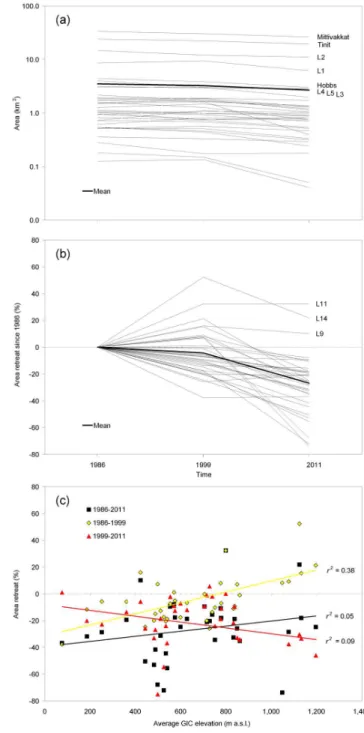
(or 1.07 % yr−1per glacier) (Fig. 10a and b). For small GIC (n=32;<10 km2), the net area exposure rate was on aver-age 1.08 % yr−1, and for large GIC (n=3;>10 km2)was a comparable rate of 0.81 % yr−1. For 1986–1999, eleven individual GIC (around 30 %, mostly below 2 km2) had a net increase in area, while for 1986–2011 there were only three GIC all facing towards the west (L11, L14, and L9; and around 10 % – all less than 1 km2) (Fig. 10b). As il-lustrated in Fig. 10c, GIC having a mean elevation height higher than 705 m a.s.l. had in general a net area increase from 1986 to 1999, while glaciers with a mean elevation lower than 705 m a.s.l. had a net area decrease (based on the significant linear regression;r2=0.38;p <0.01). The height of 705 m a.s.l. was around the observed average ELA of 690 m a.s.l. at the Mittivakkat Gletscher in the late 1990s (Knudsen and Hasholt, 2004; Mernild et al., 2011a; Table 2).
Fig. 10. (a) Land-terminating GIC area for the 35 observed GIC
(Mittivakkat, Hobbs, Tinit, and L1–L32 glaciers) for 1986, 1999, and 2011 (the listed glaciers are illustrated as an example in Fig. 11); (b) relative GIC area change since 1986 (the named glaciers are the ones with area increase); and (c) relative GIC area change in relation to variations in mean elevation GIC height for 1986–1999, 1999–2011, and overall for 1986–2011.
Table 4. Characteristics of land-terminating GIC L33–L37 in the Ammassalik region, which have melted away during the period 1986–2011
(see Fig. 1 for location of the doomed glaciers).
GIC Minimum elevation (m a.s.l.) Maximum elevation (m a.s.l.) Mean elevation (m a.s.l.) Aspect Area 1986 (km2)
Area 1999 (km2)
Area 2011 (km2)
L33 507 792 634 E 0.178 0.050 0
L34 462 538 513 E 0.041 0.034 0
L35 846 910 893 W 0.036 0 0
L36 777 896 841 W 0.076 0.016 0
L37 1107 1145 1117 SW 0.018 0.029 0
Mittivakkat Gletscher to 750 m a.s.l. Overall for 1986–2011, the observed GIC faced a general net area loss that was high-est at low elevations, and vice versa (based on the linear re-gression; Fig. 10c). However, as previous mentioned, three minor GIC (<1 km2)had a net area gain during this 25-yr period, indicating that glacier fluctuations may vary on local scales.
Since the GIC on average had a mean net area exposure rate of about 1 % yr−1, it may be expected that GIC in the Ammassalik region could melt substantially in the 21st cen-tury under ongoing climate change. For the period 1986– 2011, there are examples of five glaciers that completely melted away: all located at different mean elevations within the region from 460 to 1110 m a.s.l., and with different as-pects facing from east to west (Table 4). The recession seems therefore not to be limited to low elevated areas only, but more likely to occur for north-facing GIC. Also, in Fig. 11, examples of eight GIC are shown to illustrate the spatial changes in margin location from 1986 to 2011.
For the largest GIC – the Mittivakkat Gletscher (26.2 km2 in 2011) – the area extent had diminished about 18 % since 1986 (lower than the mean GIC area exposure for the Am-massalik region of 27±24 %). The terminus has retreated by 1.6 km (0.015 km yr−1) since the maximum extent of the Little Ice Age around 1900, by 1.3 km (0.017 km yr−1) since 1931 (Humlum and Christiansen, 2008; Mernild et al., 2011a), and by 0.3 km (0.013 km yr−1) since 1986. This is almost of the same magnitude as the GIC of the Ammassalik region’s mean net recession rate of 0.010±
0.006 km yr−1(1986–2011), and of the regional GrIS land-terminating margin of 0.018±0.009 km yr−1(see Sect. 3.2): the mean Ammassalik GIC land-terminating recession rate (1986–2011) is about five times lower than the mean GrIS marine-terminating recession rate. Also, for Mittivakkat Gletscher the annual mass balance measured continuously since 1995/1996 illustrates a 16-yr average mass loss of 0.970±0.190 m w.e. yr−1, and an accumulation-area ratio (AAR: the ratio of the accumulation area to the area of the entire glacier) of∼0.10 (updated from Mernild et al., 2011a), indicating that the glacier is significantly out of balance with the current climate. The glacier will likely lose at least 70 % of its current area extent and 80 % of its volume even in the
absence of further climate changes (Mernild et al., 2011a). Since the initiation of the mass balance observation program in 1995/1996, Mittivakkat Gletscher had in 14 out of 16 yr a negative surface mass balance, while the general climatic trend in the region has been towards higher temperatures, less winter precipitation, and more negative glacier mass balances and continuous marginal recession (Fig. 11). Consecutive record glacier mass loss occurred for the years 2009/2010 and 2010/2011 of−2.16 and−2.45 m w.e. yr−1, respectively. The 2011 mass loss was not only the largest annual loss of volume in the history of the mass balance observational pro-gram, but also the largest annual loss in simulations of glacier mass balance changes back to 1898 (Mernild et al., 2008). The marginal recession, mass balance and AAR observations suggest that recent Mittivakkat mass losses, which have been driven largely by higher surface temperatures and less solid precipitation, are representative of the broader region, which includes the 35 observed GIC in Figs. 10 and 11 – glaciers of different sizes and elevation ranges. This is confirmed since the Mittivakkat Gletscher net area exposure rate closely fol-lows the average rates for the Ammassalik region.
Glacier fluctuations and area exposure have been studied in other parts of Greenland. North of the Ammassalik re-gion, in central East Greenland (68–72◦N) land-terminating GIC peripheral to the GrIS have receded at a mean rate of 0.010 km yr−1for a wide range of glacier sizes (2002–2009) (Kargel et al., 2012). Also, on Disko Island in West Green-land, Yde and Knudsen (2007) estimated mean GIC termi-nus retreat rates of 0.008 km yr−1for non-surging GIC, and 0.020 km yr−1 for quiescent phase surge-type GIC, reflect-ing a higher non-climatic-driven recession rate after glacier surges. These studies are in accordance with the findings for the Ammassalik region and indicate that the current mean re-cession rate for GIC in Greenland (probably excluding North Greenland where no data are currently available) is likely to be on the order of 0.008–0.010 km yr−1.
4 Summary and conclusion
Fig. 11. The margin location of eight land-terminating GIC (peripheral to the GrIS) in the Ammassalik region: Hobbs, Mittivakkat, Tinit,
GrIS, and terminating GIC. However, the land-terminating GrIS and GIC reflect slower area exposure rates than the faster marine-terminating outlet glaciers. This could likely be due to a combination of effects, as the marine-terminating GrIS was influenced by the onset of a sea-water warming trend in the North Atlantic Ocean (Myers et al., 2007; Straneo et al., 2010), and by atmospheric impacts from regional trends in MAAT and precipitation, while GIC were only influenced by the latter. For the marine-terminating GrIS outlet glaciers the mean annual area exposure rate has decreased since 1972, whereas it has increased for the land-terminating GrIS margin since 1986, even though both parts of the GrIS have undergone substantial area changes in the past decades. The observed land-terminating GrIS and GIC indicate a net area recession of 4 % (equal to an area expo-sure rate of 0.15 % yr−1)and 27±24 % (around 1 % yr−1), respectively, and margin recession rates of 0.018±0.009 and 0.010±0.006 km yr−1. These mean net margin recession rates are about three to five times lower than the GrIS marine-terminating margin rates. If these GIC recession trends were extrapolated, it would indicate that a substantial amount of the GIC in the Ammassalik region might melt away within the 21st century under ongoing climate warming. So far, five GIC in the Ammassalik region have melted away since 1986.
Acknowledgements. The authors thank Matthew Hecht, Mauri Pelto, and the anonymous reviewers for their insightful review of this paper. We also thank Ola M. Johannessen for providing the reconstructed ocean water data. This work was partly supported by the Earth System Modeling program and by the Scientific Discovery for Advanced Computing (SciDAC) program within the US Department of Energy’s Office of Science and by a Los Alamos National Laboratory (LANL) Director’s Fellowship. LANL is operated under the auspices of the National Nuclear Security Administration of the US Department of Energy under Contract No. DE-AC52-06NA25396), and partly from the European Com-munity’s Seventh Framework Programme under grant agreement No. 262693. S. H. M. and J. K. M. compiled the satellite images, analyzed the data, and wrote the manuscript. J. C. Y. and N. T. K. contributed to the discussion of results and writing of the text.
Edited by: E. Hanna
References
Andresen, C. S., Straneo, F., Riebergaard, M. H., Bjørk, A. A., An-dersen, T. J., Kuijpers, A., Nørgaard-PeAn-dersen, N., Kjær, K. H., Schjøth, F., Weckstrom, K., and Ahlstrøm A. P.: Rapid response of Helheim Glacier in Greenland to climate variability over the past century, Nat. Geosci., 5, 37–41, doi:10.1038/NGEO1349, 2011.
Box, J. E. and Decker, D. T.: Greenland marine-terminating glacier area changes: 2000–2010, Ann. Glaciol., 52, 91–98, 2011. Bøggild, C. E., Forsberg, R., and Reeh, N.: Melt: Water in a transect
across the Greenland ice sheet, Ann. Glaciol., 40, 169–173, 2005.
Dozier, J. and Warren, S. G.: Effect of viewing Angle on the Infrared Brightness Temperature of Snow, Water Resour. Res., 18, 1424– 1434, 1982.
Earth Observing System Data and Information System (EOSDIS): Earth Observing System ClearingHOuse (ECHO)/Warehouse In-ventory Search Tool (WIST) Version 10.X. Greenbelt, MD: EOSDIS, Goddard Space Flight Center (GSFC) NASA, 2009. Gao, B.-C.: NDWI – A Normalized Difference Water Index for
Re-mote Sensing of Vegetation Liquid Water From Space, ReRe-mote Sens. Environ., 58, 257–266, 1996.
Hanna, E., Cappelen, J., Fettweis, X., Huybrechts, P., Luckman, A., and Ribergaard, M. H.: Hydrologic response of the Greenland ice sheet: the role of oceanographic warming, Hydrol. Process., 23, 7–30, 2009.
Holland, D. M., Thomas, R. H., de Young, B., Ribergaard, M. H., and Lyberth, B.: Acceleration of Jakobshavn Isbrae triggered by warm subsurface ocean waters, Nat. Geosci., 1, 659–662, 2008. Howat, I. M. and Eddy, A.: Multi-decadal retreat of Greenland’s
marine-terminating glaciers, J. Glaciol., 57, 389–396, 2011. Howat, I. M., Joughin, I., Tulaczyk, S., and Gogineni, S.: Rapid
re-treat and acceleration of Helheim Glacier, East Greenland, Geo-phys. Res. Lett., 32, L22502, doi:10.1029/2005GL024737, 2005. Howat, I. M., Joughin, I., and Scambos, T. A.: Rapid Changes in Ice Discharge from Greenland Outlet Glaciers, Science, 315, 1559– 1561, 2007.
Howat, I. M., Joughin, I., Fahnestock, M., Smith, B. E., and Scam-bos, T.: Synchronous retreat and acceleration of southeast Green-land outlet glaciers 2000–2006: ice dynamic and coupling to cli-mate, J. Glaciol., 54, 646–660, 2008.
Humlum, O. and Christiansen, H. H.: Geomorphology of the Am-massalik Island, SE Greenland, Geogr. Tidssk., 108, 5–20, 2008. Jiskoot, H., Murray, T., and Luckman, A.: Surge potential and drainage-basin characteristics in East Greenland, Ann. Glaciol., 36, 142–148, 2003.
Johannessen, O. M., Korablev, A., Miles, V., Miles, M. W., and Sol-berg, K. E.: Interaction Between the Warm Subsurface Atlantic Water in the Sermilik Fjord and Helheim Glacier in Southeast Greenland, Surv. Geophys, 32, 387–396, doi:10.1007/s10712-011-9130-6, 2011.
Joughin, I., Abdalati, W., and Fahnestock, M. A.: Large fluctuations in speed on Greenland’s Jakobshavn Isbrae glacier, Nature, 432, 608–610, 2004.
Joughin, I., Smith, B. E., Howat, I. M., Scambos, T., and Moon, T.: Greenland Flow variability from ice-sheet-wide velocity map-ping, J. Glaciol., 56, 415–430, 2010.
Knudsen, N. T. and Hasholt, B.: Mass balance observations at Mitti-vakkat Glacier, southeast Greenland 1995–2002, Nord. Hydrol., 35, 381–390, 2004.
Kargel, J. S., Ahlstrøm, A. P., Alley, R. B., Bamber, J. L., Benham, T. J., Box, J. E., Chen, C., Christoffersen, P., Citterio, M., Cogley, J. G., Jiskoot, H., Leonard, G. J., Morin, P., Scambos, T., Shel-don, T., and Willis, I.: Brief communication Greenland’s shrink-ing ice cover: “fast times” but not that fast, The Cryosphere, 6, 533–537, doi:10.5194/tc-6-533-2012, 2012.
Mernild, S. H., Kane, D. L., Hansen, B. U., Jakobsen, B. H., Hasholt, B., and Knudsen, N. T.: Climate, glacier mass balance, and runoff (1993–2005) for the Mittivakkat Glacier catchment, Ammassalik Island, SE Greenland, and in a long term perspec-tive (1898–1993), Hydrol. Res., 39, 239–256, 2008.
Mernild, S. H., Knudsen, N. T., Lipscomb, W. H., Yde, J. C., Malm-ros, J. K., Hasholt, B., and Jakobsen, B. H.: Increasing mass loss from Greenland’s Mittivakkat Gletscher, The Cryosphere, 5, 341–348, doi:10.5194/tc-5-341-2011, 2011a.
Mernild, S. H., Mote, T., and Liston, G. E.: Greenland Ice Sheet surface melt extent and trends, 1960–2010, J. Glaciol., 57, 621– 628, 2011b.
Mernild, S. H., Hanna, E., Knudsen, N. T., Yde, J. C., and Sei-denkrantz, M.-S.: The climate impact on observed land terminat-ing glaciers and ice caps in Northern North Atlantic, J. Climate, in review, 2012.
Moon, T. K. and Joughin, I.: Retreat and advance of Greenland tide-water glaciers from 1992 to 2007, J. Geophys. Res., 113, F02022, doi:10.1029/2007JF000927, 2008.
Myers, P., Kulan, N., and Ribergaard, M. H.: Irminger Water vari-ability in the West Greenland Current, Geophys. Res. Lett., 34, L17601, doi:10.1029/2007GL030419, 2007.
Murray, T., Scharrer, K., James, T. D., Dye, S. R., Hanna, E., Booth, A. D., Selmes, N., Luckman, A., Hughes, A. L. C., Cook, S., and Huybrechts, P.: Ocean regulation hypothesis for glacier dynamics in southeast Greenland and implications for ice sheet mass changes, J. Geophys. Res., 115, F03026, doi:10.1029/2009JF001522, 2010.
Nick, F., Vieli, M. A., Howat, I. M., and Joughin, I.: Large-scale changes in Greenland outlet glacier dynamics trigged at the ter-minus, Nat. Geosci., 2, 110–114, doi:10.1038/NGEO394, 2009. Paul, F.: The New Swiss Glacier Inventory 2000 – Application of
remote sensing and GIS, Ph.D. thesis, Department of Geography, University of Zurich, 198 pp., 2004.
Radi´c, V. and Hock, R.: Regionally differentiated contribution of mountain glaciers and ice caps to future sea-level rise, Nat. Geosci., 4, 91–94, 2011.
Rignot, E. and Kanagaratnam, P.: Changes in the velocity structure of the Greenland Ice Sheet, Science, 311, 986–990, 2006. Rignot E., Knoppes, M., and Velicogna, I.: Rapid submarine
melt-ing of the calvmelt-ing faces of West Greenland glaciers, Nat. Geosci., 3, 187–191, 2010.
Rouse, J. W., Haas, R. H., Schell, J. A., and Deering, D. W.: Mon-itoring vegetation systems in the Great Plains with ERTS, Third ERTS Symposium, NASA SP-351, I, 309–317, 1973.
Sohn, H.-G., Jezek, K. C., and van der Veen, C. J.: Jakobshavn Glacier, West Greenland: 30 years of spaceborne observations, Geophys. Res. Lett., 25, 2699–2702, 1998.
Straneo, F., Hamilton, G. S., Sutherland, D. A., Sterns, L. A., David-son, F., Hammill, M. O., StenDavid-son, G. B., and Rosing-Asvid, A.: Rapid circulation of warm subtropical waters in a major glacial fjord in East Greenland, Nat. Geosci., 3, 182–222, 2010. Tachikawa, T., Kaku, M., Iwasaki, A., Gesch, D., Oimoen,
M., Zhang, Z., Danielson, J., Krieger, T., Curtis, B., Haase, J., Abrams, M., Crippen, R., and Carabajal, C.: ASTER Global Digital Elevation Model Version 2 – Summary of Validation Results, NASA Land Processes Distributed Ac-tive Archive Center and the Joint Japan-US ASTER Sci-ence Team (https://igskmncnwb001.cr.usgs.gov/aster/GDEM/ Summary GDEM2 validation report final.pdf), 2011.
Thomas, R., Frederick, E., Krabill, W., Manizade, S., and Martin, C.: Recent changes on Greenland outlet glaciers, J. Glaciol., 55, 147–162, 2009.
Truffer, M. and Fahnestock, M.: Rethinking ice sheet time scales, Science, 315, 1508–1510, 2007.
van den Broeke, M., Bamber, J., Ettema, J., Rignot, E., Schrama, E., van de Berg, W., van Meijgaard, E., Velicogna, I., and Wouters, B.: Partitioning Recent Greenland Mass Loss, Science, 326, 984– 986, 2009.
Velicogna, I.: Increasing rates of ice mass loss from the Green-land and Antarctic ice sheets revealed by GRACE, Geophys. Res. Lett., 36, L19503, doi:10.1029/2009GL040222, 2009.
Velicogna, I. and Wahr, J.: Acceleration of Greenland ice mass loss in spring 2004, Nature, 443, 329–331, 2006.
Walsh, K. M., Howat, I. M., Ahn, Y., and Enderlin, E. M.: Changes in the marine-terminating glaciers of central east Greenland, 2000–2010, The Cryosphere, 6, 211–220, doi:10.5194/tc-6-211-2012, 2012.
WGMS: Glacier Mass Balance Bulletin, Bulletin No.
10 (2006–2007), edited by: Haeberli, W.,
Gartner-Roer, I., Hoelzle, M., Paul, F., and Zemp, M.,
ICSU(WDS)/IUGG(IACS)/UNEP/UNESCO/WMO, World
Glacier Monitoring Service, Zurich, 96 pp., 2009.