TCD
6, 4417–4446, 2012Multi decadal glacier area fluctuations
S. H. Mernild and J. K. Malmros
Title Page
Abstract Introduction
Conclusions References
Tables Figures
◭ ◮
◭ ◮
Back Close
Full Screen / Esc
Printer-friendly Version
Interactive Discussion
Discussion
P
a
per
|
Dis
cussion
P
a
per
|
Discussion
P
a
per
|
Discussio
n
P
a
per
|
The Cryosphere Discuss., 6, 4417–4446, 2012 www.the-cryosphere-discuss.net/6/4417/2012/ doi:10.5194/tcd-6-4417-2012
© Author(s) 2012. CC Attribution 3.0 License.
The Cryosphere Discussions
This discussion paper is/has been under review for the journal The Cryosphere (TC). Please refer to the corresponding final paper in TC if available.
Multi decadal glacier area fluctuations in
Pan-Arctic
S. H. Mernild1and J. K. Malmros2
1
Climate, Ocean, and Sea Ice Modeling Group, Los Alamos National Laboratory, New Mexico, USA
2
Centro de Estudios Científicos (CECs), Valdivia, Chile
Received: 30 August 2012 – Accepted: 9 October 2012 – Published: 16 October 2012
Correspondence to: S. H. Mernild ([email protected])
TCD
6, 4417–4446, 2012Multi decadal glacier area fluctuations
S. H. Mernild and J. K. Malmros
Title Page
Abstract Introduction
Conclusions References
Tables Figures
◭ ◮
◭ ◮
Back Close
Full Screen / Esc
Printer-friendly Version
Interactive Discussion
Discussion
P
a
per
|
Dis
cussion
P
a
per
|
Discussion
P
a
per
|
Discussio
n
P
a
per
|
Abstract
The shrinking of land-terminating glaciers and ice caps (GIC) has been documented in high-latitude regions, even though repeat observations upon which to base such stud-ies have been limited in space. Here, we present a new record of satellite-derived area changes for 321 land-terminating GIC throughout Pan-Arctic and for the W. Canada
5
and W. US, with focus on the period from mid-1980s to late-2000s/2011 (the last ca. 25 yr). The mean shrinking rate was −0.06±0.01 km2yr−1 during a period with
climate warming. Most of the observed GIC shrank in area, more so than previously believed: while only 8 % advanced. The analysis indicates that the observed GIC have lost an arithmetic average of one-fifth of their area since the mid-1980s (equal to a
10
shrinking rate of ca.−1 % yr−1), with the highest rate of loss of−40±4 % (−1.7 % yr−1)
in Alaska, and the lowest rate of loss of−12±3 % (−0.5 % yr−1) in Arctic Russia.
1 Introduction
Land-terminating glaciers and ice caps (henceforth GIC) excluding the Greenland Ice Sheet (GrIS) and the Antarctic Ice Sheet (AIS) are tracers of climate warming, as air
15
temperature and precipitation changes control the surface mass balance, and subse-quently the volume and area exposure (Kaser et al., 2006; Bloch et al., 2010; Bjork et al., 2012; Cogley, 2012; Mernild et al., 2012a). The average rise in air temper-ature of recent decades has been more pronounced at high latitudes than globally (Hansen et al., 2010), resulting in thinning and shrinking of GIC (Meier et al., 2007;
20
Bahr et al., 2009; Dyurgerov, 2010; WGMS, 2011). Even without additional warming, land-terminating GIC will lose an estimated 30±5 % of their area to reach equilibrium
with the climate of the past decade, due to the delayed response of GIC to climate warming (Mernild et al., 2012a).
Around half of the estimated GIC surface area and two-third of its volume are found
25
TCD
6, 4417–4446, 2012Multi decadal glacier area fluctuations
S. H. Mernild and J. K. Malmros
Title Page
Abstract Introduction
Conclusions References
Tables Figures
◭ ◮
◭ ◮
Back Close
Full Screen / Esc
Printer-friendly Version
Interactive Discussion
Discussion
P
a
per
|
Dis
cussion
P
a
per
|
Discussion
P
a
per
|
Discussio
n
P
a
per
|
map the relation between GIC changes and on-going climate warming, following the warmest decade (2001–2010) on record (Hansen et al., 2010). Currently, GIC retreat and mass loss are raising the eustatic global sea-level by approximately 1 mm yr−1, in the same range as the combined GrIS and AIS sea-level contribution (Meier et al., 2007; Radićand Hock, 2011).
5
Time series of frontal position and area of GIC have become far more extensive in the satellite era (Yde and Knudsen, 2007; Bjork et al., 2012; Bloch et al., 2012; Cog-ley, 2012; Mernild et al., 2012b). Only a small fraction of the Pan-Arctic’s GIC has been directly observed in-situ, even though thousands of individual GIC are located in the Arctic (Weidick et al., 1992). There is a need for information about contemporary GIC
10
area fluctuations and their correspondence with climate. Recent analyses (Yde and Knudsen, 2007; Kaser et al., 2006; Bloch et al., 2010; Bjork et al., 2012; Cogley 2012; Kargel et al., 2012; Mernild et al., 2012b) of GIC fluctuations and area exposures in Pan-Arctic, e.g., in W. and SE. Greenland and W. Canada and W. US, based on histori-cal accounts and aerial and satellite images of the late twentieth century and to present,
15
have suggested that the GIC area shrinking rate on average is−0.04 km2yr−1, or−0.1
to−0.5 % yr−1and up to−1 % yr−1comparable to rates reported for high-latitude
moun-tain ranges (Bloch et al., 2010).
Here, for the period mid-1980s to late-2000s/2011 we examine net area fluctuations and shrinking rates using multispectral Landsat satellite data for 321 land-terminating
20
GIC, divided into seven (first-order) glaciated regions: Alaska, W. Canada and W. US, Arctic Canada, Greenland, Scandinavia, Arctic Russia, and N. and E. Asia, and further divided into 12 sub-regions. Area changes were considered in the context of observed air temperature time series. Finally, we investigate differences in GIC initial area versus GIC area change, and we calculate the percentage of area advancing GIC.
TCD
6, 4417–4446, 2012Multi decadal glacier area fluctuations
S. H. Mernild and J. K. Malmros
Title Page
Abstract Introduction
Conclusions References
Tables Figures
◭ ◮
◭ ◮
Back Close
Full Screen / Esc
Printer-friendly Version
Interactive Discussion
Discussion
P
a
per
|
Dis
cussion
P
a
per
|
Discussion
P
a
per
|
Discussio
n
P
a
per
|
2 Methods and data set 2.1 The satellite method
The satellite-derived GIC planimetric area data set was obtained from high spatial
res-olution Landsat-5 TM (Thematic Mapper) and Landsat-7 ETM+(Enhanced Thematic
Mapper Plus) imagery from 28 scenes, having a ground resolution of 30 m (Table 1).
5
The satellite data set was: (1) obtained from a pair of Landsat scenes covering the same region, recorded at least ten years apart and with end scenes obtained no ear-lier than 2003 (within the last decade); (2) acquired during the end-of the ablation season, typically from end-of July through end-of September, to minimize snow-cover interference (only GIC larger than 0.028 km2were mapped to avoid snow patches to be
10
included in the data set); (3) obtained from cloud-free areas, on scenes with less than 50 % cloud-cover; (4) visually inspected before use in the supervised classification pro-cess to avoid misclassification caused by heavy snow covered scenes; (5) when using Landsat-7 ETM+(2003 to present) subject to the Scan Line Instrument (SLI) malfunc-tion, two (approximate same date) scenes were combined to replace gaps; and (6)
15
obtained where the SLI failure would not influence the GIC area estimation.
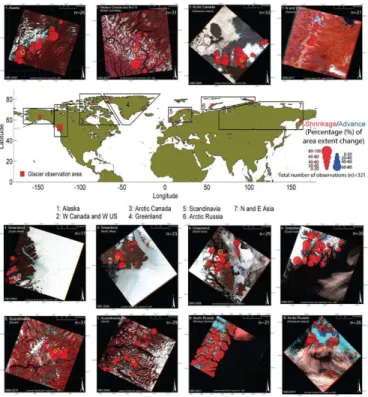
Data from twelve Pan-Arctic sub-regions were acquired (Fig. 1): however, not from Svalbard and Iceland due to the lack of scenes meeting the selection criteria. All the Landsat scenes were projected in World Geodetic System 1984 (WGS84), atmospher-ically and radiometratmospher-ically calibrated using the Landsat calibration tool in ENVI™
soft-20
ware package (http://www.ittvis.com/ProductServices/ENVI.aspx), converting the band values to “At Surface Reflectance”. The individual bands (TM and ETM+bands 1–5, and (7) were standardized using the ENVI™Dark Subtract (DS) tool before ratios and indices were calculated.
The supervised classification process used for the scenes was based on a
multi-25
TCD
6, 4417–4446, 2012Multi decadal glacier area fluctuations
S. H. Mernild and J. K. Malmros
Title Page
Abstract Introduction
Conclusions References
Tables Figures
◭ ◮
◭ ◮
Back Close
Full Screen / Esc
Printer-friendly Version
Interactive Discussion
Discussion
P
a
per
|
Dis
cussion
P
a
per
|
Discussion
P
a
per
|
Discussio
n
P
a
per
|
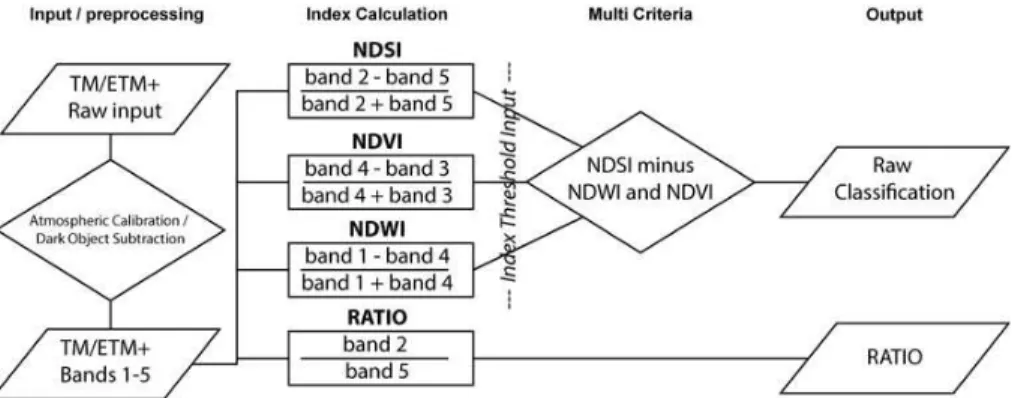
ENVI™software package): normalized difference snow index (NDSI) (Hall et al., 1995); normalized difference water index (NDWI) (Gao, 1996); normalized difference vege-tation index (NDVI) (Rouse et al., 1973); and Ratio TM/ETM+bands (3/5) (Visible light/Short Wave Infrared). The ratio introduced by Crane and Anderson (1984), and Dozier and Marks (1987). The ratio between bands 3 and 5 was found to produce
bet-5
ter contrast across the mountainous regions than the often applied TM/ETM+bands (2/5) ratio. The Ratio was used in reference due to better performance than the NDSI index in mountainous areas capturing ice and snow covered areas influenced by shad-ows and debris (Paul, 2004).
The NDVI was used to filter out vegetation and the NDWI to identify and filter out
10
lakes in the margin area of the GIC. The resulting classifications were converted to polygon files representing the GIC area, and where needed the extent were manually edited in ESRI™ ArcMap. For each GIC, the GIC margin positions were digitized for both the beginning and end of the observation period and the area shrinkage/advance rates were calculated. An example of GIC area estimations is illustrated in Fig. 3,
15
where the margin positions were digitized for a specific glacier for both 1986 and 2011 (ID # L29, SE. Greenland; the location of L29 can be seen in Mernild et al. (2012b; Fig. 1), and the shrinking rate calculated.
The indices threshold input values used in the individual classification scenes varied across the regions and years, as a result of the inherent reflective properties due to
20
changes in the surfaces structure over time. The individual threshold values were se-lected based on the best performance in identifying elements like snow/ice, vegetation, and water (NDSI: 0.4–0.5, NDVI: 0.25–0.35, NDWI: 0.2–0.5). As an example, changes in vegetation were due to both changes in seasonal and in regional variability, and for snow cover due to compaction and wetness (Brest, 1987; Hall et al., 2001), making it
25
TCD
6, 4417–4446, 2012Multi decadal glacier area fluctuations
S. H. Mernild and J. K. Malmros
Title Page
Abstract Introduction
Conclusions References
Tables Figures
◭ ◮
◭ ◮
Back Close
Full Screen / Esc
Printer-friendly Version
Interactive Discussion
Discussion
P
a
per
|
Dis
cussion
P
a
per
|
Discussion
P
a
per
|
Discussio
n
P
a
per
|
– For W. Canada and W. US, only GIC not interrupted by the gaps in the Landsat-7 scene was included.
– For Bolshevik Island, GIC influenced by the Landsat-7 gaps were carefully dig-itized, and finalized using visual interpretation based on the 1985 Landsat-5 scene. GIC ID # 1 was divided, due to extensive cloud cover, at the same
loca-5
tion in both scenes, therefore only representing the majority of the glacier.
– For Novaya Zemlya the 5 scene was warped in ArcMap to fit the Landsat-7 scene due to gaps in the classification (SLI failure) (of 1.2 m due to the root mean square (RMS), based on 26 ground control points (GCP)). The 1987 classification had the Landsat-7 gap area removed, so the GIC areas could be compared with
10
the 2011 classification.
– For NW. Greenland GIC ID # 23 was divided, due to the scene coverage, at the same location in both scenes (for 1987 and 2006), and therefore only representing most of the GIC within the scene.
2.2 Satellite uncertainties 15
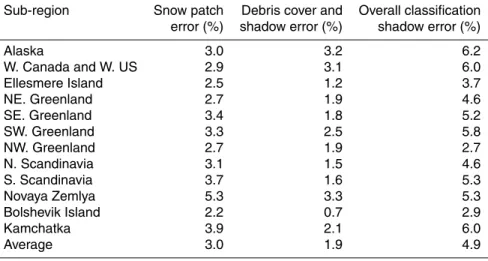
The overall raw classification errors (misclassifications) for each year were found by comparison with the cleaned up classification and estimated to be 4.9 % (overestimate by 3.0 % due to snow patches and underestimate by 1.9 % due to heavily debris cov-ered terrain and shadow regions) (Table 2). The highest error values were found in Alaska and W. Canada and W. US caused by shadow effects due to terrain elevations,
20
where the errors were underestimated by 3.1 % and 3.2 %, respectively. For both S. Scandinavia and Kamchatka it was due to snow patches, where the errors were over-estimated by 3.7 % and 3.9 %, respectively. Overall for troublesome regions Alaska, W. Canada and W. US, S. Scandinavia, and Kamchatka the classification error were 6.2, 6.0, 5.3, and 6.0 %, respectively. In Table 2 error values are listed for the individual
25
TCD
6, 4417–4446, 2012Multi decadal glacier area fluctuations
S. H. Mernild and J. K. Malmros
Title Page
Abstract Introduction
Conclusions References
Tables Figures
◭ ◮
◭ ◮
Back Close
Full Screen / Esc
Printer-friendly Version
Interactive Discussion
Discussion
P
a
per
|
Dis
cussion
P
a
per
|
Discussion
P
a
per
|
Discussio
n
P
a
per
|
Standard pixel errors associated with the different scenes and sensors in relation to the classification process was expected to be half the pixel size: ±15 m for both TM and ETM+(Table 1) (Hall et al., 2003; Mernild et al., 2012b). As a test e.g., the Landsat-derived Mittivakkat Gletscher margin, SE. Greenland, was validated against direct GPS margin observations from 2011, indicating an overall root mean square
5
(RMS) difference of 22 m between Landsat-7 satellite-derived and GPS margin obser-vations (Mernild et al., 2012b).
2.3 The data set
We have compiled a data set of Landsat satellite-derived planimetric area change for 321 land-terminating GIC in Pan-Arctic and for the W. Canada and W. US (henceforth
10
Pan-Arctic), between 52.4◦N and 89.3◦N latitude, from mid-1980s to late-2000s/2011: the compiled GIC area corresponds to 1 % of the estimated Pan-Arctic GIC area (Radić and Hock, 2010). The 321 GIC from the compiled data set were chosen to follow (sig-nificantly; herein the term “significantly” is only used for which the relationship is statis-tically significant at the 10 % level or better, based on a linear regression t-test) the area
15
GIC distribution found in the Randolph Glacier Inventory (RGI) v. 2.0 data set (between 52.4◦N and 89.3◦N latitude, and GIC larger than 0.028 km2) (Arendt et al., 2012) (see histogram in Fig. 4). Even though the compiled data set have a few percentage less small glaciers (<5 km2) and more large glaciers (>5 km2) compared to RGI, the
com-piled data set appears, due to the size distribution, to be representative for Pan-Arctic
20
GIC, where the smallest bins (below 5 km2) contain a non-trivial amount of the total GIC mass (Bahr and Radić, 2012).
The GIC were compiled from seven first-order regions for the period mid-1980s to late-2000s/2011: Alaska (GIC,n=26), W. Canada and W. US (31), Arctic Canada (32),
Greenland (104), Scandinavia (60), Arctic Russia (47), and N. and E. Asia (21) (for N.
25
TCD
6, 4417–4446, 2012Multi decadal glacier area fluctuations
S. H. Mernild and J. K. Malmros
Title Page
Abstract Introduction
Conclusions References
Tables Figures
◭ ◮
◭ ◮
Back Close
Full Screen / Esc
Printer-friendly Version
Interactive Discussion
Discussion
P
a
per
|
Dis
cussion
P
a
per
|
Discussion
P
a
per
|
Discussio
n
P
a
per
|
(Novaya Zemlya (21) and Bolshevik Island (26)), ending up in total with twelve Pan-Arctic sub-regions (the sub-regions are shown on Fig. 1 and Table 4). The exact ob-servation periods are illustrated on the first-order regional scale in Table 3. In Table 4 values are illustrated on sub-regional scale.
3 Results and discussion 5
3.1 GIC initial area versus GIC area change
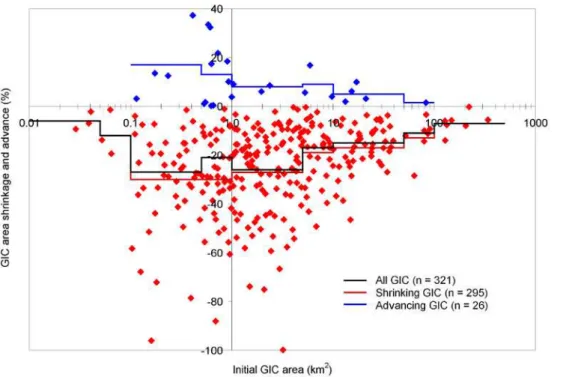
The compiled data set illustrates a significant trend (Fig. 4), where it can be concluded for both advancing (r2=0.56) and shrinking GIC (r2=0.75), that the largest observed
GIC (km2) are the ones having the greatest absolute advancing or shrinking area rates per year (km2yr−1): For the minor GIC this absolute trend is vice versa. The change in
10
area is influenced by the initial GIC size, where large GIC lost the highest absolute val-ues (Fig. 4) and small GIC lost the highest relative valval-ues (Fig. 5). Small GIC between 0.1 to 5.0 km2 lost in average between −21 to −27 % of the area, and for advancing
GIC, the small GIC between 0.1 and 1.0 km2 were the ones having the greatest aver-age percentaver-age of area increase of 13 to 17 % (Fig. 5). Different theories have been
15
mentioned in Liston (1999), Granshaw et al. (2006), Demuth et al. (2008), Tennant et al. (2012), analyzing why the small GIC lost the greatest percentage of their area. This trend is probably because: (1) large GIC are usually characterized by huge variability in thickness, while small GIC are typically thinner and the thicknesses more uniform. As a consequence, the fractional area loss rates for the large GIC is relatively slow,
20
while the fractional area loss rates for small GIC is relatively fast; (2) a high area-to-volume ratio, indicating that for the same ablation rate small GIC should shrink faster; and/or (3) a possible higher perimeter-to-area ratio which makes the small GIC more affected to reflection radiation and convection of heat from the surrounding areas. GIC smaller the 0.1 km2faced less percentage of area loss than GIC between 0.1 to 5.0 km2
25
TCD
6, 4417–4446, 2012Multi decadal glacier area fluctuations
S. H. Mernild and J. K. Malmros
Title Page
Abstract Introduction
Conclusions References
Tables Figures
◭ ◮
◭ ◮
Back Close
Full Screen / Esc
Printer-friendly Version
Interactive Discussion
Discussion
P
a
per
|
Dis
cussion
P
a
per
|
Discussion
P
a
per
|
Discussio
n
P
a
per
|
locations with the possibility for reduced insolation (DeBeer and Sharp, 2007; Demuth et al., 2008). However, the understanding of the link between initial area (km2) and area changes (km2yr−1), and why the shrinking rates depend on the initial area is still one of the gaps in our understanding of GIC behavior (Cogley, 2012).
3.2 Area change – retreat and advance 5
Throughout the ca. 25 yr of satellite coverage, the Pan-Arctic GIC have faced widespread non-uniform shrinkage, where 8 %, 26 out of the 321 observed GIC ad-vanced in area (Figs. 1, 6, and 7). As an example, these non-uniform GIC area changes are illustrated for twelve individual GIC (for both minor and major GIC) (Fig. 8), where ten out of twelve GIC showed retreat. On sub-regional scale, half of the twelve regions
10
showed GIC retreated for all observed GIC, whereas 5 % of the GIC advanced in No-vaya Zemlya, 9 % SE. Greenland (Mernild et al., 2012b), 10 % Kamchatka, 13 % W. Canada and W. US, 37 % SW. Greenland, and 42 % Bolshevik Island (Table 4). The GIC area changes in Bolshevik Island are not detailed described in general in the lit-erature, therefore it is difficult to conclude whether the GIC advancement are due to
15
a response from a positive net mass balance (climatic response), or due to surging activities (climate-dynamic GIC response), however all the GIC in Bolshevik Island are facing north. Advancing GIC have also been recognized in other regions, however they are located apart from surge clusters, e.g., for W. Canada and W. US (Post, 1969), SW. Greenland (Yde and Knudsen, 2007), and SE. Greenland (Jiskoot et al., 2003),
indi-20
cating that the GIC likely are influenced by climate impacts. Common for the advancing GIC are, for all sub-regions, that they predominantly are facing north (85 %), and that they were influenced by dynamic response to changes in positive mass balance and climate, except for GIC located in Arctic Russia or Kamchatka, where surging activities are present (Grant et al., 2009). For example, for Novaya Zemlya 5 % of the observed
25
TCD
6, 4417–4446, 2012Multi decadal glacier area fluctuations
S. H. Mernild and J. K. Malmros
Title Page
Abstract Introduction
Conclusions References
Tables Figures
◭ ◮
◭ ◮
Back Close
Full Screen / Esc
Printer-friendly Version
Interactive Discussion
Discussion
P
a
per
|
Dis
cussion
P
a
per
|
Discussion
P
a
per
|
Discussio
n
P
a
per
|
For the compiled data set the highest frequency (number of observations) of GIC area change occurred within the interval from−5 to−20 % (see histogram in Fig. 7), overall spanning from a shrinkage of−99 % to an advance of 37 %, with an arithmetic
mean relative GIC area change of−21±1 % (here and below, the error term is stated
as plus or minus one standard error) (Fig. 7). Without including area losses for the very
5
largest GIC (GIC>340 km2; Fig. 5), we are likely to overestimate the overall relatively
rate of area loss, however insignificantly. On the regional scale Alaska faced an aver-age GIC shrinkaver-age of−40±4 % (−1.7 % yr−1), Arctic Canada
−35±4 % (−1.7 % yr−1),
N. and E. Asia−23±3 % (−1.9 % yr−1), Scandinavia−21±2 % (−0.9 % yr−1),
Green-land −20±2 % (−0.8 % yr−1), W. Canada and W. US −12±3 % (−0.5 % yr−1), and
10
Arctic Russia −12±2 % (−0.5 % yr−1) (Fig. 9 and Table 3). For W. Canada and W.
US, more specifically for the Canadian Rocky Mountains, an area shrinkage of−15 to
−25 % (ca. 1950–2000) was computed (Luckman and Kavavagh, 2000, DeBeer and
Sharp, 2007), but a direct comparison to previous studies can not be done, due to the uneven observation periods.
15
The arithmetic mean area shrinkage for the compiled data set corresponds to ca. one-fifth of the mid-1980s GIC area, equal to a mean GIC area shrinking rate of−0.06±
0.01 km2yr−1(Tables 3 and 4): a higher rate than illustrated in earlier studies (Mernild et al., 2012b). On a sub-regional scale the absolute arithmetic mean shrinking rate was highest for NW. Greenland−0.18 km2yr−1, Novaya Zemlya −0.16 km2yr−1, and
20
Ellesmere Island−0.15 km2yr−1, and lowest for N. Scandinavia−0.01 km2yr−1and W.
Canada and W. US−0.01 km2yr−1(see Table 4 for further sub-regional shrinking rates
and standard errors).
For the compiled Pan-Arctic GIC in general, the relative shrinkage rate averaged ca.−1 % yr−1(for the last ca. 25 yr) during climate warming, including record high mean
25
TCD
6, 4417–4446, 2012Multi decadal glacier area fluctuations
S. H. Mernild and J. K. Malmros
Title Page
Abstract Introduction
Conclusions References
Tables Figures
◭ ◮
◭ ◮
Back Close
Full Screen / Esc
Printer-friendly Version
Interactive Discussion
Discussion
P
a
per
|
Dis
cussion
P
a
per
|
Discussion
P
a
per
|
Discussio
n
P
a
per
|
(Cogley, 2012), however the mass balance from the most recent pentad (2006–2010) has experienced more moderate, although still large losses.
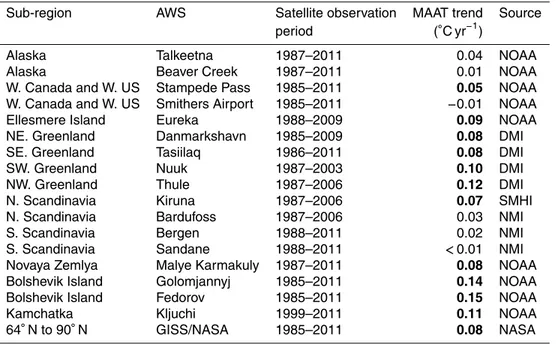
Randomly chosen observed automatic weather station (AWS) temperature time se-ries were obtained from each of the individual sub-regions, including for GISS/NASA 64◦N–90◦N latitude band from 1985 through 2011 (Fig. 10). Common for the majority
5
of the displayed AWS was a significant increasing mean annual air temperature (MAAT) (the trend in MAAT is calculated between satellite observations, between the red trian-gles on Fig. 10), e.g., in parts of Arctic Canada (Ellesmere Island), Greenland, Arctic Russia, and N. and E. Asia: the AWS having a significant increasing MAAT are shown in bold in Table 5. MAAT increased non-uniformly between sub-regions, varying e.g.,
10
from<0.01◦C yr−1in Sandane (S. Scandinavia) to 0.15◦C yr−1 in Fedorov (Bolshevik
Island). For Smithers Airport, W. Canada and W. US, MAAT decreased insignificantly. Besides the regional variability in MAAT, and that MAAT increases significantly at some locations, the Pan-Arctic has in general faced increasing MAAT during the last ca. 25 yr confirmed by the GISS/NASA 64–90◦N latitude band time series (see Fig. 10 and
Ta-15
ble 5), covering record high MAAT for the first decade of the 21st century (2001–2010) (Hansen et al., 2012).
4 Summary and conclusions
Historically, the representation of shrinking and advancing GIC conditions has been either non-existent or limited for Pan-Arctic regions, however, satellite and aerial
obser-20
vations from SE. Greenland GIC went back to the 1930s (Bjork et al., 2012). Mapping both the present temporal and spatial shrinking and advancing behavior simultaneously of Pan-Arctic GIC provides insight into the climate impacts on the cryosphere. For the last ca. 25 yr shrinking of land-terminating GIC has been documented in high-latitude regions, indicating that GIC have on average lost one-fifth of their area since the
mid-25
1980s (equal to a shrinking rate of ca.−1 % yr−1), covering a variation in loss rates
TCD
6, 4417–4446, 2012Multi decadal glacier area fluctuations
S. H. Mernild and J. K. Malmros
Title Page
Abstract Introduction
Conclusions References
Tables Figures
◭ ◮
◭ ◮
Back Close
Full Screen / Esc
Printer-friendly Version
Interactive Discussion
Discussion
P
a
per
|
Dis
cussion
P
a
per
|
Discussion
P
a
per
|
Discussio
n
P
a
per
|
Acknowledgements. We extent a very special thanks to William H. Lipscomb, Glen E. Liston, Jacob C. Yde, and Matthew W. Hecht for their insightful critique of this article. This work was supported by the Earth System Modeling program within the US Department of Energy’s Office
of Science and by a Los Alamos National Laboratory (LANL) Director’s Fellowship. LANL is operated under the auspices of the National Nuclear Security Administration of the US Depart-5
ment of Energy under Contract No. DE-AC52-06NA25396), and partly from the European Com-munity’s Seventh Framework Programme under grant agreement No. 262693. Special thanks are given to the Danish Meteorological Institute (DMI; http://www.dmi.dk) for providing observed air temperature data from the meteorological stations in Thule, Daneborg, Tasiilaq, and Nuuk (Greeenland), Norwegian Meteorological Institute (NMI; http://sharki.oslo.dnmi.no/portal/page? 10
_pageid=73,39035,73_39049&_dad=portal&_schema=PORTAL) for providing data from Bar-dufoss, Bergen, and Sandane (Norway), Swedish Meteorological and Hydrological Institute (SMHI; http://www.smhi.se) for providing data from Kiruna (Sweden), National Oceanic and Atmospheric Administration (NOAA; http://www.ncdc.noaa.gov/cdo-web/search) for providing data from Talkeetna and Beaver Creek (Alaska), Stampede Pass and Smithers Airport (W. 15
Canada), Eureka (Arctic Canada), Malye Karmakuly, Golomjannyj, and Fedorov (Arctic Rus-sia), and Kijuchi (N. and E. ARus-sia), and National Aeronautics and Space Administration (NASA) for providing temperature data from the Goddard Institute for Space Studies (GISS) database (http://data.giss.nasa.gov/gistemp/tabledata/ZonAnn.Ts+dSST.txt). All satellite data was
ac-quired through the USGS Earth Explorer internet portal (http://earthexplorer.usgs.gov/). Ap-20
plications for individual GIC area data should be directed to the first author. SHM and JKM compiled the dataset, analyzed the data, and wrote the manuscript. SHM and JKM contributed equally to the study.
References
Arendt, A., Bolch, T., Cogley, J.G., Gardner, A., Hagen, J.-O., Hock, R., Kaser, G., Pfeffer, W.
25
T., Moholdt, G., Paul, F., Radić, V., Andreassen, L., Bajracharya, S., Beedle, M., Berthier, E.,
Bhambri, R., Bliss, A., Brown, I., Burgess, E., Burgess, D., Cawkwell, F., Chinn, T., Copland, L., Davies, B., de Angelis, H., Dolgova, E., Filbert, K., Forester, R., Fountain, A., Frey, H., Giffen, B., Glasser, N., Gurney, S., Hagg, W., Hall, D., Haritashya, U. K., Hartmann, G., Helm,
TCD
6, 4417–4446, 2012Multi decadal glacier area fluctuations
S. H. Mernild and J. K. Malmros
Title Page
Abstract Introduction
Conclusions References
Tables Figures
◭ ◮
◭ ◮
Back Close
Full Screen / Esc
Printer-friendly Version
Interactive Discussion
Discussion
P
a
per
|
Dis
cussion
P
a
per
|
Discussion
P
a
per
|
Discussio
n
P
a
per
|
Kriegel, D., Kutuzov, S., Lavrentiev, I., LeBris, R., Lund, J., Manley, W., Mayer, C., Miles, E., Li, X., Menounos, B., Mercer, A., Moelg, N., Mool, P., Nosenko, G., Negrete, A., Nuth, C., Pettersson, R., Racoviteanu, A., Ranzi, R., Rastner, P., Rau, F., Rich, J., Rott, H., Schneider, C., Seliverstov, Y., Sharp, M., Sigurðsson, O., Stokes, C., Wheate, R., Winsvold, S., Wolken, G., Wyatt, F., and Zheltyhina, N.: Randolph Glacier Inventory [v2.0]: A Dataset of Global 5
Glacier Outlines. Global Land Ice Measurements from Space, Boulder Colorado, USA, Digital Media (http://www.glims.org/RGI/randolph.html), 2012.
Bahr, D. B. and Radić, V.: Significant contribution to total mass from very small glaciers, The
Cryosphere, 6, 763–770, doi:10.5194/tc-6-763-2012, 2012.
Bahr, D. B., Dyurgerov, M., and Meier, M. F.: Sea-level rise from glaciers and ice caps: A lower 10
bound, Geophys. Res. Lett., 36, L03501, doi:10.1029/2008GL036309, 2009.
Bjork, A. A., Kjaer, K. H., Korsgaard, N. J., Khan, S. A., Kjeldsen, K. K., Andresen, C. S., Box, J. E., Larsen, N. K., and Funder, S.: An areal view of 80 years of climate-related glacier fluc-tuations in Southeast Greenland, Natur Geoscience, 5, 427–432, doi:10.1038/NGEO1481, 2012.
15
Bloch, T., Menounos, B., and Wheate, R.: Landsat-based inventory of glaciers in western Canada, 1985–2005, Remote Sens. Environ., 114, 127–137, 2010.
Brest, C.: Seasonal Albedo of an Urban/Rural Landscape from Satellite Observations, J. Clim. Appl. Meteorol., 26, 1169–1186, 1987.
Cogley, G.: The Future of the World’s Glaciers, in: The Future of the World’s Climate, edited by: 20
Henderson-Sellers, A. and McGuffie, K., Elsevier, 2012.
Crane, R. G. and Anderson, M. R.: Satellite discrimination of snow/cloud surfaces, Int. J. Re-mote Sens., 5, 213–223, 1984.
DeBeer, C. M. and Sharp, M. J.: Recent changes in glacier area and volume within the Southern Canadian Cordillera, Ann. Glaciol., 46, 215–221, 2007.
25
Demuth, M., Pinard, V., Pietroniro, A., Luckman, B., Hopkinson, C., Dornes, P., and Comeau, L.: Recent and Past-century Variations in the Glacier Resources of the Canadian Rocky Moun-tains: Nelson River System, Terra Glacialis, Special Issue: Mountain Glaciers and Climate Change of the Last Century, 27–52, 2008.
Dozier, J. and Marks, D.: Snow mapping and classification from Landsat Thematic Mapper data, 30
TCD
6, 4417–4446, 2012Multi decadal glacier area fluctuations
S. H. Mernild and J. K. Malmros
Title Page
Abstract Introduction
Conclusions References
Tables Figures
◭ ◮
◭ ◮
Back Close
Full Screen / Esc
Printer-friendly Version
Interactive Discussion
Discussion
P
a
per
|
Dis
cussion
P
a
per
|
Discussion
P
a
per
|
Discussio
n
P
a
per
|
Dyurgerov, M. B.: Data of Glaciological Studies – Reanalysis of Glacier Changes: From the IGY to the IPY, 1960–2008, Publication No. 108, Institute of Arctic and Alpine Research (University of Colorado), 2010.
Gao, B.-C.: NDWI – A Normalized Difference Water Index for Remote Sensing of Vegetation
Liquid Water From Space, Remote Sens. Environ., 58, 257–266, 1996. 5
Granshaw, F. D. and Fountain, A. G.: Glacier Change (1958–1998) in the North Cascades national Park Complex, Washington, USA, J. Glaciol., 52, 251–256, 2006.
Grant, K. L., Stokes, C. R., and Evans, I. S.: Identification and characteristics of surge-type glaciers on Novaya Zemlya, Russian Arctic. J. Glaciol., 55, 960–971, 2009.
Hall, D. K., Bayr, K. J., Schoner, W., Bindschadler, R. A., and Chien, J. Y. L.: Consideration 10
of the errors inherent in mapping historical glacier positions in Austria from the ground and space (1893–2001), Remote Sens. Environ., 86, 566–577, 2003.
Hall, D. K., Foster, J. L., Chien, J. Y. L., and Riggs, G. A.: Determination of actual snow covered area using Landsat TM and digital elevation model data in Glacier National Park, Montana, Polar Rec., 31, 191–198, 1995.
15
Hall, D. K., Riggs, G. A., Salomonson, V. V., DiGirolamo, N. E., and Bayr, K. J.: MODIS snow-cover products, Remote Sens. Environ., 83, 181–194, 2001.
Hansen, J., Ruedy, R., Sato, M., and Lo, K.: Global surface temperature change. Rev. Geophys., 48, RG4004, doi:10.1029/2010RG000345, 2010.
Jiskoot, H., Murray, T., and Luckman, A.: Surge potential and drainage-basin characteristics in 20
East Greenland, Ann. Glaciol., 36, 142–148, 2003.
Kaser, G., Cogley, J. C., Dyurgerov, M. B., Meier, M. F., and Ohmura, A.: Mass balance of glaciers and ice caps: Consensus estimates for 1961–2004, Geophys. Res. Lett., 33, 1–5, 2006.
Kargel, J. S., Ahlstrøm, A. P., Alley, R. B., Bamber, J. L., Benham, T. J., Box, J. E., Chen, C., 25
Christoffersen, P., Citterio, M., Cogley, J. G., Jiskoot, H., Leonard, G. J., Morin, P., Scambos, T., Sheldon, T., and Willis, I.: Brief communication Greenland’s shrinking ice cover: “fast times” but not that fast, The Cryosphere, 6, 533–537, doi:10.5194/tc-6-533-2012, 2012. Liston, G. E.: Interrelationships among Snow Distribution, Snowmelt, and Snow Cover
Deple-tion: Implications for Atmospheric, Hydrologic, and Ecologic Modeling, J. Appl. Meteorol., 38, 30
1474–1487, 1999.
TCD
6, 4417–4446, 2012Multi decadal glacier area fluctuations
S. H. Mernild and J. K. Malmros
Title Page
Abstract Introduction
Conclusions References
Tables Figures
◭ ◮
◭ ◮
Back Close
Full Screen / Esc
Printer-friendly Version
Interactive Discussion
Discussion
P
a
per
|
Dis
cussion
P
a
per
|
Discussion
P
a
per
|
Discussio
n
P
a
per
|
Meier, M. F., Dyurgerov, M. B., Rick, U. K., O’neel, S., Pfeffer, W. T, Anderson, R. S., Anderson,
S. P., and Glazovsky, A. F.: Glaciers dominate eustatic sea-level rise in the 21st century, Science, 317, 1064–1067, 2007.
Mernild, S. H., Lipscomb, W. H., Bahr, D. B., Radić, V., and Zemp, M.: Imbalance and
acceler-ated melting of glaciers and ice caps, P. Natl. Acad. Sci., in review, 2012a. 5
Mernild, S. H., Malmros, J. K., Yde, J. C., and Knudsen, N. T.: Multi-decadal marine and land-terminating glacier retreat in Ammassalik region, Southeast Greenland, The Cryosphere, 6, 625–639, doi:10.5194/tc-6-625-2012, 2012b.
Paul, F.: The New Swiss Glacier Inventory 2000 – Application of remote sensing and GIS, Ph.D. thesis, Department of Geography, University of Zurich, 198 pp., 2004.
10
Post, A.: Distribution of surging glaciers in western North America, J. Glaciol., 8, 229–240, 1969.
Radić, V. and Hock, R.: Regional and global volumes of glaciers derived from statistical
upscal-ing of glacier inventory data, J. Geophys. Res., 115, F01010, doi:10.1029/2009JF001373, 2010.
15
Radić, V. and Hock, R.: Regionally differentiated contribution of mountain glaciers and ice caps
to future sea-level rise, Nature Geosci., 4, 91–94, 2011.
Rouse, J. W., Haas, R. H., Schell, J. A., and Deering, D. W.: Monitoring vegetation systems in the Great Plains with ERTS. Third ERTS Symposium, NASA SP-351, I, 309–317, 1973. Tennant, C., Menounos, B., and Wheate, R.: Area change of glaciers in the Canadian Rocky 20
Mountains, 1919 to 2006, The Cryosphere Discuss., 6, 2327–2361, doi:10.5194/tcd-6-2327-2012, 2012.
Weidick, A., Bøggild, C. E., and Knudsen, N. T.: Glacier inventory of west Greenland, Boulder, CO: National Snow and Ice Data Center, Digital media, 1992.
World Glacier Monitoring Service, Glacier Mass Balance Bulletin No. 11 (2008–2009), edited 25
by: Zemp, M., Nussbaumer, S. U., Gärtner-Roer, I., Hoelzle, M., Paul, F., and Haeberli, W., (ICSU(WDS)/IUGG(IACS)/UNEP/UNESCO/WMO, 2011.
TCD
6, 4417–4446, 2012Multi decadal glacier area fluctuations
S. H. Mernild and J. K. Malmros
Title Page
Abstract Introduction
Conclusions References
Tables Figures
◭ ◮
◭ ◮
Back Close
Full Screen / Esc
Printer-friendly Version
Interactive Discussion
Discussion
P
a
per
|
Dis
cussion
P
a
per
|
Discussion
P
a
per
|
Discussio
n
P
a
per
|
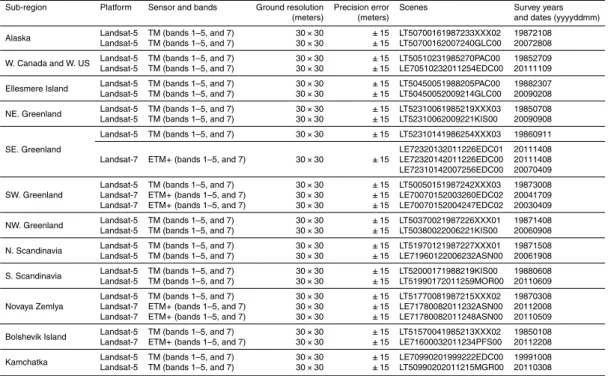
Table 1.Satellite platform, sensors, band information, scenes used in the analysis, and preci-sion errors. A geographical distribution of the sub-regions can be seen in Fig. 1.
Sub-region Platform Sensor and bands Ground resolution Precision error Scenes Survey years (meters) (meters) and dates (yyyyddmm)
Alaska Landsat-5 TM (bands 1–5, and 7) 30×30 ±15 LT50700161987233XXX02 19872108 Landsat-5 TM (bands 1–5, and 7) 30×30 ±15 LT50700162007240GLC00 20072808
W. Canada and W. US Landsat-5 TM (bands 1–5, and 7) 30×30 ±15 LT50510231985270PAC00 19852709 Landsat-5 TM (bands 1–5, and 7) 30×30 ±15 LE70510232011254EDC00 20111109
Ellesmere Island Landsat-5 TM (bands 1–5, and 7) 30×30 ±15 LT50450051988205PAC00 19882307 Landsat-5 TM (bands 1–5, and 7) 30×30 ±15 LT50450052009214GLC00 20090208
NE. Greenland Landsat-5 TM (bands 1–5, and 7) 30×30 ±15 LT52310061985219XXX03 19850708 Landsat-5 TM (bands 1–5, and 7) 30×30 ±15 LT52310062009221KIS00 20090908
SE. Greenland
Landsat-5 TM (bands 1–5, and 7) 30×30 ±15 LT52310141986254XXX03 19860911
LE72320132011226EDC01 20111408 Landsat-7 ETM+(bands 1–5, and 7) 30×30 ±15 LE72320142011226EDC00 20111408 LE72310142007256EDC00 20070409
SW. Greenland
Landsat-5 TM (bands 1–5, and 7) 30×30 ±15 LT50050151987242XXX03 19873008 Landsat-7 ETM+(bands 1–5, and 7) 30×30 ±15 LE70070152003260EDC02 20041709 Landsat-7 ETM+(bands 1–5, and 7) 30×30 ±15 LE70070152004247EDC02 20030409 NW. Greenland Landsat-5 TM (bands 1–5, and 7) 30×30 ±15 LT50370021987226XXX01 19871408 Landsat-5 TM (bands 1–5, and 7) 30×30 ±15 LT50380022006221KIS00 20060908
N. Scandinavia Landsat-5 TM (bands 1–5, and 7) 30×30 ±15 LT51970121987227XXX01 19871508 Landsat-5 TM (bands 1–5, and 7) 30×30 ±15 LE71960122006232ASN00 20061908
S. Scandinavia Landsat-5 TM (bands 1–5, and 7) 30×30 ±15 LT52000171988219KIS00 19880608 Landsat-5 TM (bands 1–5, and 7) 30×30 ±15 LT51990172011259MOR00 20110609
Novaya Zemlya
TCD
6, 4417–4446, 2012Multi decadal glacier area fluctuations
S. H. Mernild and J. K. Malmros
Title Page
Abstract Introduction
Conclusions References
Tables Figures
◭ ◮
◭ ◮
Back Close
Full Screen / Esc
Printer-friendly Version
Interactive Discussion
Discussion
P
a
per
|
Dis
cussion
P
a
per
|
Discussion
P
a
per
|
Discussio
n
P
a
per
|
Table 2.Sub-regional raw classification error due to a comparison with the cleaned up classifi-cation. The snow patch error was overestimated for all sub-regions, and the debris and shadow error underestimated for all sub-regions.
Sub-region Snow patch Debris cover and Overall classification error (%) shadow error (%) shadow error (%)
Alaska 3.0 3.2 6.2
W. Canada and W. US 2.9 3.1 6.0
Ellesmere Island 2.5 1.2 3.7
NE. Greenland 2.7 1.9 4.6
SE. Greenland 3.4 1.8 5.2
SW. Greenland 3.3 2.5 5.8
NW. Greenland 2.7 1.9 2.7
N. Scandinavia 3.1 1.5 4.6
S. Scandinavia 3.7 1.6 5.3
Novaya Zemlya 5.3 3.3 5.3
Bolshevik Island 2.2 0.7 2.9
Kamchatka 3.9 2.1 6.0
TCD
6, 4417–4446, 2012Multi decadal glacier area fluctuations
S. H. Mernild and J. K. Malmros
Title Page
Abstract Introduction
Conclusions References
Tables Figures
◭ ◮
◭ ◮
Back Close
Full Screen / Esc
Printer-friendly Version
Interactive Discussion
Discussion
P
a
per
|
Dis
cussion
P
a
per
|
Discussion
P
a
per
|
Discussio
n
P
a
per
|
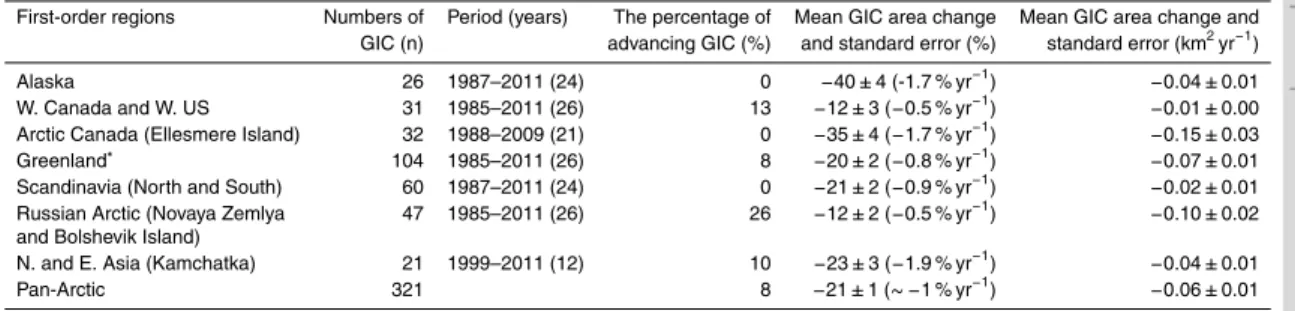
Table 3. The compiled Landsat GIC data set were divided into seven first-order Pan-Arctic regions. For N. and E. Asia the satellite period was shorter than other regions, covering the period 1999–2011.
First-order regions Numbers of Period (years) The percentage of Mean GIC area change Mean GIC area change and GIC (n) advancing GIC (%) and standard error (%) standard error (km2yr−1) Alaska 26 1987–2011 (24) 0 −40±4 (-1.7 % yr−1)
−0.04±0.01 W. Canada and W. US 31 1985–2011 (26) 13 −12±3 (−0.5 % yr−1)
−0.01±0.00 Arctic Canada (Ellesmere Island) 32 1988–2009 (21) 0 −35±4 (−1.7 % yr−1)
−0.15±0.03 Greenland∗ 104 1985–2011 (26) 8
−20±2 (−0.8 % yr−1)
−0.07±0.01 Scandinavia (North and South) 60 1987–2011 (24) 0 −21±2 (−0.9 % yr−1)
−0.02±0.01 Russian Arctic (Novaya Zemlya 47 1985–2011 (26) 26 −12±2 (−0.5 % yr−1)
−0.10±0.02 and Bolshevik Island)
N. and E. Asia (Kamchatka) 21 1999–2011 (12) 10 −23±3 (−1.9 % yr−1)
−0.04±0.01 Pan-Arctic 321 8 −21±1 (∼ −1 % yr−1)
−0.06±0.01
TCD
6, 4417–4446, 2012Multi decadal glacier area fluctuations
S. H. Mernild and J. K. Malmros
Title Page
Abstract Introduction
Conclusions References
Tables Figures
◭ ◮
◭ ◮
Back Close
Full Screen / Esc
Printer-friendly Version
Interactive Discussion
Discussion
P
a
per
|
Dis
cussion
P
a
per
|
Discussion
P
a
per
|
Discussio
n
P
a
per
|
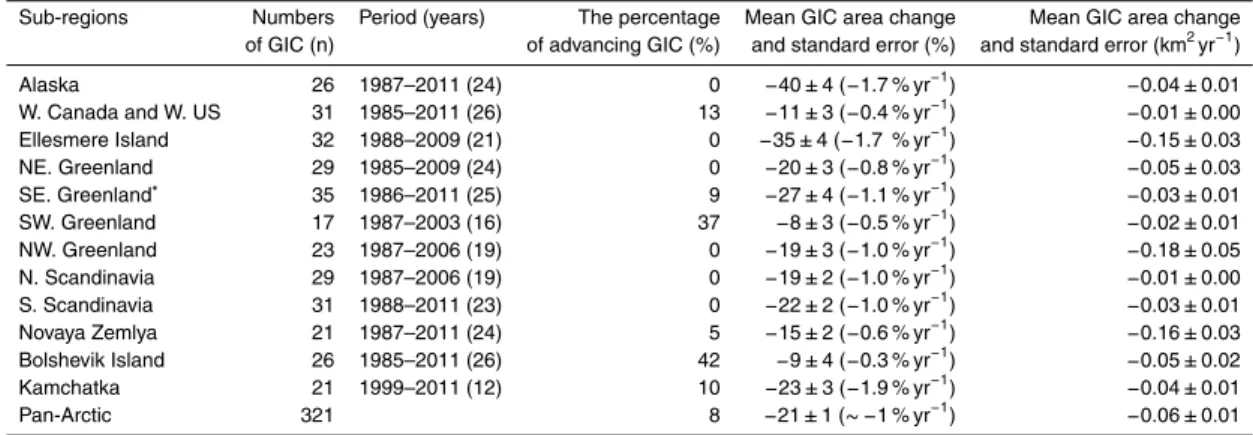
Table 4.The compiled Landsat GIC data set were divided into twelve Pan-Arctic regions.
Sub-regions Numbers Period (years) The percentage Mean GIC area change Mean GIC area change of GIC (n) of advancing GIC (%) and standard error (%) and standard error (km2yr−1)
Alaska 26 1987–2011 (24) 0 −40±4 (−1.7 % yr−1
) −0.04±0.01
W. Canada and W. US 31 1985–2011 (26) 13 −11±3 (−0.4 % yr−1
) −0.01±0.00
Ellesmere Island 32 1988–2009 (21) 0 −35±4 (−1.7 % yr−1
) −0.15±0.03
NE. Greenland 29 1985–2009 (24) 0 −20±3 (−0.8 % yr−1
) −0.05±0.03
SE. Greenland∗ 35 1986–2011 (25) 9
−27±4 (−1.1 % yr−1
) −0.03±0.01
SW. Greenland 17 1987–2003 (16) 37 −8±3 (−0.5 % yr−1
) −0.02±0.01
NW. Greenland 23 1987–2006 (19) 0 −19±3 (−1.0 % yr−1
) −0.18±0.05
N. Scandinavia 29 1987–2006 (19) 0 −19±2 (−1.0 % yr−1
) −0.01±0.00
S. Scandinavia 31 1988–2011 (23) 0 −22±2 (−1.0 % yr−1
) −0.03±0.01
Novaya Zemlya 21 1987–2011 (24) 5 −15±2 (−0.6 % yr−1
) −0.16±0.03
Bolshevik Island 26 1985–2011 (26) 42 −9±4 (−0.3 % yr−1
) −0.05±0.02
Kamchatka 21 1999–2011 (12) 10 −23±3 (−1.9 % yr−1
) −0.04±0.01
Pan-Arctic 321 8 −21±1 (∼ −1 % yr−1
) −0.06±0.01
TCD
6, 4417–4446, 2012Multi decadal glacier area fluctuations
S. H. Mernild and J. K. Malmros
Title Page
Abstract Introduction
Conclusions References
Tables Figures
◭ ◮
◭ ◮
Back Close
Full Screen / Esc
Printer-friendly Version
Interactive Discussion
Discussion
P
a
per
|
Dis
cussion
P
a
per
|
Discussion
P
a
per
|
Discussio
n
P
a
per
|
Table 5.GISS/NASA and AWS observed MAAT trends for the individual sub-regions are shown for the satellite observation periods (the locations of the AWS are illustrated on Fig. 10). Sig-nificant trends are highlighted in bold. The abbreviations indicate: NOAA (National Oceanic and Atmospheric Administration), DMI (Danish Meteorological Institute), SMHI (Swedish Me-teorological and Hydrological Institute), NMI (Norwegian MeMe-teorological Institute), and NASA (National Aeronautics and Space Administration).
Sub-region AWS Satellite observation MAAT trend Source period (◦C yr−1)
Alaska Talkeetna 1987–2011 0.04 NOAA Alaska Beaver Creek 1987–2011 0.01 NOAA W. Canada and W. US Stampede Pass 1985–2011 0.05 NOAA W. Canada and W. US Smithers Airport 1985–2011 −0.01 NOAA
Ellesmere Island Eureka 1988–2009 0.09 NOAA NE. Greenland Danmarkshavn 1985–2009 0.08 DMI SE. Greenland Tasiilaq 1986–2011 0.08 DMI SW. Greenland Nuuk 1987–2003 0.10 DMI NW. Greenland Thule 1987–2006 0.12 DMI N. Scandinavia Kiruna 1987–2006 0.07 SMHI N. Scandinavia Bardufoss 1987–2006 0.03 NMI S. Scandinavia Bergen 1988–2011 0.02 NMI S. Scandinavia Sandane 1988–2011 <0.01 NMI
TCD
6, 4417–4446, 2012Multi decadal glacier area fluctuations
S. H. Mernild and J. K. Malmros
Title Page
Abstract Introduction
Conclusions References
Tables Figures
◭ ◮
◭ ◮
Back Close
Full Screen / Esc
Printer-friendly Version
Interactive Discussion
Discussion
P
a
per
|
Dis
cussion
P
a
per
|
Discussion
P
a
per
|
Discussio
n
P
a
per
|
Fig. 4.Relationship for advancing GIC (blue diamonds) and shrinking GIC (red diamonds), and their initial area versus area change. The initial GIC area is based on data from mid-1980s, and the area rate is the annual area difference between mid-1980s and late-2000s/2011. The
TCD
6, 4417–4446, 2012Multi decadal glacier area fluctuations
S. H. Mernild and J. K. Malmros
Title Page
Abstract Introduction
Conclusions References
Tables Figures
◭ ◮
◭ ◮
Back Close
Full Screen / Esc
Printer-friendly Version
Interactive Discussion
Discussion
P
a
per
|
Dis
cussion
P
a
per
|
Discussion
P
a
per
|
Discussio
n
P
a
per
|
Fig. 5. Relationship for advancing GIC (blue diamonds) and shrinking GIC (red diamonds), and their initial area versus the percentage of area change. The initial GIC area is based on data from mid-1980s, and the area rate is the percentage annual area difference between
TCD
6, 4417–4446, 2012Multi decadal glacier area fluctuations
S. H. Mernild and J. K. Malmros
Title Page
Abstract Introduction
Conclusions References
Tables Figures
◭ ◮
◭ ◮
Back Close
Full Screen / Esc
Printer-friendly Version
Interactive Discussion
Discussion
P
a
per
|
Dis
cussion
P
a
per
|
Discussion
P
a
per
|
Discussio
n
P
a
per
|
Fig. 6.Satellite-derived area change rates for GIC within the 12 sub-regions, where red circles show GIC shrinkage and blue circles advance (km2yr−1
TCD
6, 4417–4446, 2012Multi decadal glacier area fluctuations
S. H. Mernild and J. K. Malmros
Title Page
Abstract Introduction
Conclusions References
Tables Figures
◭ ◮
◭ ◮
Back Close
Full Screen / Esc
Printer-friendly Version
Interactive Discussion
Discussion
P
a
per
|
Dis
cussion
P
a
per
|
Discussion
P
a
per
|
Discussio
n
P
a
per
|
Fig. 10.Examples of AWS observed MAAT omaly time series from different locations in the