PARAMETRIZATION OF INNER STRUCTURE OF AGRICULTURAL
SYSTEMS ON THE BASIS OF MAXIMAL YIELDS ISOLINES (ISOCARPS)
PARAMETRIZACE VNITŘNÍ STRUKTURY ZEMĚDĚLSKÉ SOUSTAVY NA
ZÁKLADĚ IZOČAR MAXIMÁLNÍCH VÝNOSŮ (IZOKARP)
K. KUDRNA, M. ŠINDELÁŘOVÁ*
University of South Bohemia in České Budějovice, Faculty of Agriculture, Department of General Crop Production, 370 05 České Budějovice, Czech Republic, Tel: + 420 38 777 24 11, Fax: + 420 38 530 01 22
Manuscript received: February 23, 2004; Reviewed: February 23, 2004; Accepted for publication: March 25, 2004
ABSTRACT
On the basis of analysis of yield time series from a ten-year period, isolines of maximal yields of crops (isocarps) have been constructed, homogenized yield zones have been determined, and inner structures of the agricultural system have been calculated. The algorithm of a normal and an optimal structure calculation have been used, and differences in the structure of the agricultural system have been determined for every defi ned zone.
KEY WORDS: agricultural system, isocarps, inner structure parameters
ABSTRAKT
PODROBNÝ ABSTRAKT
V hydrogeomorfologickém regionu středních Čech byly v desetileté časové řadě stanoveny maximální výnosy hlavních plodin – obilovin, cukrovky, víceletých pícnin a jednoletých pícnin (silážní kukuřice), sestrojeny jejich izočáry (izokarpy) spojující body stejných výnosových hodnot. Na tomto principu byla vykreslena výnosová pásma. Maximální výnosy byly zvoleny proto, neboť představují v časové řadě extrémní hodnotu akumulace organické hmoty, která vzniká jen za předpokladu, že všechny faktory podílející se na výnosu jsou v optimu, a stávají se tak měřitelným příznakem vlivu celého souboru těchto faktorů. Jejich hodnoty byly ověřeny termodynamickými parametry v kritických obdobích sledovaných plodin. Vzniklá pásma jsou rozdělena zcela zákonitě a ukazují na půdní vlastnosti těchto oblastí. Nejvyšší hodnoty obilovin spadají (při 50 % jejich zastoupení ve struktuře soustavy) do oblasti aluviálních hlín dolního toku Bakovského potoka podobně jako do těchto aluvií potoka Loděnického. Izokarpy cukrovky (při 10 % zastoupení) se pak soustřeďují výhradně do oblasti aluvií a sprašových hlín v pásmech I a II a pak v pásmu VIII v povodí sledovaných toků. Izokarpy víceletých pícnin jako základních zdrojů aktivního uhlíku klesají ve stejném směru jako obiloviny a na VII. pásmu se blíží hodnotám II. pásma. Zde se vytvářejí dvě výnosové osy – západním a jižním směrem.
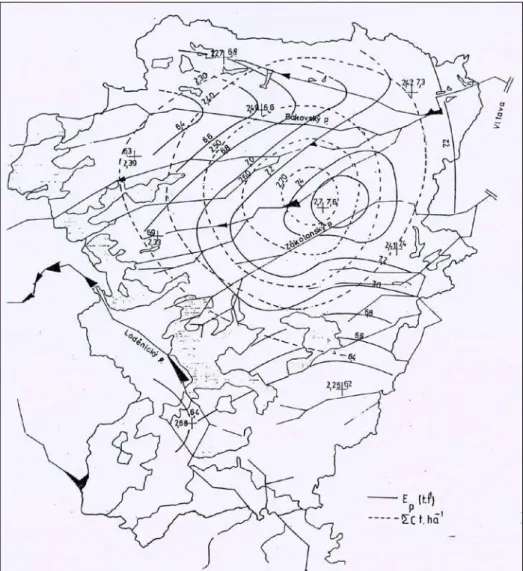
V regionu byly vyhodnoceny i izočáry bioenergetického potenciálu půdy (Ep), které představují stupeň využití minerálních živin. Jejich maximální hodnoty spadají do oblasti spraší na středním toku Zákolanského potoka, což odpovídá největšímu objemu aktivního uhlíku. Proto maxima výnosů jsou v této oblasti nejstabilnější.
Pomocí algoritmu [1], který vyplynul z teorie uhlíkové bilance a rovnovážného stavu zdrojů a spotřebitelů uhlíku, byla vypočítána vnitřní struktura zemědělské soustavy pro jednotlivá pásma tak, aby vyjadřovala potřebné plochy doprovodných plodin-zdrojů i spotřebitelů uhlíku pro zabezpečení požadované produkce. Byly tedy stanoveny parametry vnitřní struktury soustavy, jež přesně odpovídá podmínkám daného výnosového pásma za předpokladu rovnovážného stavu uhlíkové bilance. Parametry byly stanoveny pro 1000 t obilovin, 1000 t cukrovky a pro 1000 zvířat (skotu v dobytčích jednotkách) za předpokladu maximálních výnosů. Byly rovněž vypočítány parametry vnitřní struktury pro výtěžnost 6,0 a 7,0 t cukru.ha-1, jakož i parametry pro výtěžnost 1 t cukru při 7,0 t cukru.ha-1. Zvýšení o
INTRODUCTION
In connection with the solution of impact of natural conditions on the territorial and the inner structure of agricultural system, we tried to express these conditions by means of extreme values – maximal yields of main crops, and to generalize their relation to soil conditions by isolines their equal value (isocarps). On this principle, we have determined the inner structure of the system using the algorithm expressing limit conditions of individual subsystems and elements. That is why the characteristics of Planck’s radiate constants have been included in the algorithm; they express the limit on the carbon balance principle [1]. Using the algorithm, we have transformed all organic matter to active carbon, and calculated all necessary parameters for carbon sources and consumers. (All perennial fodder crops and straw of cereals present carbon sources, all root and tuber crops present carbon consumers.) Animals – cattle are transformers of these carbon matters, that is why feed ration and cattle stock must be taken in account. Active carbon stabilizes the system on a certain yield level by the determination of utilization of mineral nutrients and utilization of water by plant as well as microbial societies. Sometimes, we get statistic dependence between yield level and carbon content in soil. It comes in account, when water and chemical balance in rhizosphere of arable crops are perfectly regulated even at extreme situations. In fact, the role of active carbon consists in stabilization of energetic processes in the biosphere, and carbon, which comes into the soil, must be also consumed. Even the principle of a progressive development of the biosphere consists in this. That is why, in the algorithm, sources, consumers and transformers of organic matter are taken in account. To transfer to active carbon then we use coeffi cients derived from the principle of big numbers or analyses of large systems or by mathematical way. All these values have been verifi ed on many structures of agricultural systems [4, 5]. That way also structures for individual zones have been calculated, corresponding with natural conditions of these zones. Cereals are a key part, as they determine the demand of carbon sources, and at the same time they own are carbon sources for all root and tuber crops. Agricultural system (ZS) can be expressed by Gauss’s equation [1]:
Here:
Ys – dry matter of a crop M – pure nutrients quantity
That is why: if the quantity of nutrients decreases with increasing yield, their utilization is maximal. We have expressed the inner structure by parameters expressing the necessary acreage of accompanying crops, supposing a well-balanced state of carbon processes. This way, we also get an exact structure of these crops, which are necessary for achieving stability of the given production. In a similar way, we have expressed the necessary structure for the yield of sugar.
More authors are engaged in sugar beet and its place and importance in the structure of agricultural systems in the Czech Republic and the European Union [6, 3].
MATERIAL AND METHODS
As base data, ten year periods of main crops yields on the acreage of 42 389 hectare have been used, in the hydrogeomorphologic region of central Bohemia, eliminated by the water streams of Berounka-Loděnický stream, and the Vltava river, and the Ohře river in the North. A dominant position of the region belongs to the hill of Džbán 536 m a.s.l., and the hill of Louštín 537 m a.s.l. at the Rakovnická Hilly Country. Crop yields have been related to centres of land-register areas. At the same time, a hydrologic, a geological, a hydrogeomorphologic and a climatic analysis have been carried out on the area.
METHODOLOGY
As the maximal yield is dependent also on the structure of the system, all yield values had to be counted over on a comparable value according to the principle of big numbers (in the system of the CR and European countries); Pearson’s distribution of frequencies of the 3-rd type has been respected. Interpolated values have been plotted to a matrix in the scale 1 : 100 000, isocarps and appurtenant zones have been indicated with Roman numerals. As the basis of the calculation, zones and isocarps of cereals (Y2z) have been taken. The inner
1. succession of carbon sources and consumers: perennial fodder crops – cereals – root and tuber crops
2. Perennial fodder crops and grassland are a primary independent source of carbon. The stability of cereals depends on them.
At respecting this hierarchy, carbon is a determining factor for all its consumers, especially for root and tuber crops, as stability of root and tuber crops is a function of
carbon of cereals straw.
Values of maximal yield isocarps were determined by interpolation between centres of production units. For an image of relation of bioenergetic soil potential and the quantity of carbon per hectare, their planary division has also been drawn.
RESULTS
Figure 2: Isocarps of Ys3a max
Zone P0
ha P%0 Pha1 P%1 haP2z P%2z Pha3a P%3a Phaor
I. 29.4 8.23 105 29.41 185.8 52.05 36.73 10.29 356.93
II. 34.33 9.31 106 28.76 190.5 51.7 37.7 10.22 368.53
III. 36.35 9.57 106 28.19 194.2 51.69 39.2 10.43 375.65
IV. 41.2 10.67 106.5 27.58 198.0 51.27 40.42 10.47 386.12
V 47.53 11.67 116.1 28.52 202.0 49.6 41.42 10.17 407.05
Figure 3: Isocarps of Ys1 max and Ys0 max
Zone P0
ha P%0 Pha1 P%1 haP2z P%2z Pha3a P%3a Phaor
I. 60.0 8.23 213.92 29.38 375.2 52.08 74.96 10.29 728.17
II. 70.1 9.32 216.13 28.75 388.6 51.69 76.92 10.23 751.75
III. 74.23 9.68 214.13 28.20 396.1 51.67 80.0 10.44 766.46
IV. 84.13 10.67 217.35 27.58 403.96 51.26 82.5 10.47 787.94
V 97.1 11.68 237.0 28.52 419.13 49.63 84.53 10.17 831.13
VI. 97.1 11.54 237.0 28.18 422.4 50.22 84.53 10.05 841.06
VII. 100.96 11.72 242.71 28.16 430.4 49.94 87.6 10.16 861.67
VIII. 89.4 11.35 227.44 28.89 391.6 49.75 78.7 9.99 787.14
∅ 84.12 9.52 225.89 28.46 403.04 50.75 81.22 10.22 794.41
Figure 4: Isolines of the bioenergetic soil potential and the quantity of active carbon per hectare
Table 3: The inner structure of the agricultural system for 1000 Z under precondition of maximal yields in all zones [ha, %]
Zone P0
ha P%0 Pha1 P%1 haP2z P%2z Pha3a P%3a Phaor
I. 78.38 8.25 279.1 29.37 494.8 52.1 97.83 10.29 950.1
II. 91.44 9.35 282.0 28.74 507.0 51.69 100.4 10.23 980.9
III. 96.82 9.68 282.0 28.19 516.9 51.68 104.4 10.44 1000.1
IV. 109.73 10.67 283.6 27.58 527.1 51.27 107.67 10.47 1028.1
V 126.61 11.68 309.26 28.53 537,8 49.61 110.31 10.17 1083.9
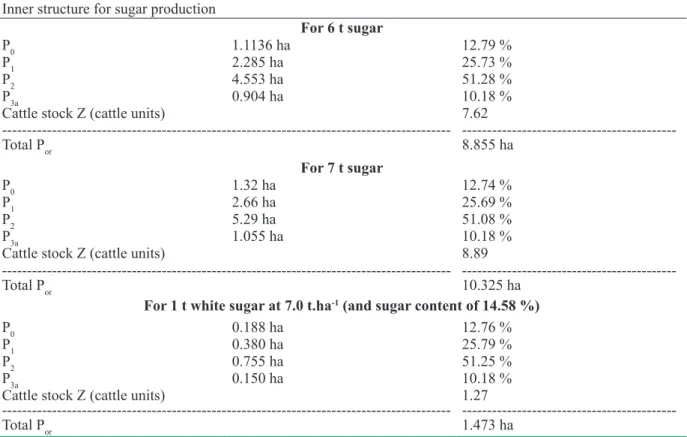
Table 4: Calculation of inner structure for 6 t sugar (respectively 7 t sugar) at 10 % acreage of sugar beet in the agricultural system and Ys3a∅ 11.44 t.ha-1 (41.14 t.ha-1) and sugar content of 14.58 %
Inner structure for sugar production
For 6 t sugar
P0 1.1136 ha 12.79 %
P1 2.285 ha 25.73 %
P2 4.553 ha 51.28 %
P3a 0.904 ha 10.18 %
Cattle stock Z (cattle units) 7.62
----
---Total Por 8.855 ha
For 7 t sugar
P0 1.32 ha 12.74 %
P1 2.66 ha 25.69 %
P2 5.29 ha 51.08 %
P3a 1.055 ha 10.18 %
Cattle stock Z (cattle units) 8.89
----
---Total Por 10.325 ha
For 1 t white sugar at 7.0 t.ha-1 (and sugar content of 14.58 %)
P0 0.188 ha 12.76 %
P1 0.380 ha 25.79 %
P2 0.755 ha 51.25 %
P3a 0.150 ha 10.18 %
Cattle stock Z (cattle units) 1.27
----
---Total Por 1.473 ha
DISCUSSION
Evaluation of isocarps Y2z max (P2 50 %), according to which we have also expressed zones I – VIII, convincingly shows a considerable equability of distribution, and drop of yield axis from the north-east to the south-west. The zone VIII is an exception. It is formed along the Loděnický stream, which has similar conditions of alluvial loams as in the zone along the Bakovský stream (II). If we compare isocarps Ys3a max (P3a 10 % and P2 50 %), the picture is similar, just the articulation of lines is here much higher, and the lines intervene in various zones, and concentrate much more in the area of alluvial and loes loams. In the zone VIII, the isocarps show similar values as in the zones I. and II.
Isolines of Ys1 max are decreasing in the same direction
as cereals, and in the zone VIII are close to the values of the zone II.
Evidence for relations of soil properties and isocarp distribution is given in particular by isocarps of independent carbon sources – Ys1 and Ys0. Here, two
axes of yields are forming – in west and south direction. Bending of both isocarps is typical. (Values of Ys0 are on
the left and are lower.) The reality, that Ep is dependent on the total carbon volume, is confi rmed by the fi gure 4,
where both quantities are evaluated. For one thing, they concentrate with their maximal values into the nearly same area of alluvial loams and loess, for another they have a very similar course and distribution. (The lower values are the carbon volume per hectare.) It appears from mentioned facts, that the carbon volume gives utilization of mineral nutrients. This utilization then goes down in two directions along the isocarps Ys1 max and the
isocarps Ys0 max.
Calculation of inner structure according to individual zones (tab. 1 ÷ 3) shows differences in areas under crops for ensuring demanded production in individual zones. It is quite evident, that each production requires a certain structure of carbon sources and consumers. It is evident also from tab. 4, from which follows, that on increasing of 1 t sugar (at a constant sugar content 14.58 % and Ys3a max)
1.47 ha of crop area is demanded, the greater part from which falls on accompanying crops. Increase of cattle stock by 1.27 Z (cattle units) is connected with this.
maximal yield isocarps.
2. Total yield of pure product is always determined by accompanying crops, which characterize carbon sources and consumers and transformers of organic mass – ruminants.
3. All these facts must be taken in account at projection of agricultural systems and at all economic considerations. 4. Solution of every structure demands a close system analysis of all factors taking part at formation of production.
5. The given method enables an objective elaborating of projects of energetically closed systems.
ACKNOWLEDGMENT
This study was supported by the Grant Project of Ministry of Education of the Czech Republic, identifi cation code MSM 122200002/I.
REFERENCES
[1] Kudrna, K. (1979, 1985): Zemědělské soustavy. (Agricultural systems.) 1. a 2. vydání. SZN, Praha, 720 s.
[2] Kudrna, K. (1967): Termodynamický charakter [2] K
[2] K
vlivu klimatických faktorů na utváření výnosů polních plodin. (Thermodynamic character of infl uence of climatic factors on formation of arable crop yields.) ÚVTI, Rostlinná výroba, 6, Praha.
[3] Pospišil, R. (1998): Sugar beet – an important element in energy balance of plant production. LISTY CUKROV, 114 (5-6): 141-143.
[4] Šindelářová, M. (1994): Srovnávací systémová analýza zemědělských podniků v různých přírodních podmínkách. (Comparison system analysis of agricultural systems under various natural conditions.) Rostlinná výroba, 40 (5): 469-479.
[5] Šindelářová, M. (1996): Příspěvek k problému regionalizace zemědělských soustav v horských a podhorských podmínkách. (Contribution to the problem of regionalization of agricultural systems in mountain and submountain conditions.) Sborník ZF JU Č. Budějovice - řada fytotechnická, 13 (2): 59-72.
[6] Švachula, V., Pulkrábek, J., Šroller, J. (2000): The role of the sugar beet industry in agricultural systems in the Czech Republic and other countries of the European Union. LISTY CUKROV, 116 (12): 306-309.
Symbols and indications used in the work Symbol Meaning
P acreage [ha]
Por acreage of arable land [ha]
Ys dry matter in crop yield [t.ha-1]
ΣYs dry matter in total yield of a crop
ZS agricultural system kn feed ration for cattle
Z one animal – cattle – cattle unit Ep bioenergetic potential of soil
M quantity of mineral nutrients (pure nutrients)
ζ2 (dzeta 2) parameter expressing relation of carbon source crops (ΣYs1, ΣYs4) to cereals (ΣYs2)
ζ3 (dzeta 3) parameter expressing relation of carbon source crops (ΣYs1, ΣYs4, ΣYs2) to root and tuber
crops (ΣYs3)

![Table 1: The inner structure for 1000 t Y 2z under precondition of maximal yields in all determined zones [ha, %]](https://thumb-eu.123doks.com/thumbv2/123dok_br/16325590.187814/5.892.112.802.804.985/table-inner-structure-precondition-maximal-yields-determined-zones.webp)
![Table 2: The inner structure for 1000 t Y s3a under precondition of maximal yields in all zones [ha, %]](https://thumb-eu.123doks.com/thumbv2/123dok_br/16325590.187814/6.892.92.781.797.977/table-inner-structure-y-precondition-maximal-yields-zones.webp)