ESSDD
6, 95–117, 2013A long-term and reproducible passive
microwave sea ice concentration CDR
G. Peng et al.
Title Page
Abstract Instruments
Data Provenance & Structure
Tables Figures
◭ ◮
◭ ◮
Back Close
Full Screen / Esc
Printer-friendly Version
Interactive Discussion
Discussion
P
a
per
|
Dis
cussion
P
a
per
|
Discussion
P
a
per
|
Discussio
n
P
a
per
|
Earth Syst. Sci. Data Discuss., 6, 95–117, 2013 www.earth-syst-sci-data-discuss.net/6/95/2013/ doi:10.5194/essdd-6-95-2013
© Author(s) 2013. CC Attribution 3.0 License.
Open
Access
Earth System
Science
Data
D
iscussions
This discussion paper is/has been under review for the journal Earth System Science Data (ESSD). Please refer to the corresponding final paper in ESSD if available.
A long-term and reproducible passive
microwave sea ice concentration data
record for climate studies and monitoring
G. Peng1, W. N. Meier2, D. J. Scott2, and M. H. Savoie2
1
Cooperative Institute for Climate and Satellites, North Carolina State University (CICS-NC), and Remote Sensing Application Division (RSAD)/NOAA’s National Climatic Data Center (NCDC), 151 Patton Ave, Asheville, NC 28801, USA
2
National Snow and Ice Data Center, University of Colorado, UCB 449, Boulder, CO 80309, USA
Received: 27 March 2013 – Accepted: 22 April 2013 – Published: 7 May 2013
Correspondence to: G. Peng (ge.peng@noaa.gov)
ESSDD
6, 95–117, 2013A long-term and reproducible passive
microwave sea ice concentration CDR
G. Peng et al.
Title Page
Abstract Instruments
Data Provenance & Structure
Tables Figures
◭ ◮
◭ ◮
Back Close
Full Screen / Esc
Printer-friendly Version
Interactive Discussion
Discussion
P
a
per
|
Dis
cussion
P
a
per
|
Discussion
P
a
per
|
Discussio
n
P
a
per
|
Abstract
A long-term, consistent, and reproducible satellite-based passive microwave sea ice concentration climate data record (CDR) is available for climate studies, monitoring, and model validation with an initial operation capability (IOC). The daily and monthly sea ice concentration data are on the National Snow and Ice Data Center (NSIDC) po-5
lar stereographic grid with nominal 25×25 km grid cells in both the Southern and North-ern Hemisphere Polar Regions from 9 July 1987 to 31 December 2007 with an update through 2011 underway. The data files are available in the NetCDF data format at http: //nsidc.org/data/g02202.html and archived by the National Oceanic and Atmospheric Administration (NOAA)’s National Climatic Data Center (NCDC) under the satellite cli-10
mate data record program (http://www.ncdc.noaa.gov/cdr/operationalcdrs.html). The description and basic characteristics of the NOAA/NSIDC passive microwave sea ice concentration CDR are presented here. The CDR provides similar spatial and temporal variability as the heritage products to the user communities with the additional documentation, traceability, and reproducibility that meet current standards and guide-15
lines for climate data records. The dataset along with detailed data processing steps and error source information can be found at: doi:10.7265/N5B56GN3.
1 Introduction
The depletion of the Arctic sea ice coverage is occurring faster than most of the climate model predictions (Stroeve et al., 2007, 2012). In September 2012, a record low Arctic 20
sea ice extent minimum was reached, well below the previous Arctic sea ice extent minimum record set in September 2007 (http://nsidc.org/arcticseaicenews/). While nu-merous sea ice products are available, with the substantial changes in the Arctic sea ice and the associated impacts of the change in weather and climate system, ecosystems, and coastal communities, it is valuable to have a climate data record (CDR) quality sea 25
ESSDD
6, 95–117, 2013A long-term and reproducible passive
microwave sea ice concentration CDR
G. Peng et al.
Title Page
Abstract Instruments
Data Provenance & Structure
Tables Figures
◭ ◮
◭ ◮
Back Close
Full Screen / Esc
Printer-friendly Version
Interactive Discussion
Discussion
P
a
per
|
Dis
cussion
P
a
per
|
Discussion
P
a
per
|
Discussio
n
P
a
per
|
A CDR is defined by the National Research Council (NRC, 2004) as “a time series of measurements of sufficient length, consistency, and continuity to determine climate variability and change”. A CDR also needs to be well-documented for transparency, traceability, and ultimately reproducibility. For sea ice, the satellite-based products have an advantage of providing a complete dataset due to their superior spatial coverage 5
and continuous measurements in time during the life of the satellite missions when compared to other types of observations such as in situ or ship-based measurements. A satellite-based sea ice concentration product has been transitioned from research to operation (R2O), based on the recommendations from NRC (2004), through col-laboration between the National Oceanic and Atmospheric Administration (NOAA)’s 10
National Climatic Data Center (NCDC) Satellite Climate Data Record Program (CDRP) and the National Snow and Ice Data Center (NSIDC). The purpose of this R2O pro-cess is to produce and preserve complete and consistent sea ice concentration climate data record derived from satellite measurements based on mature research algorithms. The sea ice concentration CDR is currently available with an initial operation capability 15
(IOC), which is the first iteration of the publicly released version that has met all the software, product validation, documentation, data archive, and access requirements with a score of three or higher in all categories of the NCDC CDR Maturity Matrix (CDRP, 2011a, b). The NCDC CDR Maturity Matrix is based on a maturity model that defines CDR readiness of a product for R2O over six categories consisting of software, 20
metadata, documentation, product validation, public access, and utility into six levels (Bates and Privette, 2012). The level three or higher represents a key threshold in the maturity of the sea ice concentration product: (i) stability in source code that meets certain coding standards, (ii) metadata that meets NOAA-recommended standards for collection-level and NCDC CDRP-recommended NetCDF Climate and Forecast (CF)-25
ESSDD
6, 95–117, 2013A long-term and reproducible passive
microwave sea ice concentration CDR
G. Peng et al.
Title Page
Abstract Instruments
Data Provenance & Structure
Tables Figures
◭ ◮
◭ ◮
Back Close
Full Screen / Esc
Printer-friendly Version
Interactive Discussion
Discussion
P
a
per
|
Dis
cussion
P
a
per
|
Discussion
P
a
per
|
Discussio
n
P
a
per
|
readiness is examining the maturity of the algorithms and application of the product in peer-reviewed publications.
In this paper, we present a description of the NOAA/NSIDC sea ice concentration CDR dataset and basic characteristics of the CDR such as long-term mean and trend to provide a baseline for users.
5
2 Dataset description
The NOAA/NSIDC CDR sea ice concentrations are daily and monthly estimates of the fraction of ocean area covered by sea ice. They are derived from the brightness tem-perature from the Defense Meteorological Satellite Program (DMSP) series of Special Sensor Microwave Imager (SSM/I) passive microwave radiometers: F-8, F-11, and F-13 10
(Meier et al., 2011; see also Table 1 for an outline of passive microwave sensor sources for the sea ice concentration CDR). The CDR leverages two established and well-validated passive microwave sea ice concentration algorithms developed at the NASA Goddard Space Flight Center (GSFC): the NASA Team (NT) algorithm (Cavalieri et al., 1984, 1996, 1999) and the Bootstrap (BT) algorithm (Comiso, 1986, 2000; Comiso 15
and Nishio, 2008). The algorithms use adjusted coefficients, based on overlap of sen-sor operations, to assure consistency through the series of sensen-sors. The input DMSP SSM/I brightness temperatures are daily gridded fields archived at NSIDC (Maslanik and Stroeve, 2004) derived from swath fields generated by Remote Sensing Systems, Inc. (RSS) (Wentz et al., 2007).
20
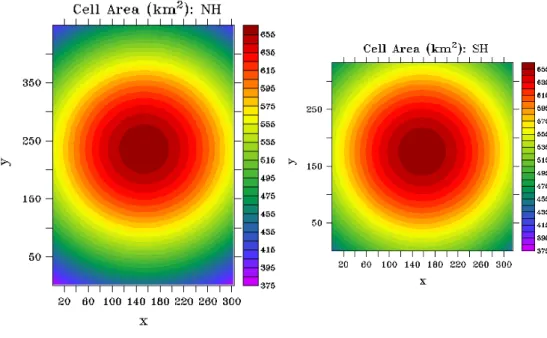
Variables in both daily and monthly data files are gridded on the same NSIDC polar stereographic grid with nominal 25×25 km grid size, covering the ocean surface area from 31.1 to 89.84◦N in the Northern Hemisphere and 39.36 to 89.84◦S in the South-ern Hemisphere. The NSIDC’s polar stereographic projection sets the projection plane tangent to the Earth’s surface at 70 degrees northern and southern latitude to minimize 25
ESSDD
6, 95–117, 2013A long-term and reproducible passive
microwave sea ice concentration CDR
G. Peng et al.
Title Page
Abstract Instruments
Data Provenance & Structure
Tables Figures
◭ ◮
◭ ◮
Back Close
Full Screen / Esc
Printer-friendly Version
Interactive Discussion
Discussion
P
a
per
|
Dis
cussion
P
a
per
|
Discussion
P
a
per
|
Discussio
n
P
a
per
|
of the cell area at the edge of the northern/southern grid can reach 31 percent/22 per-centage, respectively (Pearson, 1990; Snyder, 1987). The dimensions of grid cells in x and y directions for each data file are 304×448 for the Northern and 316×332 for the Southern Hemisphere with cell areas decreasing linearly away from the poles (Fig. 1). Figure 2 shows spatial distributions of the CDR sea ice concentration fields from daily 5
CDR data files on the minimum sea ice extent day (based on a 5-day average) for year 1987, 1997, and 2007, which provides snapshots of the decadal changes in Arctic sea ice coverage.
The daily and monthly sea ice concentration data files are available in the NetCDF data format, which is self-describing and machine-independent. The file-level metadata 10
confine to the guideline recommended by the NCDC CDRP (CDRP, 2011c). The guide-line utilizes the existing metadata conventions such as CF Metadata Convention and Unidata Attribute Convention for Dataset Discovery (ACDD) for easy dataset search and discovery, and downstream and downscaling applications. Each file includes three CDR related variables: the primary CDR sea ice concentration field from 9 July 1987 to 15
31 December 2007, local spatial standard deviation of the sea ice concentrations, and a quality flag field. The standard deviation and quality flags for each grid-cell provide indications of uncertainty/error. Additional sea ice concentration variables in each data file include two products processed by the NASA Goddard Space Flight Center and archived at NSIDC using the NT and BT algorithms, respectively (referred to as God-20
dard hereafter collectively or NT or BT, respectively). A third additional variable, pro-cessed at NSIDC, merges these two Goddard concentrations using the same method-ology that generates the CDR sea ice concentrations (referred to as GSFC hereafter). These additional Goddard parameters provide access to heritage variables familiar to user communities in the same format and grid, and effectively extend the CDR record 25
ESSDD
6, 95–117, 2013A long-term and reproducible passive
microwave sea ice concentration CDR
G. Peng et al.
Title Page
Abstract Instruments
Data Provenance & Structure
Tables Figures
◭ ◮
◭ ◮
Back Close
Full Screen / Esc
Printer-friendly Version
Interactive Discussion
Discussion
P
a
per
|
Dis
cussion
P
a
per
|
Discussion
P
a
per
|
Discussio
n
P
a
per
|
2.1 Primary CDR variables
– CDR sea ice concentration –this field provides sea ice concentration (fraction ice cover) for each grid cell. The processing includes several automated quality con-trol steps. Two weather filters, based on ratios of passive microwave frequencies, are used to eliminate false ice due to atmospheric moisture and wind roughening 5
over the open ocean. A land-spillover correction is used to filter false ice near the coast that results from mixed land-ocean grid cells. Finally, monthly ocean masks are applied to remove sea ice in regions where it is never likely to occur; in the Arctic, the masks are based on maximum extent through the time series with an added buffer, while the Antarctic uses sea surface temperature (SST) climatolo-10
gies. There are masks for each month in each hemisphere. The Antarctic masks are much more conservative (i.e., larger region of potential sea ice).
– Concentration standard deviation –the standard deviation field is derived at each valid grid cell from the NT and BT concentration values at that cell and the sur-rounding eight cells. It thereby accounts for two sources of variability: (1) the dif-15
ference between NT and BT estimates, and (2) the spatial variation within the neighborhood of each grid cell. Thus the standard deviation is calculated from up to 18 values (9 grid cells each of NT and BT sea ice concentrations, Fig. 3). The rationale for this approach is that grid cells where NT and BT differ significantly have higher uncertainty than cells where the two agree. Also, regions where there 20
is high spatial variability tend to have higher uncertainty. Such high variability re-gions include near the ice edge (where the low spatial resolution of the sensors results in limited precision of the ice edge location) and isolated ice-covered grid cells near the coast (which indicates possible land-spillover error). Thus while the values are quantitatively largely measuring spatial variability, the field provides a 25
ESSDD
6, 95–117, 2013A long-term and reproducible passive
microwave sea ice concentration CDR
G. Peng et al.
Title Page
Abstract Instruments
Data Provenance & Structure
Tables Figures
◭ ◮
◭ ◮
Back Close
Full Screen / Esc
Printer-friendly Version
Interactive Discussion
Discussion
P
a
per
|
Dis
cussion
P
a
per
|
Discussion
P
a
per
|
Discussio
n
P
a
per
|
and can potentially serve as a quantitative upper limit of the concentration error (Gloersen et al., 1993). Melt also tends to result in higher variability in the con-centrations, particularly in terms of differences between NT and BT.
– Data quality field – in addition to the quantitative local standard deviation field, a data quality field is included to provide further information about the nature of 5
the concentration values. Flag values are assigned to denote several conditions at each grid cell: (1) algorithm value selected (NT or BT), (2) masked by ocean climatology, (3) low concentration (<50 %), (4) adjacent to coast, and (5) melt occurred during summer (Arctic only). Multiple flag values can be assigned to each grid cell.
10
2.2 Additional variables included
– Merged Goddard concentration – combined NT and BT sea ice concentration estimates, assembled in the same manner as the concentration CDR variable, but using the Goddard produced fields as a source.
– Goddard NASA Team –NT concentrations produced by Goddard. Concentrations 15
are re-scaled to 0–100 percent for consistency with other variables.
– Goddard Bootstrap – BT concentrations produced by Goddard. Concentrations are re-scaled to 0–100 percent for consistency with other variables.
– Latitude/longitude – included as a part of NetCDF CF-compliant file-level meta-data requirements
20
ESSDD
6, 95–117, 2013A long-term and reproducible passive
microwave sea ice concentration CDR
G. Peng et al.
Title Page
Abstract Instruments
Data Provenance & Structure
Tables Figures
◭ ◮
◭ ◮
Back Close
Full Screen / Esc
Printer-friendly Version
Interactive Discussion
Discussion
P
a
per
|
Dis
cussion
P
a
per
|
Discussion
P
a
per
|
Discussio
n
P
a
per
|
2.3 Input data sets to the CDR
– DMSP SSM/I daily polar gridded brightness temperatures (http://nsidc.org/data/ nsidc-0001.html)
– NASA Team sea ice concentrations from DMSP SSM/I, processed at NSIDC
– Bootstrap sea ice concentrations from DMSP SSM/I, processed at NSIDC 5
– NASA Team sea ice concentrations from Nimbus-7 SMMR and DMSP SSM/I Pas-sive Microwave Data, Version 1, created by NASA GSFC (http://nsidc.org/data/ nsidc-0051.html)
– Bootstrap sea ice concentrations from Nimbus-7 SMMR and DMSP SSM/I, Ver-sion 2, created by NASA GSFC (http://nsidc.org/data/nsidc-0079.htm)
10
– Snow melt onset estimate for the Northern Hemisphere (Drobot and Anderson, 2001)
– Climatological minimum sea ice mask (CMIN) (based on 1992)
– Ocean masks (http://nsidc.org/data/smmr ssmi ancillary/ocean masks.html)
– Land masks (http://nsidc.org/data/polar stereo/tools masks.html#land masks) 15
An archived source code package that includes source code for processing NSIDC NT and BT sea ice concentrations from DMSP SSM/I brightness temperatures and pro-ducing the NOAA/NSIDC passive microwave sea ice concentration CDR along with a README file can be downloaded from http://www.ncdc.noaa.gov/cdr/operationalcdrs. html. In this source code package, one can also find the input data sets that are not 20
archived elsewhere such as climatological minimum sea ice mask (CMIN).
ESSDD
6, 95–117, 2013A long-term and reproducible passive
microwave sea ice concentration CDR
G. Peng et al.
Title Page
Abstract Instruments
Data Provenance & Structure
Tables Figures
◭ ◮
◭ ◮
Back Close
Full Screen / Esc
Printer-friendly Version
Interactive Discussion
Discussion
P
a
per
|
Dis
cussion
P
a
per
|
Discussion
P
a
per
|
Discussio
n
P
a
per
|
to capture well the seasonal and inter-annual variability when compared with other satellite-based sea ice products with no significant systematic bias (Meier et al., 2013; Peng and Meier, 2013).
Twenty years of monthly CDR data from January 1988 to December 2007 are used next to show the basic characteristics of the CDR. From hereafter, we will re-5
fer NOAA/NSIDC CDR sea ice concentrations as CDR and merged Goddard sea ice concentrations as GSFC. As stated previously, CDR and GSFC are produced using the same methodology and based on the same algorithms – the main differences are additional manual quality control of input brightness temperature and output sea ice concentration fields, gap-filling in both time and space and correction/replacement of 10
obviously erroneous data for GSFC (e.g., remaining weather effects). Because of the interpolation and manual corrections, GSFC represents a higher quality research prod-uct that can be used as a benchmark for evaluating and characterizing model or other satellite-based sea ice products such as we have done in Meier et al. (2013) for CDR; however, the higher quality comes at the expense of traceability and reproducibility 15
and longer data latency (about 12 months or longer). CDR, on the other hand, aims to ensure the consistency and sustainability of the sea ice time series with planned up-dates on a quarterly basis (monthly in the future and effort is also underway to extend the time series through year 2011) of the primary CDR fields and offers transparency, traceability, and reproducibility with the NetCDF-4 data format and CF-1.5 compliant 20
file-level metadata elements along with collection-level metadata that follows the ISO 19115-2 standards.
3 Basic characterization of the CDR
The basic characterization of the CDR is provided here using monthly sea ice extent from monthly sea ice concentration data files for a period of 20 yr (January 1988– 25
ESSDD
6, 95–117, 2013A long-term and reproducible passive
microwave sea ice concentration CDR
G. Peng et al.
Title Page
Abstract Instruments
Data Provenance & Structure
Tables Figures
◭ ◮
◭ ◮
Back Close
Full Screen / Esc
Printer-friendly Version
Interactive Discussion
Discussion
P
a
per
|
Dis
cussion
P
a
per
|
Discussion
P
a
per
|
Discussio
n
P
a
per
|
15 percent or greater sea ice concentrations, assuming the area not measured by the sensor at the North Pole is entirely covered by at least 15 % ice.
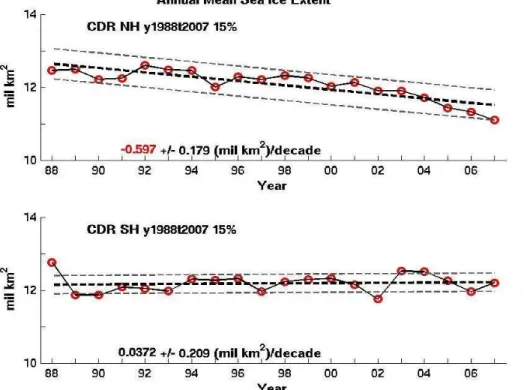
The CDR sea ice extent values are in good agreement with estimates from GSFC (Fig. 4, see Meier et al., 2013 for detailed comparison and analysis). As expected, the sea ice extent undergoes distinct seasonal cycles in both Polar Regions. It peaks 5
in March and reaches the minimum in September in the Northern Hemisphere but peaks in September and reaches the minimum in February in the Southern Hemi-sphere (Fig. 5). The mean annual CDR sea ice extent is about 12 million km2 for both hemispheres with mean biases relative to GSFC of 0.1 and−0.05 million km2 for the Northern and Southern Hemispheres, respectively (Table 2). The standard deviation 10
(SD), which is mainly associated with seasonal variability, is nearly twice as large in the Southern Hemisphere (compared 5.64 to 2.92 million km2). However, the inter-annual variability, represented by the range of the shaded area for each month in Fig. 4, tends to be smaller in the Southern Hemisphere than that in the Northern Hemisphere.
With the predominant seasonal cycle, the cross-correlation coefficients between the 15
CDR and GSFC sea ice extents are very close to one for both hemispheres with very small bias and root-mean-square (RMS) error (Table 2), largely reflecting the spatial homogeneity of the concentrations over much of the field. A lot of variability does occur near the ice edge, but that is a small portion of the total grid cells. It has been shown that regional variability can be large (e.g., Cavalieri and Parkinson, 2008). More in-20
depth examination of the regional variability will be carried out but is beyond the scope of this paper.
Least-square linear regression of this twenty-year annual mean CDR sea ice ex-tent time series indicates a sea ice coverage decrease of 0.597 million km2per decade in the Northern Hemisphere, which is significant at the 95 % confidence level. This 25
ESSDD
6, 95–117, 2013A long-term and reproducible passive
microwave sea ice concentration CDR
G. Peng et al.
Title Page
Abstract Instruments
Data Provenance & Structure
Tables Figures
◭ ◮
◭ ◮
Back Close
Full Screen / Esc
Printer-friendly Version
Interactive Discussion
Discussion
P
a
per
|
Dis
cussion
P
a
per
|
Discussion
P
a
per
|
Discussio
n
P
a
per
|
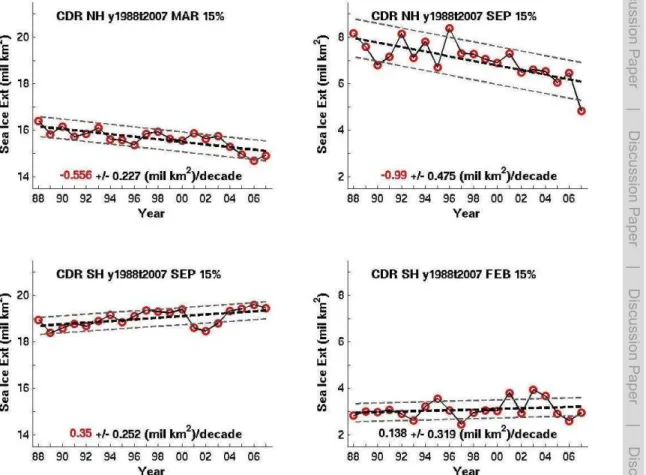
increase rate of less than 0.3 % per decade relative to the 20 yr average of annual mean sea ice extent of 12.179 million km2 and is not significant at the 95 % confi-dence level. For the Northern Hemisphere, while the annual maximum sea ice ex-tent decreases at a rate that is similar to the annual mean sea ice exex-tent rate, i.e., 0.556±0.23 million km2per decade, the annual minimum sea ice extent decreases at 5
a faster rate, 0.99±0.48 million km2 per decade (Fig. 7), indicative of the effect of en-hanced summer melt (Markus et al., 2009), thinning of the ice cover and loss of older ice types (e.g., Maslanik et al., 2011). Both annual maximum and minimum sea ice extent decadal trends are significant at the 95 % confidence level.
On the other hand, both annual maximum and minimum sea ice extents at the South-10
ern Hemisphere experience increase, with a rate of more than double for the annual maximum sea ice extent (0.35 million km2per decade, which is significant at the 95 % confidence level) than that of the annual minimum sea ice extent (0.138 million km2per decade, which is not significant at the 95 % confidence level). This difference in mag-nitudes is in part due to the large difference in absolute mean extent at the minimum 15
and maximum, as well as climate factors such as atmospheric and oceanic circulation. Therefore, while the Arctic region experienced diminishing sea ice coverage for the two decades, with a faster reduction rate for the annual minimum sea ice coverage, the Antarctic Region, as a whole, has experienced a small increase in its sea ice coverage with a noticeable increase in its annual maximum sea ice coverage, significant at the 20
95 % confidence level. These trends and variability are consistent with trends and vari-ability observed in other passive microwave sea ice products and in particularly, they are in close agreement with the Goddard estimates.
4 Conclusions
A long-term satellite-based sea ice concentration climate data record derived from pas-25
ESSDD
6, 95–117, 2013A long-term and reproducible passive
microwave sea ice concentration CDR
G. Peng et al.
Title Page
Abstract Instruments
Data Provenance & Structure
Tables Figures
◭ ◮
◭ ◮
Back Close
Full Screen / Esc
Printer-friendly Version
Interactive Discussion
Discussion
P
a
per
|
Dis
cussion
P
a
per
|
Discussion
P
a
per
|
Discussio
n
P
a
per
|
computed from GSFC with distinct seasonal cycles in both Polar Regions. The mean CDR sea ice extent is about 12 million km2for both hemispheres with mean biases of 0.1 and −0.05 million km2 relative to the GSFC fields for the Northern and Southern Hemisphere Polar Regions, respectively.
In comparisons between the CDR and GSFC variables, no significant systematic 5
bias was found. Trends and variability are also consistent. Thus the sea ice concen-tration CDR provides similar spatial and temporal variability as the GSFC fields to the user communities with the additional documentation, traceability, and reproducibility that meet current standards and guidelines for climate data records.
Acknowledgements. This work was funded by NOAA’s NCDC Satellite Climate Data Record
10
Program. W. N. Meier, D. J. Scott, and M. H. Savoie were supported under the grant NA07OAR4310056. G. Peng is supported by NOAA through the Cooperative Institute for Cli-mate and Satellites – North Carolina under Cooperative Agreement NA09NES4400006. We thank S. Mallory, A. Windnagel, and R. Duerr of NSIDC for their support in the development, documentation, and processing of the CDR. We thank D. Wunder, P. Jones, D. Bowman,
15
S. Ansari, B. Hankins, and the rest members of the NCDC sea ice concentration Integrated Product Team (IPT) for their support during the R2O process. In addition to the IPT mem-bers, J. Biard, J. Matthews, and B. Nelson have reviewed the NOAA/NSIDC passive microwave sea ice concentration CDR documentations with beneficial comments and recommendations. S. Stevens has proofread the manuscript.
20
References
Bates, J. J. and Privette, J. L.: A maturity model for assessing the completeness of climate data records, EOS, Transactions of the AGU, 93, 441, doi:10.1029/2012EO440006, 2012. Cavalieri, D. J. and Parkinson, C. L.: Antarctic sea ice variability and trends, 1979–2006, J.
Geophys. Res., 113, C07004, doi:10.1029/2007JC004564, 2008.
25
ESSDD
6, 95–117, 2013A long-term and reproducible passive
microwave sea ice concentration CDR
G. Peng et al.
Title Page
Abstract Instruments
Data Provenance & Structure
Tables Figures
◭ ◮
◭ ◮
Back Close
Full Screen / Esc
Printer-friendly Version
Interactive Discussion
Discussion
P
a
per
|
Dis
cussion
P
a
per
|
Discussion
P
a
per
|
Discussio
n
P
a
per
|
Cavalieri, D. J., Parkinson, C. L., Gloersen, P., and Zwally, H. J.: Sea Ice Concentrations from Nimbus-7 SMMR and DMSP SSM/I-SSMIS Passive Microwave Data. 1978–2007, National Snow and Ice Data Center, Boulder, Colorado, USA, 1996 (updated yearly).
Cavalieri, D. J., Parkinson, C. L., Gloersen, P., Comiso, J. C., and Zwally, H. J.: Deriving long-term time series of sea ice cover from satellite passive-microwave multisensor data sets, J.
5
Geophys. Res., 104, 15803–15814, 1999.
Climate Data Record Program (CDRP): Sea Ice Concentration Merged Microwave Climate Data Record (CDR) Maturity Matrix, CDRP-MM-0153 Rev 2, Asheville, North Carolina, USA, 2011a.
Climate Data Record Program (CDRP): Transitioning CDRs from Research to Operations,
10
NOAA’s NCDC CDR Program, CDRP-PLAN-0017, Asheville, North Carolina, USA, 28 pp., 2011b.
Climate Data Record Program (CDRP): NetCDF Metadata Guidelines for IOC NOAA Climate Data Records, NOAA’s NCDC CDR Program, CDRP-GUID-0042, Asheville, North Carolina, USA, 22 pp., 2011c.
15
Comiso, J. C.: Characteristics of Arctic Winter Sea Ice from Satellite Multispectral Microwave Observations, J. Geophys. Res., 91, 975–994, 1986.
Comiso, J. C.: Bootstrap Sea Ice Concentrations from Nimbus-7 SMMR and DMSP SSM/I-SSMIS, Version 2. 1978–2007. National Snow and Ice Data Center, Boulder, Colorado, USA, 2000 (updated 2012).
20
Comiso, J. C. and Nishio, F.: Trends in the sea ice cover using enhanced and compatible AMSR-E, SSM/I, and SMMR data, J. Geophys. Res., 113, C02S07, doi:10.1029/2007JC004257, 2008.
Drobot, S. and Anderson, M.: Comparison of Interannual Snowmelt Onset Dates with Atmo-spheric Conditions, Ann. Glaciol., 33, 79–84, 2001.
25
Gloersen, P., Campbell, W. J., Cavalieri, D. J., Comiso, J. C., Parkinson, C. L., and Zwally, H. J.: Arctic and Antarctic sea ice, 1978-1987: Satellite passive-microwave observations and analysis, NASA Spec. Publ., 511, 290 pp., 1993.
Markus, T., Stroeve, J. C., and Miller, J.: Recent changes in Arctic sea ice melt onset, freezeup, and melt season length, J. Geophys. Res., 114, C12024, doi:10.1029/2009JC005436, 2009.
30
ESSDD
6, 95–117, 2013A long-term and reproducible passive
microwave sea ice concentration CDR
G. Peng et al.
Title Page
Abstract Instruments
Data Provenance & Structure
Tables Figures
◭ ◮
◭ ◮
Back Close
Full Screen / Esc
Printer-friendly Version
Interactive Discussion
Discussion
P
a
per
|
Dis
cussion
P
a
per
|
Discussion
P
a
per
|
Discussio
n
P
a
per
|
Maslanik, J., Stroeve, J. C., Fowler, C., and Emery, W.: Distribution and trends in Arctic sea ice age through spring 2011, Geophys. Res. Lett., 38, L13502, doi:10.1029/2011GL047735, 2011.
Meier, W. N., Savoie, M., and Mallory, S.: CDR Climate Algorithm and Theoretical Basis Doc-ument: Passive Microwave Sea Ice Concentration, NOAA’s NCDC CDR Program,
CDRP-5
ATBD-0107, Asheville, North Carolina, USA, 57 pp., 2011.
Meier, W. N., Peng, G., Scott, D. J., and Savoie, M. H.: Evaluation of a passive microwave sea ice concentration climate data record, Polar Research, submitted, 2013.
National Research Council (NRC) of the National Academies: Climate Data Records from Envi-ronmental Satellites: Interim Report, National Academies Press, Washington, DC, USA, 150
10
pp., 2004.
Pearson, F.: Map projections: Theory and applications, CRC Press, Boca Raton, Florida, USA, 232 pp., 1990.
Peng, G. and Meier, W. N.: Characterization of a satellite-based passive microwave sea ice con-centration climate data record, Extended abstract to International Geoscience and Remote
15
Sensing Symposium (IGARSS), Melbourne, Australia, 2013.
Snyder, J. P.: Map projections – a working manual, US Geological Survey Professional Paper
1395, US Government Printing Office, Washington, DC, USA, 383 pp., 1987.
Stroeve, J. C., Holland, M. M., Meier, W., Scambos, T., and Serreze, M.: Arctic sea ice decline: Faster than forecast, Geophys. Res. Lett., 34, L09501, doi:10.1029/2007GL029703, 2007.
20
Stroeve, J. C., Kattsov, V., Barrett, A., Serreze, M., Pavlova, T., Holland, M., and Meier, W. N.: Trends in Arctic sea ice extent from CMIP5, CMIP3 and observations, Geophys. Res. Lett., 39, L16502, doi:10.1029/2012GL052676, 2012.
Wentz, F. J., Ricciardulli, L., Hilburn, K. A., and Mears, C. A.: How much more rain will global warming bring?, Science, 317, 233–235 (the supplementary material is online at http://www.
25
ESSDD
6, 95–117, 2013A long-term and reproducible passive
microwave sea ice concentration CDR
G. Peng et al.
Title Page
Abstract Instruments
Data Provenance & Structure
Tables Figures
◭ ◮
◭ ◮
Back Close
Full Screen / Esc
Printer-friendly Version
Interactive Discussion
Discussion
P
a
per
|
Dis
cussion
P
a
per
|
Discussion
P
a
per
|
Discussio
n
P
a
per
|
Table 1.Sources and attributes of passive microwave sensors for NOAA/NSIDC sea ice con-centration CDR.
Satellite Sensor Data Period∗ Swath Width (km)
DMSP F-8 SSM/I 7/9/87–12/30/91 1400
DMSP F-11 SSM/I 12/3/91–9/30/95 1400
DMSP F-13 SSM/I 5/3/95–12/31/07 1400
ESSDD
6, 95–117, 2013A long-term and reproducible passive
microwave sea ice concentration CDR
G. Peng et al.
Title Page
Abstract Instruments
Data Provenance & Structure
Tables Figures
◭ ◮
◭ ◮
Back Close
Full Screen / Esc
Printer-friendly Version
Interactive Discussion
Discussion
P
a
per
|
Dis
cussion
P
a
per
|
Discussion
P
a
per
|
Discussio
n
P
a
per
|
Table 2.The basic statistics of CDR and GSFC sea ice extents (million square kilometers).
Northern Hemisphere Southern Hemisphere
CDR GSFC CDR GSFC
Mean 12.076 11.975 12.179 12.225
SD 2.92 2.96 5.64 5.64
Bias 0.100 −0.0458
RMS 0.085 0.050
ESSDD
6, 95–117, 2013A long-term and reproducible passive
microwave sea ice concentration CDR
G. Peng et al.
Title Page
Abstract Instruments
Data Provenance & Structure
Tables Figures
◭ ◮
◭ ◮
Back Close
Full Screen / Esc
Printer-friendly Version
Interactive Discussion
Discussion
P
a
per
|
Dis
cussion
P
a
per
|
Discussion
P
a
per
|
Discussio
n
P
a
per
|
Climate Data Record – Passive Microwave Sea Ice Concentration (%)
09/05/1987 09/23/1997 09/16/2007
ESSDD
6, 95–117, 2013A long-term and reproducible passive
microwave sea ice concentration CDR
G. Peng et al.
Title Page
Abstract Instruments
Data Provenance & Structure
Tables Figures
◭ ◮
◭ ◮
Back Close
Full Screen / Esc
Printer-friendly Version
Interactive Discussion
Discussion
P
a
per
|
Dis
cussion
P
a
per
|
Discussion
P
a
per
|
Discussio
n
P
a
per
|
Fig. 3.Schematic of grid cell values used in calculation of the CDR standard deviation field. All
non-missing ocean/sea ice concentration values (C), from both the NASA Team and Bootstrap
ESSDD
6, 95–117, 2013A long-term and reproducible passive
microwave sea ice concentration CDR
G. Peng et al.
Title Page
Abstract Instruments
Data Provenance & Structure
Tables Figures
◭ ◮
◭ ◮
Back Close
Full Screen / Esc
Printer-friendly Version
Interactive Discussion
Discussion
P
a
per
|
Dis
cussion
P
a
per
|
Discussion
P
a
per
|
Discussio
n
P
a
per
|
–
Fig. 4.The scatter-diagram of sea ice extents (million square kilometers) based on monthly CDR and GSFC (20 yr from January 1988 to December 2007). Left panel is for the Northern and the right is for Southern Hemisphere.
ESSDD
6, 95–117, 2013A long-term and reproducible passive
microwave sea ice concentration CDR
G. Peng et al.
Title Page
Abstract Instruments
Data Provenance & Structure
Tables Figures
◭ ◮
◭ ◮
Back Close
Full Screen / Esc
Printer-friendly Version
Interactive Discussion
Discussion
P
a
per
|
Dis
cussion
P
a
per
|
Discussion
P
a
per
|
Discussio
n
P
a
per
|
–
ESSDD
6, 95–117, 2013A long-term and reproducible passive
microwave sea ice concentration CDR
G. Peng et al.
Title Page
Abstract Instruments
Data Provenance & Structure
Tables Figures
◭ ◮
◭ ◮
Back Close
Full Screen / Esc
Printer-friendly Version
Interactive Discussion
Discussion
P
a
per
|
Dis
cussion
P
a
per
|
Discussion
P
a
per
|
Discussio
n
P
a
per
|
Fig. 6.Annual mean CDR sea ice extent from 1988 to 2007 (red circles), with the linear
regres-sion±1 standard deviation of the annual mean sea ice extent (black and grey dashed lines,
ESSDD
6, 95–117, 2013A long-term and reproducible passive
microwave sea ice concentration CDR
G. Peng et al.
Title Page
Abstract Instruments
Data Provenance & Structure
Tables Figures
◭ ◮
◭ ◮
Back Close
Full Screen / Esc
Printer-friendly Version
Interactive Discussion
Discussion
P
a
per
|
Dis
cussion
P
a
per
|
Discussion
P
a
per
|
Discussio
n
P
a
per
|