Applying Enhancement Filters in the Pre-processing
of Images of Lymphoma
S´ergio Henrique Silva1
, Marcelo Zanchetta do Nascimento2
, Leandro Alves Neves3, Val´erio Ramos Batista4
1
Faculty of Mechanical Engineering, Federal University of Uberlˆandia (UFU), Uberlˆandia, MG, Brazil
2
Faculty of Computer Science, Federal University of Uberlˆandia (UFU), Uberlˆandia, MG, Brazil
3
Institute of Biosciences, Literature and Exact Sciences, Department of Computer Science and Statistics, S˜ao Paulo State University (UNESP), S˜ao Jos´e do Rio Preto, SP, Brazil
4
Mathematics, Computer Science and Cognition Centre, Federal University of ABC (UFABC), Santo Andr´e, SP, Brazil
E-mail: [email protected]
Abstract. Lymphoma is a type of cancer that affects the immune system, and is classified as Hodgkin or non-Hodgkin. It is one of the ten types of cancer that are the most common on earth. Among all malignant neoplasms diagnosed in the world, lymphoma ranges from three to four percent of them. Our work presents a study of some filters devoted to enhancing images of lymphoma at the pre-processing step. Here the enhancement is useful for removing noise from the digital images. We have analysed the noise caused by different sources like room vibration, scraps and defocusing, and in the following classes of lymphoma: follicular, mantle cell and B-cell chronic lymphocytic leukemia. The filters Gaussian, Median and Mean-Shift were applied to different colour models (RGB, Lab and HSV). Afterwards, we performed a quantitative analysis of the images by means of the Structural Similarity Index. This was done in order to evaluate the similarity between the images. In all cases we have obtained a certainty of at least 75%, which rises to 99% if one considers only HSV. Namely, we have concluded that HSV is an important choice of colour model at pre-processing histological images of lymphoma, because in this case the resulting image will get the best enhancement.
1. Introduction
The non-Hodgkin lymphoma is a diversified group of neoplasm that appears in the lymphocyte. This kind of lymphoma is estimated to happen in 10 out of 100 thousand people, but this number has been increasing about 4% yearly. According to [1], some of the reasons for this increase are the improvement in diagnostic methods, preciser morphological classifications and better health information systems.
This neoplasm does not follow a characteristic histological pattern, and it also grows with an altering cyclical behaviour. Diagnosing the non-Hodgkin lymphoma is therefore a difficult task [2]. Normally, diagnoses and prognoses are based upon histological analyses of the lymph nodes. The analyses are carried out by specialists that evaluate morphological and non-morphological characteristics of samples observed through the microscope. The main pieces of information they collect are: arrangement and quantity of centrocytes and centroblasts, internal characteristics
IC-MSQUARE 2014 IOP Publishing
Journal of Physics: Conference Series574(2015) 012122 doi:10.1088/1742-6596/574/1/012122
Content from this work may be used under the terms of theCreative Commons Attribution 3.0 licence. Any further distribution of this work must maintain attribution to the author(s) and the title of the work, journal citation and DOI.
of the cells, and tissue patterns [3]. The main neoplasms analysed by specialists are: Follicular Lymphoma (FL), Mantle Cell Lymphoma (MCL) and B-cell Chronic Lymphocytic Leukemia, also known as Chronic Lymphoid Leukemia (CLL).
Light microscopes enable the specialists to get fairly detailed information from the lymph nodes. These microscopes are equipped with digital cameras that render pictures on which image processing techniques can be applied in order to build a Computer-Aided Diagnosis (CAD). Such computational systems help specialists achieve a preciser diagnosis [4].
Together with that cutting-edge equipment, in the literature we cite [5] and [6] as works devoted to building CAD schemes applied to images of lymph nodes. Nonetheless, specialists still face a relevant problem that compromises a reliable diagnosis: the presence ofnoisein many digital images.
Indeed, the first problem is room vibration occasionally caused by external factors. Even if not perceptible they compromise the quality of the digital images rendered by camera and light microscope, which are highly sensitive. The second are scraps in the samples, and the third is defocusing, because it is not always easy to find the best calibration of the microscope to photographing. These and other problems were discussed in [7] but there the authors do not propose filters to fix them.
Of course, specialists can detect such problems in digital images. The ones that present best quality have been selected in databanks like [8] for scientific research. They are used as reference for many studies, and one of them is the analysis of filter performance. Filters of general purpose were discussed in [9]. Many of them have been implemented in Matlab toolboxes. Our work is devoted to evaluating three of these filters applied to images of lymphoma at the pre-processing step. The filters are Gaussian, Median and Mean-Shift.
In order to study their performance we have taken 48 images from [8] as reference. They were perturbed by an image manipulation program in order to simulate the aforementioned noises. The three filters were then applied to different colour models of the perturbed images (RGB, Lab and HSV). Afterwards, we carried out a quantitative analysis between the original and filtered images by means of the Structural Similarity (SSIM) Index. In all cases we have obtained a certainty of at least 75%, which rises to 99% if one considers only HSV. The 48 images consist of 16 of FL, 16 of MCL and 16 of CLL.
2. Methodology
2.0.1. Image Databank We have used the image databank [8], which was assembled after many studies carried out by researchers at the National Cancer Institute and the National Institute on Aging, both in the United States. A total of 30 histological slides were photographed, all of lymph nodes stained with Haematoxylin and Eosin. The aforementioned 48 images were obtained from this setting.
2.0.2. Colour Models With three colour models we could evaluate the influence of noise and of enhancement filters in the images. RGB is based on a cartesian cube whose points (R, G, B) have each of their coordinates varying in the interval [0,1]. HSV is defined by hue, saturation and value (of brightness), whereas Lab consists of lightness and the two components (a, b) of chrominance. See [9] for details. According to [10–12] among all colour models these three have been the most successful ones when applied to histological images.
2.0.3. Noise We have followed [9] in order to simulate noise. Defocusing was obtained via cyclic convolution. Thesliding neighbourhood operationon the image produced fuzziness, which in practice is caused by room vibration. Finally, salt and pepper simulated scraps.
For defocusing we applied a radius of 10 pixels, and for fuzziness a kernel of 21×21 pixels. Salt and pepper were sprinkled to a density of 0.02.
IC-MSQUARE 2014 IOP Publishing
Journal of Physics: Conference Series574(2015) 012122 doi:10.1088/1742-6596/574/1/012122
2.0.4. Enhancement Filters The Median Filter replaces each pixel of an image with a median of its surrounding pixels. In our work we have applied a punched square A of 3×3 pixels in order to determine its centre x by
x= Med{A}, (1)
where Med is the median of the elements in A.
In the Gaussian filter the coefficients are obtained from a two-dimensional Gaussian function. The discrete Gaussian function with zero mean and standard deviationσ is given by
G(x, y) = 1 2πσ2exp
−x
2 +y2 2σ2
, (2)
where (x, y) is the input mask position andG(x, y) is the resulting new value for the (x, y)-pixel. Finally, the Mean-Shift filter locates the maxima of a density function through a non-parametric feature-space technique. Details are omitted here but the reader can find them in [9].
3. Results
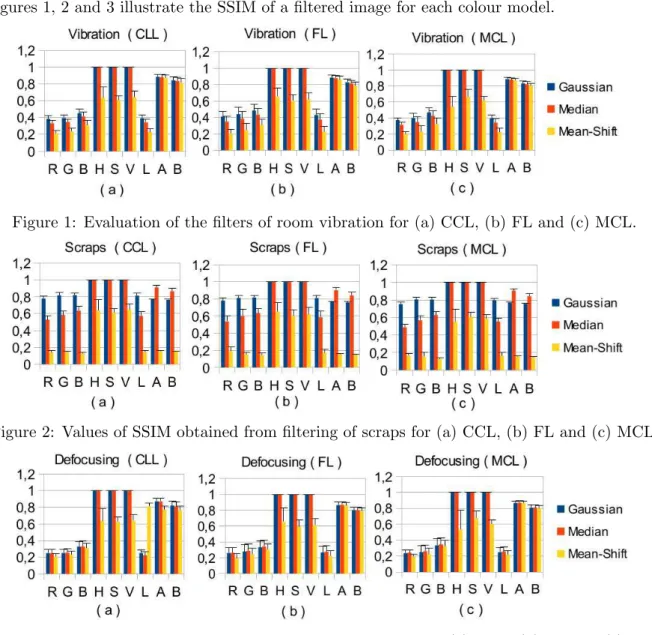
Figures 1, 2 and 3 illustrate the SSIM of a filtered image for each colour model.
Figure 1: Evaluation of the filters of room vibration for (a) CCL, (b) FL and (c) MCL.
Figure 2: Values of SSIM obtained from filtering of scraps for (a) CCL, (b) FL and (c) MCL.
Figure 3: Values of SSIM obtained from filtering of defocusing of (a) CCL, (b) FL and (c) MCL.
IC-MSQUARE 2014 IOP Publishing
Journal of Physics: Conference Series574(2015) 012122 doi:10.1088/1742-6596/574/1/012122
An SSIM of almost 100% was achieved by the Gaussian and Median filters for both H and S channels in the three classes of lymphoma. This contrasts with channel V, of which the performance was no greater than 70%. By the way, in all but one of our experiments the Mean-Shift filter showed poorer performance than either the Gaussian or the Median filter, for all colour models and channels. The only exception was for the noise due to defocusing of CLL in the Lab-model, where the SSIM achieved 80% (much higher than the approximate 20% of both Gaussian and Median filters).
Filtering with RGB for room vibration gave an SSIM below 60% in all three classes of lymphoma. Nevertheless, for some channels of the other colour models the SSIM was quite above that.
In the case of noise due to scraps some channels of RGB and Lab achieved an SSIM around 80%, but HSV still had the best performance. The lowest values of SSIM came from RGB when applied to filtering noise due to defocusing. These remained below 40% in any of the three channels.
4. Conclusions
We have presented a study of comparisons between the performance of enhancement filters for different noises in histological images. In our study we considered the classes of cancer in these images separately. The chosen colour models (RGB, HSV and Lab) are the ones that have been mostly used in the literature for histological images. This is because of the successful results that they have been showing for such kind of images. In our study we concluded that the HSV model has the best performance at filtering noise of different kinds for all the images of lymphoma.
References
[1] Boyle P, Levin Bet al.2008World cancer report 2008.(IARC Press, International Agency for Research on Cancer)
[2] Wright D H, Addis B J and Leong A 2011Diagnostic Lymph Node Pathology-9780340990681-182, 45
[3] Swerdllow S, Campo E and Harris N L 2008WHO classification of tumours of haematopoietic and lymphoid tissues(France: IARC Press, 2008)
[4] Gurcan M, Boucheron L, Can A, Madabhushi A, Rajpoot N and Yener B 2009 Biomedical Engineering, IEEE Reviews in 2147–171
[5] Oger M, Belhomme P and Gurcan M N 2012Computerized Medical Imaging and Graphics
[6] Belkacem-Boussaid K, Prescott J, Lozanski G and Gurcan M N 2010SPIE Medical Imaging (International Society for Optics and Photonics) pp 762436–762436
[7] Khan A, Rajpoot N, Treanor D and Magee D 2014 IEEE Transactions on Bio-medical Engineering 61
1729–1738
[8] Orlov N V, Chen W W, Eckley D M, Macura T J, Shamir L, Jaffe E S and Goldberg I G 2010Trans. Info. Tech. Biomed.141003–1013 ISSN 1089-7771 URLhttp://dx.doi.org/10.1109/TITB.2010.2050695 [9] Gonzalez R C and Woods R E 2006Digital Image Processing (3rd Edition)(Upper Saddle River, NJ, USA:
Prentice-Hall, Inc.) ISBN 013168728X
[10] Sertel O, Kong J, Lozanski G, Shana’ah A, Catalyurek U, Saltz J and Gurcan M 2008Acoustics, Speech and Signal Processing, 2008. ICASSP 2008. IEEE International Conference on (IEEE) pp 597–600
[11] Kong H, Gurcan M and Belkacem-Boussaid K 2011Medical Imaging, IEEE Transactions on 301661–1677 [12] Irshad H, Veillard A, Roux L and Racoceanu D 2014Biomedical Engineering, IEEE Reviews in 797–114
ISSN 1937-3333
IC-MSQUARE 2014 IOP Publishing
Journal of Physics: Conference Series574(2015) 012122 doi:10.1088/1742-6596/574/1/012122