HESSD
9, 7591–7611, 2012Water discharge estimates in the
Amazon basin
A. C. V. Getirana and C. Peters-Lidard
Title Page
Abstract Introduction
Conclusions References
Tables Figures
◭ ◮
◭ ◮
Back Close
Full Screen / Esc
Printer-friendly Version Interactive Discussion
Discussion
P
a
per
|
Dis
cussion
P
a
per
|
Discussion
P
a
per
|
Discussio
n
P
a
per
|
Hydrol. Earth Syst. Sci. Discuss., 9, 7591–7611, 2012 www.hydrol-earth-syst-sci-discuss.net/9/7591/2012/ doi:10.5194/hessd-9-7591-2012
© Author(s) 2012. CC Attribution 3.0 License.
Hydrology and Earth System Sciences Discussions
This discussion paper is/has been under review for the journal Hydrology and Earth System Sciences (HESS). Please refer to the corresponding final paper in HESS if available.
Water discharge estimates from large
radar altimetry datasets in the Amazon
basin
A. C. V. Getirana and C. Peters-Lidard
Hydrological Sciences Laboratory, NASA Goddard Space Flight Center, Greenbelt, USA
Received: 28 May 2012 – Accepted: 2 June 2012 – Published: 14 June 2012
Correspondence to: A. C. V. Getirana ([email protected])
HESSD
9, 7591–7611, 2012Water discharge estimates in the
Amazon basin
A. C. V. Getirana and C. Peters-Lidard
Title Page
Abstract Introduction
Conclusions References
Tables Figures
◭ ◮
◭ ◮
Back Close
Full Screen / Esc
Printer-friendly Version Interactive Discussion
Discussion
P
a
per
|
Dis
cussion
P
a
per
|
Discussion
P
a
per
|
Discussio
n
P
a
per
|
Abstract
In this study, we evaluate the use of a large radar altimetry dataset as a complemen-tary gauging network capable of providing water discharge in ungauged regions within the Amazon basin. A rating-curve-based methodology is adopted to derive water dis-charge from altimetric data provided by Envisat at 444 virtual stations (VS). The
stage-5
discharge relations at VS are built based on radar altimetry and outputs from a global flow routing scheme. In order to quantify the impact of modeling uncertainties on rating-curve based discharges, another experiment is performed using simulated discharges derived from a simplified data assimilation procedure. Discharge estimates at 90 VS are evaluated against observations during the curve fitting calibration (2002–2005) and
10
evaluation (2006–2008) periods, resulting in mean relative RMS errors as high as 52 % and 12 % for experiments without and with assimilation, respectively. Without data as-similation, uncertainty of discharge estimates can be mostly attributed to forcing errors at smaller scales, generating a positive correlation between performance and drainage area. Mean relative errors (RE) of altimetry-based discharges varied from 15 % to 92 %
15
for large and small drainage areas, respectively. Rating curves produced a mean RE of 54 % versus 68 % from model outputs. Assimilating discharge data decreases the mean RE from 68 % to 12 %. These results demonstrate the feasibility of applying the proposed methodology to the regional or global scales. Also, it is shown the potential of satellite altimetry for predicting water discharge in poorly-gauged and ungauged river
20
basins.
1 Introduction
In the last decades, the hydrological sciences community has experienced significant advances in the understanding of water storage and transport over the continents using remote sensing data. In particular, radar altimetry, firstly designed to monitor
25
HESSD
9, 7591–7611, 2012Water discharge estimates in the
Amazon basin
A. C. V. Getirana and C. Peters-Lidard
Title Page
Abstract Introduction
Conclusions References
Tables Figures
◭ ◮
◭ ◮
Back Close
Full Screen / Esc
Printer-friendly Version Interactive Discussion
Discussion
P
a
per
|
Dis
cussion
P
a
per
|
Discussion
P
a
per
|
Discussio
n
P
a
per
|
understanding of inland water fluxes worldwide. It has been shown that radar altimetry, in the form of virtual stations, or VS (location where satellite ground tracks transect open-water surfaces), can significantly contribute to the monitoring of poorly gauged or ungauged areas. Most applications have attempted to retrieve water discharges from stage-discharge relations derived from altimetric data and observed discharges from
5
gauging stations located in the vicinity of the VS. These relations are commonly repre-sented by rating curves and allow one to predict water discharges from observed water levels, with accuracy varying as a function of input data and flow regime characteristics. As examples, river discharges have been estimated from altimetric data in the Chari River (Coe and Birkett, 2004), Ob River (Kouraev et al., 2004), Ganges-Brahmaputra
10
Rivers (Papa et al., 2010), Amazon River (Zakharova et al., 2006) and Zambezi River (Michailovsky et al., 2012). Although errors between predicted and observed water dis-charges are relatively small in most applications, the use of such methods is restricted to VS located near gauging stations. Some studies preparing for the upcoming Sur-face Water Ocean Topography Mission (SWOT; Alsdorf et al., 2007) have combined
15
virtual swath altimetric measurements with hydrodynamic models using data assim-ilation methods in order to improve modeled depth and discharge on river reaches (e.g., Andreadis et al., 2007). These studies show the potential of upcoming altimetric measurements, but the application of the proposed techniques implies that bathymetry must be known. Recent works in the Amazon basin have addressed these limitations
20
(need for observed discharges and river cross sectional information at VS) by using discharge estimates derived from routing schemes and rainfall-runoff models at the regional scale (Leon et al., 2006; Getirana et al., 2009). These approaches allow one to take advantage of larger radar altimetry datasets. On the other hand, they are con-strained by uncertainties of simplified model representations of physical processes and
25
input forcings.
HESSD
9, 7591–7611, 2012Water discharge estimates in the
Amazon basin
A. C. V. Getirana and C. Peters-Lidard
Title Page
Abstract Introduction
Conclusions References
Tables Figures
◭ ◮
◭ ◮
Back Close
Full Screen / Esc
Printer-friendly Version Interactive Discussion
Discussion
P
a
per
|
Dis
cussion
P
a
per
|
Discussion
P
a
per
|
Discussio
n
P
a
per
|
for about 15 % of the water flow from continents to oceans, it is poorly gauged and its hydrological processes are still unknown in many areas at the meso and regional scales. Taking advantage of da Silva’s et al. dataset, the present study extends the application of the rating curve approach for discharge forecasts at the large scale, in-vestigating whether is possible to predict water discharges from current large scale
5
radar altimetry datasets based on rating curves and quantifying the accuracy of re-trieved discharge estimates. Specifically, this study evaluates a methodology where stage-discharge relations are based on rating curves derived from Envisat data and simulated discharges provided by the Hydrological Modeling and Analysis Platform (HyMAP) flow routing scheme (Getirana et al., 2012) coupled in off-line mode with
10
the Interactions Sol-Biosph `ere-Atmosph `ere (ISBA) (Noilhan and Mahfouf, 1996) land surface model (LSM). The results of this study point toward a general methodology capable of predicting water discharges at the continental or global scale from the next generation of satellite missions such as the SWOT mission.
2 The stage-discharge relation 15
The stage-discharge relation is a hydraulic property of a river reach or cross section and it is unknown a priori. The hydrologist must define it based on an approximated representation by a rating curve, traditionally built based on in situ measures and sup-ported by the analysis of streamflow parameters (Jaccon and Cudo, 1989). In general, the rating curve of a specific river location can be expressed by mathematical
expres-20
sions representing successive linear reaches or curves. The most frequently used form is the exponential one defined as Q=a·hb, where Q [m3s−1] is the estimated dis-charge andh[m] the water depth related to a given zero-flow-equivalent water height,
z (see below for details). In general, the coefficientareproduces the relief of the river reaches, including surface roughness and sinuosity, andbthe geometry of river banks.
25
HESSD
9, 7591–7611, 2012Water discharge estimates in the
Amazon basin
A. C. V. Getirana and C. Peters-Lidard
Title Page
Abstract Introduction
Conclusions References
Tables Figures
◭ ◮
◭ ◮
Back Close
Full Screen / Esc
Printer-friendly Version Interactive Discussion
Discussion
P
a
per
|
Dis
cussion
P
a
per
|
Discussion
P
a
per
|
Discussio
n
P
a
per
|
b=5/3, whereSois the river slope andnthe river flow roughness coefficient. However, as in most applications, a and b are estimated by curve-fitting, and they do not nec-essarily represent their physical characteristics. Due to changes in the river geometry, rating curves must be updated periodically. Also, scatter around the curve can exist as the relation is derived from approximations of observations. Errors can be in the order
5
of 10–15 %, varying as a function of the river geometry, numerical approximation and quantity and quality of measurements.
Radar altimetry provides us with the height, H [m], which represents the instanta-neous measurement of the Earth’s surface height referenced to a specified ellipsoid. In this sense,H corresponds to the height of the reflecting surface that receives and
10
reflects the satellite radar echoes. The river depthhcan be derived fromH by subtract-ing the mean river bed elevation, or the zero-flow water height,z(h=H−z). This leads
to the general formulation of the rating curve equation defined as
Q=a·(H−z)b (1)
However, as in most cases, the zero-flow water height z is an unknown variable.
15
A straightforward way to estimate this parameter is by minimizing errors of curve-fitting between stage and discharge observations at a given location and period using the linear form of Eq. (1):
ln(Q)=ln(a)+b·ln(H−z) (2)
3 Methods
20
The methodology used to predict water discharges is based on rating curve fitting by combining radar altimetry with simulated discharges in Eq. (2). Maximizing the coef-ficient of determination,R2 , is performed to optimize z and parametersa and b. R2
is computed for the best fit betweenQ and H−z, as denoted by Eq. (2), and ranges
between zero and 1, where 1 represents the optimal value. For a givenz,aand bare
HESSD
9, 7591–7611, 2012Water discharge estimates in the
Amazon basin
A. C. V. Getirana and C. Peters-Lidard
Title Page
Abstract Introduction
Conclusions References
Tables Figures
◭ ◮
◭ ◮
Back Close
Full Screen / Esc
Printer-friendly Version Interactive Discussion
Discussion
P
a
per
|
Dis
cussion
P
a
per
|
Discussion
P
a
per
|
Discussio
n
P
a
per
|
estimated by a linear statistical regression. Exploring the range of possible values ofz
allows the functionR2=f(z) to be built up. In cases where convergence is not reached, i.e.,R2=f(z=∞), the search procedure stops when a differentialR2(dR2) between two search steps is equal or less than 10−6. These cases will be called “non-converging curve fittings” hereafter (and the opposite case “converging curve fittings”).
5
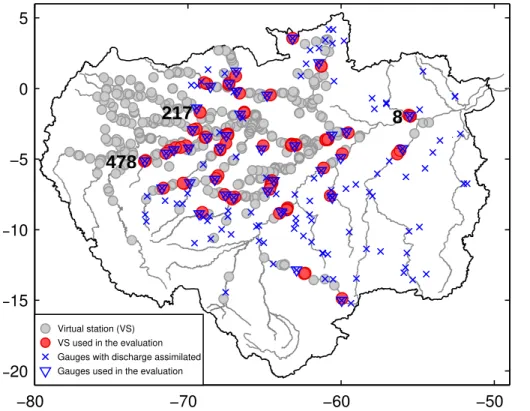
The current Envisat radar altimetry dataset covers several large rivers, lakes and floodplains within the Amazon basin, being composed of over 1500 VS. After selec-tion of VS located over rivers with sufficiently long and consistent time series, 444 VS remained (see Fig. 1 for the spatial distribution of VS). The ranges used in this study are those issued by the ICE-1 algorithm (Bamber, 1994). Absolute errors of
al-10
timetric time series within the Amazon basin are in the order of tens of centimeters (da Silva et al., 2010). Selected VS cover most Amazon River’s tributaries and other small rivers, with drainage areas ranging from 10 000 km2to 5 238 800 km2. Time series length varies from 23 to 63 altimetric observations for the 2002–2009 period. Details about the data extraction, retracking and evaluation against in situ observations are
15
reported in da Silva et al. (2010). In this study, the water heights provided by Envisat were converted to altitudes using the GRACE static solution of GGM02C geoid model (Tapley et al., 2004).
Simulated discharges (Qsim) are provided at a daily time step and 0.25 ◦
spatial res-olution by HyMAP, coupled in off-line mode with ISBA (Noilhan and Mahfouf, 1996).
20
HyMAP is a global scale flow routing scheme capable of simulating flow velocity, wa-ter discharge, depth and storage in rivers and floodplains, among other hydrological variables. The runoffand baseflow generated by ISBA (see Decharme et al., 2011, for a full description of ISBA parameterization and forcings) are routed using a kinematic wave formulation through a prescribed river network to oceans or inland seas. Details
25
HESSD
9, 7591–7611, 2012Water discharge estimates in the
Amazon basin
A. C. V. Getirana and C. Peters-Lidard
Title Page
Abstract Introduction
Conclusions References
Tables Figures
◭ ◮
◭ ◮
Back Close
Full Screen / Esc
Printer-friendly Version Interactive Discussion
Discussion
P
a
per
|
Dis
cussion
P
a
per
|
Discussion
P
a
per
|
Discussio
n
P
a
per
|
large basins (A >106km2) to 1.105 (∼110 %) for smaller areas (A <105km2). RE val-ues are closely related to the vertical water balance, which is highly sensitive to precipi-tation and LSM parameterization. Altimetric data was combined to simulated discharge at grid cells representing the river reaches where virtual stations are located.
Two experiments were performed in order to evaluate the impacts of simulated
dis-5
charge uncertainties on rating curve fitting. The first one uses simulated discharge from the standard HyMAP model configuration as described in Getirana et al. (2012). The second one takes advantage of the assimilation of observed daily discharges (Qobs) at 135 gauging stations (see spatial distribution of stations in Fig. 1) during the HyMAP run by directly replacing simulated discharges by observations at the outlet of the
cor-10
responding grid cells. Gauging stations are operated by the Brazilian Water Agency (ANA) and have at least one year of observed discharges within the study period. The discharge data assimilation assures that uncertainties in the curve fitting at VS located near gauging stations are mainly due to altimetric data rather than discharge. Finally, two different discharge forecasts can be provided by rating curves at each VS: (1)
dis-15
charge derived from curve fitting without assimilation (Qrc0); and (2) with assimilation (Qrc1). Curve fitting was performed during the 2002–2005 calibration period for the whole set of VS. However, only 90 VS located near gauging stations had discharge forecasts compared against observations. In order to quantify the impacts of radar al-timetry data on discharge forecast from rating curves, Hsat at these same selected
20
virtual stations was compared to stage observations for both calibration and validation periods. The distances between the selected VS and gauging stations do not exceed 30 km. Based on the geographical proximity, it was considered that these stations have the same hydrological response, since the incremental area within the reaches are ir-relevant if compared to the total drainage areas upstream the stations. The evaluation
25
HESSD
9, 7591–7611, 2012Water discharge estimates in the
Amazon basin
A. C. V. Getirana and C. Peters-Lidard
Title Page
Abstract Introduction
Conclusions References
Tables Figures
◭ ◮
◭ ◮
Back Close
Full Screen / Esc
Printer-friendly Version Interactive Discussion
Discussion
P
a
per
|
Dis
cussion
P
a
per
|
Discussion
P
a
per
|
Discussio
n
P
a
per
|
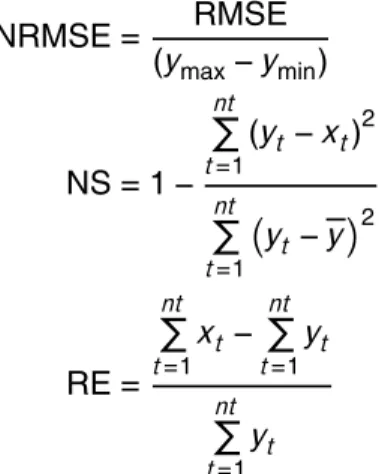
NRMSE= RMSE
(ymax−ymin)
(3)
NS=1−
nt P t=1
(yt−xt) 2
nt P t=1
yt−y2
(4)
RE=
nt P t=1
xt− nt P t=1
yt
nt P t=1
yt
(5)
wheret is the time step, nt the total number of days disposing of observed data, x 5
and y are, respectively, the simulated and target (observed) signals at time step t, andymax,ymin andy are respectively the maximum, minimum and mean values of the target signals for the entire period. NS ranges from −∞to 1, where 1 is the optimal
case and zero is when simulations represent observed signals as well as the mean value. NRMSE and RE vary from zero to+∞, where zero is the optimal case. One can
10
obtain NRMSE and RE values in percentage by multiplying them by 100.
4 Results and discussion
4.1 Curve fitting
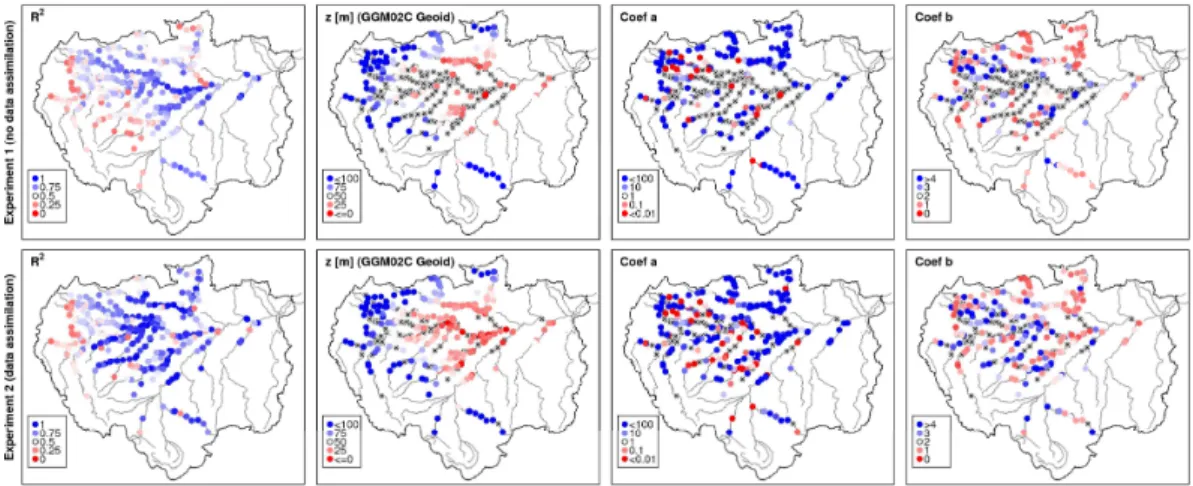
Figure 2 shows the spatial distribution ofR2values and curve coefficients (a,bandz) derived from the calibration procedure for both experiments. From a total of 444 VS,
15
HESSD
9, 7591–7611, 2012Water discharge estimates in the
Amazon basin
A. C. V. Getirana and C. Peters-Lidard
Title Page
Abstract Introduction
Conclusions References
Tables Figures
◭ ◮
◭ ◮
Back Close
Full Screen / Esc
Printer-friendly Version Interactive Discussion
Discussion
P
a
per
|
Dis
cussion
P
a
per
|
Discussion
P
a
per
|
Discussio
n
P
a
per
|
dR2≤10−6criterion.R2 values used as the objective function in the calibration varied from 0.21 to 0.95. The meanR2value of converging rating curves was 0.54. Diverging rating curves had a higher meanR2of 0.67 which implies that non-convergence does not necessarily indicate bad curve fitting. This deduction will be addressed in next section.
5
As for experiment 2 (with data assimilation), 304 rating curves converged to optimal
z values, representing an increase of 48 % in comparison with experiment 1. The as-similation of water discharge observations also improvedR2values, varying from 0.21 to∼1. Converging and diverging curve fittings had meanR2 of 0.76 and 0.69,
respec-tively. Improvements are clearly noticed downstream of gauging stations, especially in
10
medium and large rivers. These results demonstrate a significant enhancement in the curve calibration when observed discharges are assimilated into the modeling system. According to Fig. 2, the zero-flow equivalent depth,z, and coefficientsaand bhad similar values for both experiments. Coefficients were omitted at VS where calibration did not converge.z values are physically consistent at VS where the calibration
con-15
verged, ranging from−1.45 m and −5.54 m (experiments 1 and 2, respectively) near ´
Obidos to about 314 m and 313 m in the Western Amazon basin, near the Andes moun-tains. Both coefficientsaandbshowed large ranges. The coefficientavaried from val-ues lower than 10−3to values as high as 103whilebranged from 0.35 to 10. As these values result from an automatic calibration procedure, their physical meanings remain
20
unclear and are not discussed in this study
4.2 Accuracy of discharge forecasts
Tables 1 and 2 list the performance coefficients (NRMSE, RE and NS) used to evaluate the accuracy of discharge estimates provided by the rating curves and modeling during the calibration and validation steps. Coefficients are presented as averages of drainage
25
HESSD
9, 7591–7611, 2012Water discharge estimates in the
Amazon basin
A. C. V. Getirana and C. Peters-Lidard
Title Page
Abstract Introduction
Conclusions References
Tables Figures
◭ ◮
◭ ◮
Back Close
Full Screen / Esc
Printer-friendly Version Interactive Discussion
Discussion
P
a
per
|
Dis
cussion
P
a
per
|
Discussion
P
a
per
|
Discussio
n
P
a
per
|
Although discharge estimates derived from experiment 1 (Qrc0) had overall poor re-sults (NRMSE=28 %, RE=54 % and NS=−3.73), performance coefficients can vary
as a function of the drainage area. Virtual stations with smaller areas had discharge es-timates with low accuracy (52 %, 92 % and−13.45, respectively), while those draining
medium (20 %, 46 % and 0.31) and large areas (13 %, 15 % and 0.76) provided much
5
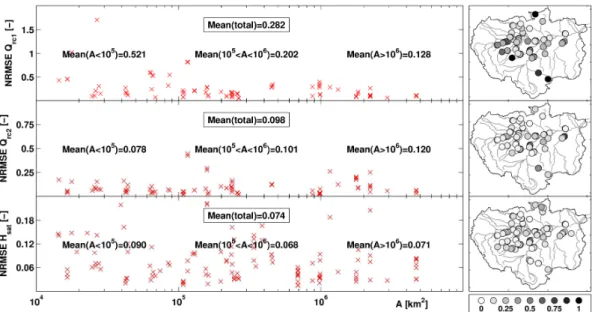
better results. Figure 3 shows NRMSE of selected VS as a function of the drainage area (A). Results of both experiments 1 and 2 are presented for the calibration pe-riod. According to the map in the right side of the figure, a larger concentration of VS with high errors is located in the western side of the basin. These results agree with the spatial distribution of performance coefficients for simulated discharge (Qsim), revealing
10
a positive correlation of 0.26 between the accuracy ofQrc0andQsim.
A substantial improvement is obtained with the assimilation of discharge data into the modeling system performed in experiment 2. The mean values of coefficients NRMSE and RE for the set of 90 VS were reduced to 10 % and 19 %, respectively, and NS had a non-negligible increasing to 0.84. Mean NRMSE values for small, medium and
15
large areas are 7.8 %, 10.1 % and 12 %, respectively. Qrc1 uncertainty can be mostly attributed to radar altimetry errors since curve fitting was performed using observed discharge. Although the NRMSE values of unbiased Envisat water levels can exceed 20 % for a single VS, the mean NRMSE is 7.4 % for all VS within the Amazon basin, varying from about 7 % for VS draining medium and large areas to 9 % for small areas
20
(Fig. 3). Mean NRMSE varies from 8 % up to 12 % in the validation period according to the area threshold.
Another source of errors can be curve approximations. The methodology applied in this study is based on the calibration of coefficients (a,bandz) of a single rating curve by maximizingR2. Rating curves used by ANA may have been built using different
cri-25
teria, including the representation of loop ratings caused by variable backwater effects, which also consider river slope.
HESSD
9, 7591–7611, 2012Water discharge estimates in the
Amazon basin
A. C. V. Getirana and C. Peters-Lidard
Title Page
Abstract Introduction
Conclusions References
Tables Figures
◭ ◮
◭ ◮
Back Close
Full Screen / Esc
Printer-friendly Version Interactive Discussion
Discussion
P
a
per
|
Dis
cussion
P
a
per
|
Discussion
P
a
per
|
Discussio
n
P
a
per
|
In experiment 1, mean NRMSE and RE remained nearly the same (30 % and 53 %, respectively) with minor variation within VS groups. The mean Nash-Sutcliffe coefficient improved (NS=−1.58), explained by the increasing of the performance at VS withA <
105km2. Other groups had NS values lower than those provided by the calibration step. Experiment 2 provided a slightly higher degradation of mean NRMSE and NS (13 %
5
and 0.53, respectively), but RE stayed closely the same (20 %). According to Fig. 3, NRMSE ofHsat is slightly higher in the evaluation period (2006–2008), averaging 9 %. This explains the general increasing of discharge estimate uncertainty in that same period (mean NRMSE values are of 10 % forQrc0and 13 % forQrc1) and demonstrates a general agreement with results derived from the calibration step.
10
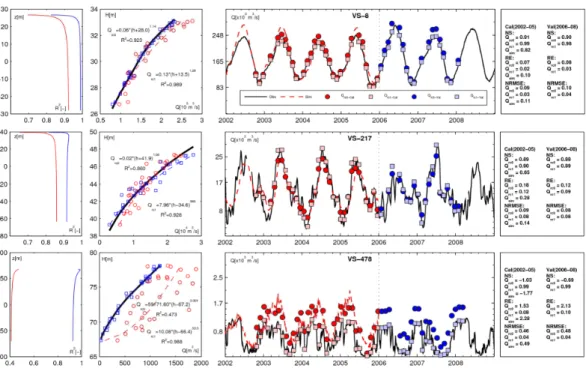
Figure 4 shows results of three VS selected from the dataset, each one representing a group of VS defined by drainage areas (see Fig. 1 for location of virtual stations): vs-8 represents large areas, located in the lower Amazon River near ´Obidos, drains a sur-face of 4.7×10⁵km2with a mean discharge of∼173 000 m3s−1; vs-217 is an example
medium areas (209 200 km2), mean discharge of 13 700 m3s−1, near the Vila
Bitten-15
court station on the Japur ´a River; and vs-479 for small areas (16 000 km2), with mean discharge of 620 m3s−1located near Palmeiras do Javar´ıstation on the Javar´ıRiver. At virtual station vs-8, both curve-fitting experiments did not converge to a feasiblez but the maximumR2values were of 0.98 and 0.92, respectively. The virtual station vs-217 showed a convergingzvalue in the second curve-fitting experiment only (z=34.6 m),
20
but R2 of both experiments were relatively high (0.86 and 0.93, respectively). Finally, vs-478 had convergingz values in both experiments with similar values (67.3 m and 66.5 m, respectively), butR2values significantly different (0.49 and 0.98, respectively). Although the accuracy of curve-based discharge estimates in experiment 1 varied as a function of the drainage area, all the cases provided improved discharges when
com-25
HESSD
9, 7591–7611, 2012Water discharge estimates in the
Amazon basin
A. C. V. Getirana and C. Peters-Lidard
Title Page
Abstract Introduction
Conclusions References
Tables Figures
◭ ◮
◭ ◮
Back Close
Full Screen / Esc
Printer-friendly Version Interactive Discussion
Discussion
P
a
per
|
Dis
cussion
P
a
per
|
Discussion
P
a
per
|
Discussio
n
P
a
per
|
all the three VS, but significant changes are visible for vs-478, where RE and NRMSE were drastically improved to 8 % and 4 %, respectively, for the calibration step, and 10 % and 4 % for the validation step. Errors inQrc0for vs-8 are mainly due to overesti-mated peak discharge, as provided by HyMAP (see Fig. 4). As for vs-217,Qrc0 errors are derived from underestimated peaks, while vs-478 has overestimated discharges
5
throughout the study period.
5 Concluding remarks
This letter presents a new methodology to predict water discharges from radar altimetry data in the Amazon basin. The technique is based on the calibration of rating curves using altimetric data and simulated water discharge at VS. A first evaluation (called
10
experiment 1) was conducted by building rating curves at 444 VS within the basin combining Envisat data and simulated discharges derived from the HyMAP model. In order to evaluate the impacts of model uncertainties on rating curve accuracy, an ad-ditional experiment (experiment 2) was performed using model outputs resulting from a simplified discharge data assimilation procedure. Discharge estimates at 90 VS were
15
compared against observations at nearby gauging stations. Based on the results ob-tained, we can say that discharge forecasts from current large scale radar altimetry datasets based on rating curves are feasible, but accuracy is highly sensitive to the quality of input data.
Overall, discharge forecasts provided by both experiments had good performance.
20
In most cases, rating curve-based discharges performed better than model simula-tions. Results can be considered as optimistic if compared to previous related stud-ies and are as acceptable for most hydrological applications. However, significant dif-ferences in experimental results were noted at smaller scales, i.e. VS with drainage areas A <105km2, where rainfall monitoring is usually inappropriate and model
pa-25
HESSD
9, 7591–7611, 2012Water discharge estimates in the
Amazon basin
A. C. V. Getirana and C. Peters-Lidard
Title Page
Abstract Introduction
Conclusions References
Tables Figures
◭ ◮
◭ ◮
Back Close
Full Screen / Esc
Printer-friendly Version Interactive Discussion
Discussion
P
a
per
|
Dis
cussion
P
a
per
|
Discussion
P
a
per
|
Discussio
n
P
a
per
|
performed by the linear regression. The use of rating curves derived from this ex-periment at these locations should be more adequate to estimate monthly or annual discharges rather than daily. Experiment 2 provided better overall results. The assimi-lation of observed discharges eliminated the impact of simulated discharges on rating curve accuracy, resulting in a dominant influence of the low altimetric data uncertainty.
5
Such differences between experiments are expected since precipitation and model un-certainties are eradicated by the assimilation of observed data.
It must be highlighted that in some cases, the calibrated rating curve parameters may not be reflective of the actual channel hydraulics. This relation will depend on the quality of data used as input for the curve calibration and hydraulic properties of the
10
river at the station. For example, the stations located a short distance upstream from a confluence in flat regions may be influenced by backwater effects. In such cases, the stage at the station also depends on the stage at the confluence.
The continuous development of sophisticated physically-based flow routing schemes coupled with land surface models allows us to easily obtain gridded water discharge
15
time series at the global scale with reasonable accuracy. However, these modeling sys-tems are frequently constrained by quality or time length of global datasets, making it difficult to obtain accurate simulations of physical processes on a near real-time basis at poorly-gauged or ungauged locations. The combination of the present methodology with forthcoming altimetric and topographic missions (e.g., SWOT mission) will
consid-20
erably improve the understanding of hydrological processes and streamflow estimates in unequipped basins. Ultimately, altimetry-based discharges can be used in a flow routing scheme framework to evaluate the feedback effects between the land surface and atmosphere and the vertical water and energy balances computed by LSMs.
Acknowledgements. The first author is funded by the NASA Postdoctoral Program (NPP) man-25
HESSD
9, 7591–7611, 2012Water discharge estimates in the
Amazon basin
A. C. V. Getirana and C. Peters-Lidard
Title Page
Abstract Introduction
Conclusions References
Tables Figures
◭ ◮
◭ ◮
Back Close
Full Screen / Esc
Printer-friendly Version Interactive Discussion
Discussion
P
a
per
|
Dis
cussion
P
a
per
|
Discussion
P
a
per
|
Discussio
n
P
a
per
|
References
Alsdorf, D. E., Rodr´ıguez, E., and Lettenmaier, D. P.: Measuring surface water from space, Rev. Geophys., 45, RG2002, doi:10.1029/2006RG000197, 2007.
Andreadis, K. M., Clark, E. A., Lettenmaier, D. P., and Alsdorf, D. E.: Prospects for river dis-charge and depth estimation through assimilation of swath-altimetry into a raster-based hy-5
drodynamics model, Geophys. Res. Lett., 34, L10403, doi:10.1029/2007GL029721, 2007. Bamber, J. L.: Ice sheet altimeter processing scheme, Int. J. Remote Sens., 15, 925–938, 1994. Coe, M. T. and Birkett, C. M.: Calculation of river discharge and prediction of lake height from
satellite radar altimetry: example for the Lake Chad basin, Water Resour. Res., 40, W10205, doi:10.1029/2003WR002543, 2004.
10
da Silva, J. S., Calmant, S., Seyler, F., Rotunno Filho, O. C., Cochonneau, G., and Mansur, W. J.: Water levels in the Amazon basin derived from the ERS 2 and ENVISAT radar altimetry missions, Remote Sens. Environ., 114, 2160–2181, 2011.
Decharme, B., Alkama, R., Papa, F., Faroux, S., Douville, H., and Prigent, C.: Global off-line evaluation of the ISBA-TRIP flood model, Clim. Dynam., 38, 1389—1412, 15
doi:10.1007/s00382-011-1054-9, 2012.
Getirana, A. C. V., Bonnet, M. P., Roux, E., Calmant, S., Rotunno Filho, O. C., and Mansur, W. J.: Hydrological monitoring of large poorly gauged basins: a new approach based on spatial altimetry and distributed rainfall-runoff model, J. Hydrol., 379, 205–219, doi:10.1016/j.jhydrol.2009.09.049, 2009.
20
Getirana, A. C. V., Boone, A., Yamazaki, D., Decharme, B., Papa, F., and Mognard, N.: The Hydrological Modeling and Analysis Platform (HyMAP): evaluation in the Amazon basin, J. Hydrometeorol., accepted for publication, 2012.
Jaccon, G. and Cudo, K. J.: Curva-chave: analise e tratado, DNAEE, Brazil, 273 pp., 1989. Kouraev, A. V., Zakharova, E. A., Samain, O., Mognard, N. M., and Cazenave, A.: Ob river 25
discharge from TOPEX/Poseidon satellite altimetry (1992–2002), Remote Sens. Environ., 93, 238–245, 2004.
Le ´on, J. G., Calmant, S., Seyler, F., Bonnet, M. P., Cauhope, M., Frappart, F., and Fillizola, N.: Rating curves and estimation of average depth at the upper Negro river based on satellite altimeter data and modelled discharges, J. Hydrol., 328, 481–496, 2006.
HESSD
9, 7591–7611, 2012Water discharge estimates in the
Amazon basin
A. C. V. Getirana and C. Peters-Lidard
Title Page
Abstract Introduction
Conclusions References
Tables Figures
◭ ◮
◭ ◮
Back Close
Full Screen / Esc
Printer-friendly Version Interactive Discussion
Discussion
P
a
per
|
Dis
cussion
P
a
per
|
Discussion
P
a
per
|
Discussio
n
P
a
per
|
Michailovsky, C. I., McEnnis, S., Berry, P. A. M., Smith, R., and Bauer-Gottwein, P.: River mon-itoring from satellite radar altimetry in the Zambezi River Basin, Hydrol. Earth Syst. Sci. Discuss., 9, 3203–3235, doi:10.5194/hessd-9-3203-2012, 2012.
Noilhan, J. and Mahfouf, J. F.: The ISBA land surface parameterisation scheme, Global Planet. Change, 13, 145–159, doi:10.1016/0921-8181(95)00043-7, 1996.
5
Papa, F., Durand, F., Rossow, W. B., Rahman, A., and Bala, S. K.: Satellite altimeterderived monthly discharge of the Ganga-Brahmaputra River and its seasonal to interannual varia-tions from 1993 to 2008, J. Geophys. Res., 115, C12013, doi:10.1029/2009JC006075, 2010. Tapley, B. D., Bettadpur, S., Watkins, M., and Reigber, C.: The gravity recovery and
cli-mate experiment: mission overview and early results, Geophys. Res. Lett., 31, L09607, 10
doi:10.1029/2004GL019920, 2004.
HESSD
9, 7591–7611, 2012Water discharge estimates in the
Amazon basin
A. C. V. Getirana and C. Peters-Lidard
Title Page
Abstract Introduction
Conclusions References
Tables Figures
◭ ◮
◭ ◮
Back Close
Full Screen / Esc
Printer-friendly Version Interactive Discussion
Discussion
P
a
per
|
Dis
cussion
P
a
per
|
Discussion
P
a
per
|
Discussio
n
P
a
per
|
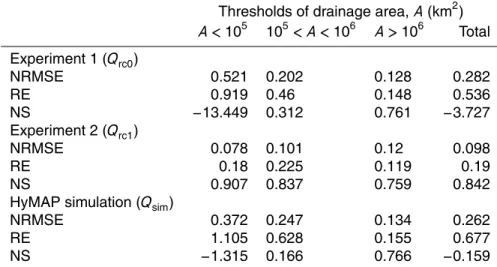
Table 1.Performance coefficients (NRMSE, RE and NS) of water discharges estimated by the
rating curves at selected virtual stations for the calibration period (2002–2005). Coefficients of modeled discharges at gauging stations used in the evaluation are also provided. Values correspond to averages of drainage area thresholds.
Thresholds of drainage area,A(km2)
A <105 105< A <106 A >106 Total Experiment 1 (Qrc0)
NRMSE 0.521 0.202 0.128 0.282
RE 0.919 0.46 0.148 0.536
NS −13.449 0.312 0.761 −3.727
Experiment 2 (Qrc1)
NRMSE 0.078 0.101 0.12 0.098
RE 0.18 0.225 0.119 0.19
NS 0.907 0.837 0.759 0.842
HyMAP simulation (Qsim)
NRMSE 0.372 0.247 0.134 0.262
RE 1.105 0.628 0.155 0.677
HESSD
9, 7591–7611, 2012Water discharge estimates in the
Amazon basin
A. C. V. Getirana and C. Peters-Lidard
Title Page
Abstract Introduction
Conclusions References
Tables Figures
◭ ◮
◭ ◮
Back Close
Full Screen / Esc
Printer-friendly Version Interactive Discussion
Discussion
P
a
per
|
Dis
cussion
P
a
per
|
Discussion
P
a
per
|
Discussio
n
P
a
per
|
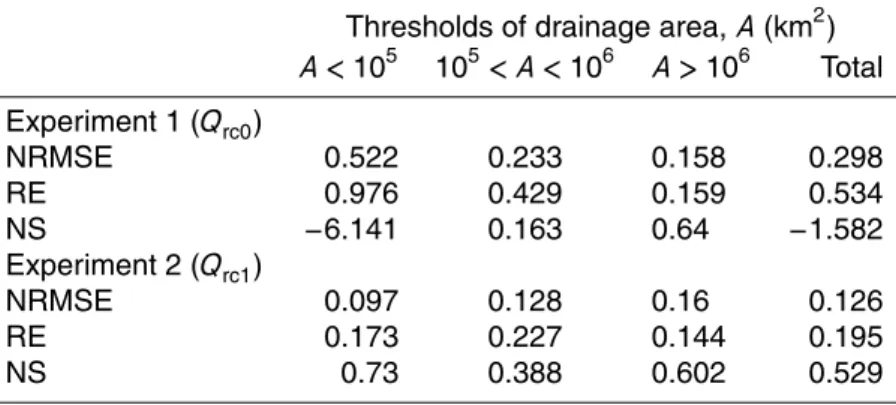
Table 2.Same as Table 1, but for the validation period (2006–2008). Simulated discharges are
not available for this period.
Thresholds of drainage area,A(km2)
A <105 105< A <106 A >106 Total Experiment 1 (Qrc0)
NRMSE 0.522 0.233 0.158 0.298
RE 0.976 0.429 0.159 0.534
NS −6.141 0.163 0.64 −1.582
Experiment 2 (Qrc1)
NRMSE 0.097 0.128 0.16 0.126
RE 0.173 0.227 0.144 0.195
HESSD
9, 7591–7611, 2012Water discharge estimates in the
Amazon basin
A. C. V. Getirana and C. Peters-Lidard
Title Page
Abstract Introduction
Conclusions References
Tables Figures
◭ ◮
◭ ◮
Back Close
Full Screen / Esc
Printer-friendly Version Interactive Discussion
Discussion
P
a
per
|
Dis
cussion
P
a
per
|
Discussion
P
a
per
|
Discussio
n
P
a
per
|
−80 −70 −60 −50
−20 −15 −10 −5 0 5
8
217
478
Virtual station (VS) VS used in the evaluation Gauges with discharge assimilated Gauges used in the evaluation
Fig. 1.The Amazon basin and the geographical location of virtual and gauging stations used
HESSD
9, 7591–7611, 2012Water discharge estimates in the
Amazon basin
A. C. V. Getirana and C. Peters-Lidard
Title Page
Abstract Introduction
Conclusions References
Tables Figures
◭ ◮
◭ ◮
Back Close
Full Screen / Esc
Printer-friendly Version Interactive Discussion
Discussion
P
a
per
|
Dis
cussion
P
a
per
|
Discussion
P
a
per
|
Discussio
n
P
a
per
|
Fig. 2. Results of curve fitting at 444 virtual stations. Zero-flow equivalent depth (z) values
HESSD
9, 7591–7611, 2012Water discharge estimates in the
Amazon basin
A. C. V. Getirana and C. Peters-Lidard
Title Page
Abstract Introduction
Conclusions References
Tables Figures
◭ ◮
◭ ◮
Back Close
Full Screen / Esc
Printer-friendly Version Interactive Discussion
Discussion
P
a
per
|
Dis
cussion
P
a
per
|
Discussion
P
a
per
|
Discussio
n
P
a
per
|
Fig. 3.Normalized root mean square errors (NRMSE) of water discharge and level at 90
HESSD
9, 7591–7611, 2012Water discharge estimates in the
Amazon basin
A. C. V. Getirana and C. Peters-Lidard
Title Page
Abstract Introduction
Conclusions References
Tables Figures
◭ ◮
◭ ◮
Back Close
Full Screen / Esc
Printer-friendly Version Interactive Discussion
Discussion
P
a
per
|
Dis
cussion
P
a
per
|
Discussion
P
a
per
|
Discussio
n
P
a
per
|
Fig. 4.Results from the curve fitting procedure for three virtual stations: vs-8, vs-217 and vs-478 (see location in Fig. 1). On the left, the optimization ofR2=f(z): red represents experiment 1 (Qrc0) and blue is experiment 2 (Qrc1). On the middle-left, the curve fitting for both experiments:
red dots and lines stand for experiment 1 and blue squares and lines are derived from exper-iment 2. On the middle-right, observed and simulated daily discharges and curve estimates for both experiments during the calibration and validation periods (legend is provided). On the right, performance coefficients NS, RE and NRMSE of discharge estimates derived from ex-periment 1 (Qrc0) and 2 (Qrc1) for both calibration and validation periods. Coefficients forQsim