i
A PERFORMANCE COMPARISON OF OVERSAMPLING
METHODS FOR DATA GENERATION IN
IMBALANCED LEARNING TASKS
Samrat Jayanta Dattagupta
2
NOVA Information Management School
Instituto Superior de Estatística e Gestão de Informação
Universidade Nova de Lisboa
A PERFORMANCE COMPARISON OF OVERSAMPLING METHODS FOR
DATA GENERATION IN IMBALANCED LEARNING TASKS
by
Samrat Jayanta Dattagupta
Dissertation report presented as partial requirement for obtaining the Master’s degree in Statistics and Information Management, with a specialization in Marketing Research and CRM
Advisor / Co Advisor:Prof. Fernando Bação Co Advisor: Georgios Douzas
3
DEDICATION
4
ACKNOWLEDGEMENT
I would like to thank my supervisors Dr. Fernando Bação and Georgios Douzas for their constant motivation and encouragement and for sharing their expert knowledge on this subject with me. Without their patience and dedication for my learning, it would not have been possible for me to complete this process. I hope we can collaborate in the future as well.
I would also like to thank Dr. Rute Sofia, Director of Copelabs, who allowed me to manage time from my full time job to work on this dissertation. I acknowledge and thank my other colleagues as well, for valuable feedback on improving my technical writing skills.
5
ABSTRACT
Class Imbalance problem is one of the most fundamental challenges faced by the machine learning community. The imbalance refers to number of instances in the class of interest being relatively low, as compared to the rest of the data. Sampling is a common technique for dealing with this problem. A number of over - sampling approaches have been applied in an attempt to balance the classes.
This study provides an overview of the issue of class imbalance and attempts to examine some common oversampling approaches for dealing with this problem. In order to illustrate the differences, an experiment is conducted using multiple simulated data sets for comparing the performance of these oversampling methods on different classifiers based on various evaluation criteria. In addition, the effect of different parameters, such as number of features and imbalance ratio, on the classifier performance is also evaluated.
KEYWORDS
6
INDEX
1.
Introduction
... 9
2.
Literature review
... 11
3.
Class imbalance problem
... 13
3.1.
Problem definition level issue ... 13
3.2.
Data level issue ... 13
3.3.
Algorithm level issue ... 14
3.4.
Solutions for the issues... 14
4.
Sampling methods and evaluation criteria
... 15
4.1.
Oversampling methods ... 15
4.1.1.
Random Oversampling ... 15
4.1.2.
Synthetic Minority Oversampling (SMOTE) ... 15
4.1.3.
Borderline-SMOTE ... 16
4.1.4.
Adaptive Synthetic (ADASYN) ... 16
4.2.
Evaluation metrics ... 16
4.2.1.
Area Under the Curve (AUC) ... 17
4.2.2.
F-measure ... 17
4.2.3.
Geometric Mean... 17
4.3.
Drawback of sampling methods ... 17
5.
Methodology
... 18
6.
Results and Discussion
... 19
7.
Conclusion
... 23
7
LIST OF FIGURES
Figure 1- Horizontal box plot of oversampling methods ... 20
Figure 2- Violin plot of over- samplers divided for classifiers and metrics ... 20
8
LIST OF TABLES
Table 1 - Mean ranking of oversampling methods ... 19
Table 2 - Friedman´s Test ... 19
Table 3 - Filtered results divided by feature size ... 22
9
1.
INTRODUCTION
Imbalanced learning may be defined as the learning process from data distributions involving severe skews which hinders the process of information extraction and development of effective decision boundaries. This raises critical issues for any system involving a learning process in context of research as well as real world applications. Classification is an important task for knowledge discovery and pattern recognition. In supervised learning, the performance of a classifier is dependent on its ability to correctly classify the target values. Learning from imbalanced data is a major concern for the classifier to efficiently perform this task. Imbalance in a data set occurs when at least one of the classes of the target value is severely under-represented compared to the other(s). The issue of imbalance may occur between one majority and one minority class (Two class problem) or one majority and several minority classes (Multi-class problem). The level of imbalance,
also called Imbalance Ratio, may range from 1:10 to 1:1000 or more.
This study attempts to provide the practitioners with a deeper understanding of the available solutions to imbalance learning problem at the data level, through some available oversampling method. We aim to clarify which, among the most popular oversampling algorithms, provides the best results. The goal of the experiment conducted is as follows:
Compare four commonly used oversampling methods and evaluate their effect on three different classifiers using appropriate performance criteria
Observe the behavior of oversampling methods on multiple simulated data sets with Imbalance Ratio ranging from high to low
Understand the effect of different data set parameters such as number of features on the oversampling methods
With these experiments we hope to provide a basis for a more informed decision-making when
oversampling methods are needed, to improve results in classification problems
10 There are several other examples where learning from imbalance data may improve the performance of a classifier such as fraud detection in finance [3], network intrusion [6] and equipment failure detection in telecommunication [23], product categorization in retail [27] and detection of defective products on the assembly line. [20]. Identification of rare or even unknown particles in experimental high energy physics [19] and medical diagnostics has also greatly benefitted from imbalanced learning methods. One such situation is the early detection of diseases by using pattern recognition , like the classification of pixels in mammogram images as possibly cancerous [21], since number of disease cases is generally much lower than healthy. Detection of oil spills using radar images from satellite is another field where the value of understanding minority class instances better, has proved to be useful [14]. In addition to these, data imbalance has been reported in microarray research, response modelling, remote sensing and scene classification [13]. There has also been some work in the case of unsupervised learning for the purpose of segmentation based on clustering with regard to market basket analysis for super-market. [26]
Sampling methods are popular techniques for handling the task of imbalanced learning. Among the two types of sampling methods i.e. under-sampling and oversampling, oversampling is generally the preferred method due to the information loss in under-sampling even though oversampling may lead to overfitting [9]. Apart from stand-alone sampling methods there have also been attempts to integrate ensemble learning and data-cleaning techniques to the sampling methodology. In terms of the different evaluation criteria used to compare the performance of these methods, threshold techniques as well as ranking metrics have been known to provide better understanding than standard accuracy measures such as mean square error and misclassification rate.
This study is divided into the following sections: Section 2 is dedicated to related work, Section 3
describes the Class imbalance problem from different levels; Section 4 describes the different oversampling methods and gives an overview of the metrics used for evaluation of results; Section 5
11
2.
LITERATURE REVIEW
In order to familiarize the readers with some other studies that have attempted to perform similar research as this one, we shall review the related work on this topic in this section. There have been several approaches to solving the class imbalance problem many of which involve sampling approaches. This study focuses on four oversampling methods commonly used with imbalance learning problems. These methods are Random oversampling, which randomly over-samples instances for the minority class, SMOTE which creates synthetic instances for the minority class, and two of its variations Borderline-SMOTE and ADASYN. A detailed overview of these methods and the three metrics used in this study, F-measure and G-mean and AUC, is provided in Section 4.
Some other known oversampling methods include Cluster-SMOTE [6] which uses k-means algorithm to find clusters in the minority class by boosting the examples in the specific region and k-means SMOTE [30] which improves upon this by identifying clusters where generation of synthetic data is most likely to be effective. CURE-SMOTE [29] generates synthetic examples after first using CURE algorithm to clean the outliers and remove noise prior to the clustering based oversampling process. Self-Organizing Map-based Oversampling(SOMO) [31] produces a two-dimensional representation of the input apace for the purpose of generating artificial data. Other oversampling techniques, like SMOTEBoost [32] using the AdaBoost algorithm changes the weight and balances the skewness of the minority class distribution. There are also methods such as SMOTE+ENN [2] and SMOTE+Tomek [2] which use neighborhood cleaning methods like edited nearest neighbor and Tomek´s link to clean the space after the oversampling process. More recently new approaches have been proposed by F. Bação, G. Douzas et al. [37] [38]. This is not an exhaustive list of oversampling methods, but it provides an overview of some notable work. Since the comparison of oversampling methods is a major part of our study, we also provide some examples of previous studies related to this topic.
12 V.Lopez et al. [17] compared SMOTE, Borderline-SMOTE, ADASYN, DB-SMOTE and some other methods using three classifiers C4.5 Decision Tree, Support Vector Machine and k Nearest Neighbor and evaluated the performance in each case using AUC criteria on 66 data sets available on KEEL data set repository. They observed SMOTE and SMOTE+ENN as the top methods and Borderline-SMOTE and ADASYN to be quite robust and used a Shaffer post hoc test for analyzing statistical significance. Cen, Liaw and Brieman [5] compared one sided sampling, SMOTE, SMOTEBoost, SHRINK against Balanced Random forest and Weighted Random Forest using 6 data sets by comparing performance using Recall, Precision, F-measure, G-mean and Weighted Accuracy .They find the random forest methods to perform well in the given settings. Bach and Werner [33] studied various under sampling and oversampling methods in analysis of imbalanced data on Osteoporosis and noted highest efficiency achieved by the SMOTE combined with Random Forest classifier.
Bing Zhu et al. [34] used 11 churn data sets from various sources for benchmarking resampling strategies for churn prediction. Among the oversampling methods they used ADASYN, Borderline-SMOTE, Random Oversampling and SMOTE on four classifiers Logistic Regression, C4.5 Decision Tree, Support Vector Machine and Random Forest. Based on their study they recommended suitable sampling strategies for each combination of classifier evaluation metric. Rozita and Bahram [35] investigated imbalance ratio of 13 sets of real data using four resampling techniques including Borderline SMOTE and SMOTE on J48 and naive Bayes classifiers using four performance metrics TPrate, TNrate, Gmean and AUC. They concluded that oversampling approach works better than undersampling when data sets are severely imbalanced. Julien and Edmundo [36] studied synthetic oversampling for Twitter imbalanced sentiment analysis. They used ADASYN, SMOTE and Borderline SMOTE on three publicly available twitter data sets with the decision tree and l1 penalized logistic regression, evaluating them by Overall Accuracy and F1 measures.
13
3.
CLASS IMBALANCE PROBLEM
Imbalanced class data has been found in a number of different domains and often considered an integral problem of the learning process. The class imbalance may either occur due to the relative proportion of examples belonging to each class being low (relative rarity) or the absolute number of examples belonging to each class available for learning being low (absolute rarity). There is also a distinction for between-class imbalance which refers to imbalance occurring only due to the minority class, and within-class imbalance which refers to rare cases present within either the minority or the majority class [11]. These rare cases lead to small disjuncts [25] for classifiers which are formed of small number of training examples. Small disjuncts have much higher error rates than large disjuncts and tend to become problematic for the classifier [22]. It is also interesting to note that rare classes are often made up of rare cases.The nature of the imbalanced learning problem can be categorized into three varieties: problem-definition level, data level and algorithm level. [24] .
3.1.
PROBLEM DEFINITION LEVEL ISSUEThe problem definition level issue refers to poor understanding on behalf of the practitioner by using assessment metrics which are not suitable for evaluating classifiers working on imbalanced data in order to find an optimal classifier. This has special importance because of the cost of errors being asymmetric and skewed, which violate the assumption of general classifier metrics that errors have uniform cost. Thus traditional evaluation metrics such as total accuracy are not sufficient in this case. This is counter-beneficial for the design of an optimal classifier if the proper metrics that are to be used for its evaluation, are not understood during development. There are also cases found in unsupervised learning being affected by imbalanced data causing problems for the metrics used for association rule mining. One example is observed in the case where association rules involving rare items [26] are not likely to be generated, even though it may be of interest for the practitioner. Several evaluation metrics like AUC, F-score and G-mean have been proposed to provide better evaluation of classifiers.
3.2.
DATA LEVEL ISSUE14 cases and small disjuncts are thus harder to learn for the classifier compared with the majority class [12]. Sampling methods are a common technique for solving the problem at the data level. Several oversampling, under-sampling and combination methods have been proposed by the scientific community for tackling this issue. Active learning and other information acquisition strategies have also demonstrated efficiency when dealing with class imbalance at the data level. [7]
3.3.
ALGORITHM LEVEL ISSUEThe algorithm level issue concerns the inability of algorithms to optimize learning for target evaluation criteria in the imbalanced case, which are quite different from standard evaluation metrics such as accuracy. The search heuristics used by most common classification algorithms, especially the ones involving greedy search and divide-and-conquer strategies, are inadequate for identifying highly accurate rare cases and thus perform poorly for minority classes. Inductive bias of the classifier also plays a role with respect to small disjuncts and rare classes, as the bias is used to encourage generalization and avoid overfitting. Classification algorithm based on greedy search heuristics encounter problems with relative rarity because random occurrences obscure the associations that are rare but meaningful. Divide and conquer strategies encounter problems with relative rarity as well as absolute rarity due to repeated partitioning that leads to data fragmentation [8]. Further research may look into developing algorithms specifically conditioned for treating imbalanced data.
3.4.
S
OLUTIONS FOR THE ISSUES15
4.
SAMPLING METHODS AND EVALUATION CRITERIA
Sampling is the most commonly used data level approach to deal with class imbalance. The sampling process alters the training set in such a way as to create a more balanced class distribution. Sampling methods can be divided into under sampling and oversampling. Under-sampling reduces number of examples from the majority class whereas oversampling adds new synthetic examples to the minority class during the training phase. There is also a distinction between random and heuristic approaches. In addition to standard oversampling and under sampling there are techniques which perform a combination of both these methods. Some ensemble methods based on sampling techniques have also been developed for learning in data sets that exhibit class imbalance.
4.1.
OVERSAMPLING METHODSOversampling methods replicate the values of the minority class either in a random manner or part of an informative process. The increase in number of minority instances attempt to make the class more balanced but generating and adding these new instances increase the risk of overfitting. Several methods have been developed in order to make the oversampling method more informative and reduce the chances of overfitting. In this study we wish to provide a better understanding of the following commonly used oversampling methods:
4.1.1.
Random Oversampling
The Random oversampling method operates by replicating the randomly selected set of examples from the minority class, so that the majority class does not have over bearing presence during the training process. Since the sampling process is random, it becomes difficult for the decision function to find a clear borderline between the two classes. Therefore, although it is widely used, Random oversampling might be ineffective at improving recognition of the minority class by a large margin. Some potential drawbacks of Random oversampling include increase in training time for the classifier and over-fitting on account of duplication of examples of the minority class as the class imbalance ratio becomes worse. However, other oversampling methods have been built based on this method.
4.1.2.
Synthetic Minority Oversampling (SMOTE)
16 low dimensional data, the effectiveness in the case of high dimensional data is less impressive. This is due to the fact that SMOTE is not able to manage the bias in the majority class for the classifier where the data is high dimensional. Another drawback of the SMOTE algorithm is over generalization of the minority class space. Similar to Random Oversampling method SMOTE has also been used to build other oversampling methods.
4.1.3.
Borderline-SMOTE
Borderline-SMOTE is based on the SMOTE method, as the name implies, and has two variations Borderline SMOTE1 and Borderline SMOTE2. The method over-samples the minority examples only near the borderline and their nearest neighbors of the same class. The difference between the two versions is that borderline-SMOTE2 uses both the positive nearest neighbors and negative nearest neighbors [10]. Compared to regular SMOTE, borderline-SMOTE does not create synthetic examples for noise instances, but concentrates its effort near the borderline, which in turn helps the decision function to create better boundaries between classes. In terms of performance, borderline-SMOTE has also been reported to perform better than SMOTE.
4.1.4.
Adaptive Synthetic (ADASYN)
Adaptive Synthetic (ADASYN) sampling uses a weighted distribution for different minority class examples according to their level of difficulty of learning. Although ADASYN is also based on SMOTE, in comparison to borderline-SMOTE, ADASYN creates different synthetic samples for the minority class depending on its distribution and not just for the borderline instances. In addition to that, SMOTE provides equal chance of each minority instance to get selected whereas in ADASYN the selection process is based on the minority class distribution. The synthetic samples are created based on the majority nearest neighbors via the k-NN method. One drawback of this approach is that it does not identify noisy instances, and thus becomes susceptible to outlier values in the dataset. Previous studies have demonstrated an improvement in accuracy for both majority and minority classes and does not sacrifice one class in preference for another. [9]
4.2.
EVALUATION METRICS17
4.2.1.
Area Under the Curve (AUC)
Area Under the Curve(AUC) is an evaluation method independent of selected threshold and prior probabilities. It measures the probability of the classifier assigning a higher rank to a randomly chosen positive example than a randomly chosen negative example and represents the performance of a classifier averaged over all possible cost ratios. Some limitation of this measure for comparative purpose for different classifier may be noted due to the skew-ratio distribution and interpretability. [1] The formula for calculating the AUC may be given by the following equation:
,
where S0 is the sum of ranks of class 0, n0 are the points of class 0 and n1 are the points of class 1.
4.2.2.
F-measure
F-measure is a combination of precision and recall where F1 score is the weighted harmonic mean of precision and recall of a classifier, such that the best value is 1 i.e. all relevant information has been retrieved and worst is 0 i.e. no relevant information was retrieved. It was introduced by [Ethan Zhang, Y. Zhang] for information retrieval systems. [28] F1- measure is given by the following equation:
4.2.3.
Geometric Mean
Geometric Mean(G-mean) is defined as a function of both the sensitivity and specificity of the classifier. It was introduced by [15] [Kubat et al.] as measure that takes into account relative balance on the positive as well as negative class. The equation is given below:
.
4.3.
D
RAWBACK OF SAMPLING METHODS18
5.
METHODOLOGY
We compare the performance of various oversampling methods on 96 synthetic data sets generated using make_classification function from Python Scikit-learn package. The four oversampling methods compared are Random Oversampling, SMOTE, Borderline-SMOTE and ADASYN. The nearest neighbor was set to 3 for the methods that used the k-NN technique for the oversamplers. The result for the case where an oversampling method has not been used on the classifier is reported under No Oversampling, which is used as reference for the other methods.
The three classifiers used are Decision Tree, Logistic Regression and Gradient Boosting and the evaluation metrics are F1 score, G-mean and AUC. The reason for using different classifiers is to provide insights that are not dependent on a particular classifier or hyper- parameter. This motivated our choice of using Logistic Regression which does not require any hyper-parameter tuning. We also used two other classifiers, Decision Tree and Gradient Boosting, where different kind of hyper-parameter are present, and hence make the results more likely to be generalized.
The experiment has following parameters: Two sample sizes of 5000 and 10000
The number of clusters per class selected at 2, 3, 4 & 5.
Three weight classes considered are (0.95, 0.05), (0.98,0.02), (0.992,0.008) Number of features at 5, 10, 50 & 100
Logistic Regression with default settings, Gradient boosting with maximum depth at 2,3, 5, 8 and number of estimators at 10, 50, 80, 100 and Decision Tree with maximum depth 2 & 5 Imbalance ratio of the datasets range from 16.79 to 88.29.
19
6.
RESULTS AND DISCUSSION
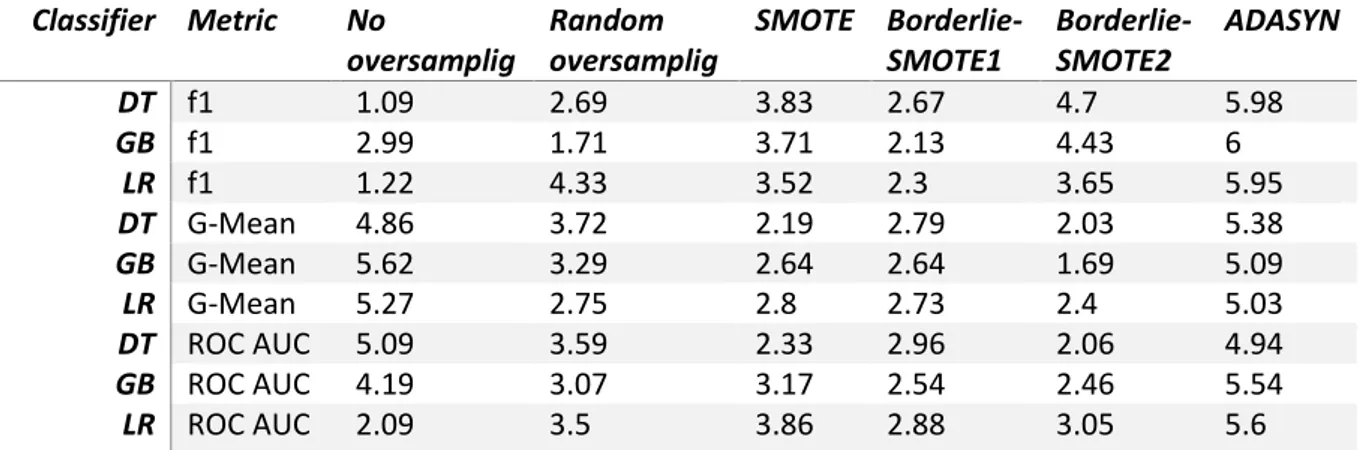
The mean cross validation score and the standard deviation of cross validation have been used for building a mean ranking score for these methods as displayed in table1 where 1 indicates the highest ranking and hence the best performing method whereas 6 is the lowest ranking or worst performing
method. The test of significance is performed using Friedman test results. Friedman test concludes that null hypothesis is rejected at 0.05 level for all cases which means the three classifiers do not have the same performance as seen in table 2.
Classifier Metric No
oversamplig
Random oversamplig
SMOTE Borderlie-SMOTE1
Borderlie-SMOTE2
ADASYN
DT f1 1.09 2.69 3.83 2.67 4.7 5.98
GB f1 2.99 1.71 3.71 2.13 4.43 6
LR f1 1.22 4.33 3.52 2.3 3.65 5.95
DT G-Mean 4.86 3.72 2.19 2.79 2.03 5.38
GB G-Mean 5.62 3.29 2.64 2.64 1.69 5.09
LR G-Mean 5.27 2.75 2.8 2.73 2.4 5.03
DT ROC AUC 5.09 3.59 2.33 2.96 2.06 4.94
GB ROC AUC 4.19 3.07 3.17 2.54 2.46 5.54
LR ROC AUC 2.09 3.5 3.86 2.88 3.05 5.6
Table 1: Mean ranking of oversampling methods
A closer look at the overall mean ranking results in table1 indicate Borderline-SMOTE2 as the method consistently ranking well based on the G-Mean and AUC score for all the three classifiers. However, the f1 score does not correspond with this result. In fact, according to the f1 score No oversampling is the highest ranking methods for the Decision tree and Logistic Regression classifiers. This may be due to the fact that f1 score puts higher emphasis on true positives i.e. the majority class, which the classifiers themselves are well equipped to handle without the support from any of the oversampling methods.
Classifier Metric p-value DT F1 < 0.01 GB F1 < 0.01 LR F1 < 0.01 DT G-Mean < 0.01 GB G-Mean < 0.01 LR G-Mean < 0.01 DT ROC AUC 0.03 GB ROC AUC < 0.01 LR ROC AUC 0.02
Table 2: Friedman test
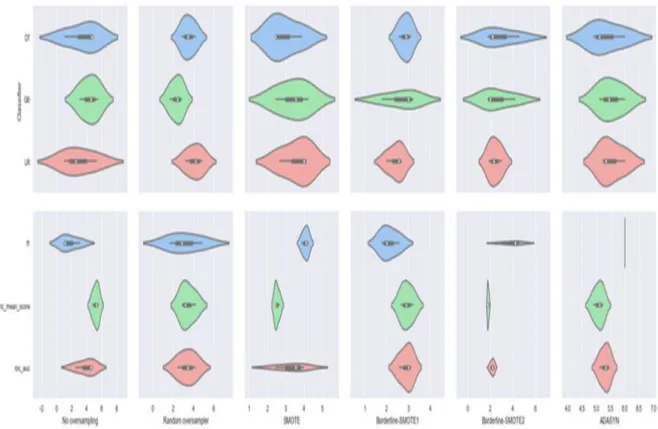
20 interesting to see the large inter-quartile range for No oversampling, indicating the non-uniform performance of the classifier in the absence of any oversampling method.
Figure 1: Horizontal box plot of oversampling methods
Borderline-SMOTE1 is perhaps the second highest ranked method followed by SMOTE and Random oversampling. ADASYN is ranked low consistently for all three classifiers based on the evaluation metrics.
Figure 2: Violin plot of oversamplers divided for classifiers and metrics
21 poor performance of ADASYN. It may also be noted here that the f1 score results are consistently different than the other two indicators.
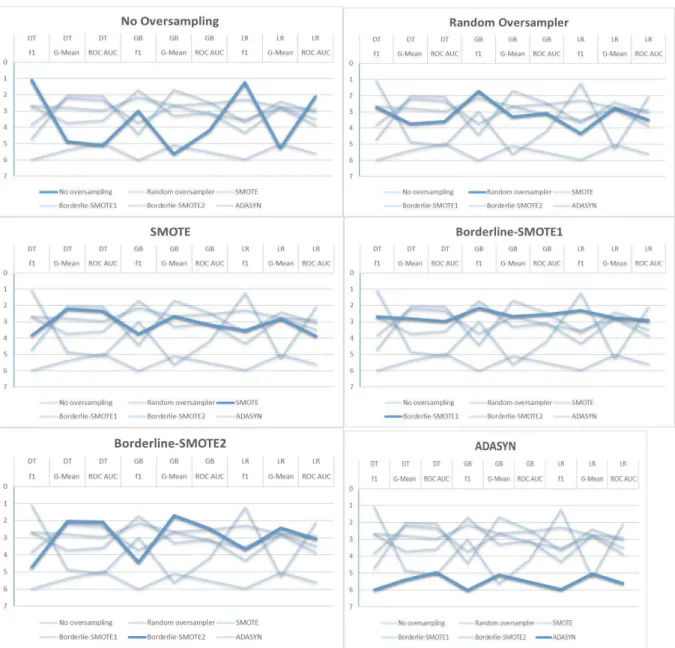
Figure 3: Joint line plot of oversampling methods
22 In order to better comprehend the performance of the oversampling methods on the different data set parameters, the results have been filtered based on the number of features and the imbalance ratio of the simulated data sets. The oversampling methods performing well according to at least two out three performance measures have been chosen as the best method for each combination of classifier and filter parameter based on the mean CV score and standard deviation as well as ranking. The results are displayed in table 3 and 4.
Decision Tree Gradient Boosting Logistic Regression
Features 5 SMOTE Borderline_SMOTE2 No Oversampling
Features 10 SMOTE Borderline_SMOTE2 No Oversampling
Features 50 Borderline_SMOTE2 Borderline_SMOTE2 No Oversampling
Features 100 Borderline_SMOTE2 Borderline_SMOTE1 No Oversampling
Table 3: Filtered results divided by feature size
Table 3 shows the best performing oversampling method for each classifier according to the number of features. Boderline_SMOTE2 is the overall top performing method, as expected from the previous observations. However, it is interesting to note that for Logistic Regression classifier, using no oversampling method seems to be the best solution. Although not explicitly stated in the table, it is important to note here that performance of the Borderline-SMOTE2 for Logistic regression classifier is quite close to the performance of no oversampling method, especially for the geometric mean and AUC score criteria. Another interesting observation here is that for the Decision Tree classifier, SMOTE performs well for lower number of features (i.e. 5 and 10) but as the number of features increases (i.e. 50 and 100), Boderline-SMOTE2 becomes the preferred method. This may be due to the fact that as the number of features increases SMOTE is less sensitive to the number of minority instances as compared with the Borderline-SMOTE method, and thus unable to perform well in high dimensional cases.
Decision Tree Gradient Boosting Logistic Regression
Imbalance Ratio 1 SMOTE SMOTE No Oversampling
Imbalance Ratio 2 Borderline_SMOTE2 Borderline_SMOTE2 No Oversampling
Imbalance Ratio 3 Borderline_SMOTE2 Borderline_SMOTE2 No Oversampling
Imbalance Ratio 4 Borderline_SMOTE2 Borderline_SMOTE2 Borderline_SMOTE2
Imbalance Ratio 5 Borderline_SMOTE2 Borderline_SMOTE2 Borderline_SMOTE2
Table 4: Filtered results divided by Imbalance ratio
23
7.
CONCLUSION
This study explores the data level approach of dealing with imbalanced data and shows the performance of various oversampling methods for the purpose of treatment of binary class imbalanced data. An overview of the various issues found related to class imbalance problem and some knowledge about proper evaluation metrics has been presented. Experimental analysis carried out on multiple simulated data sets allows to gain insight about the oversampling methods in this context. Results indicate that Borderline-SMOTE method to be most efficient for dealing with the class imbalance problem and ADASYN to be least effective often performing worse than Random Oversampling and No oversampling. It has also been observed that complexity of data, level of imbalance, evaluation criteria and choice of classifier, all play crucial role in the evaluation process.
Oversampling uses more examples from the minority class in order to balance the classes, which may lead to overfitting. Determining the right threshold to avoid overfitting and prevent information loss is a major challenge. It is also important to note that bias introduced toward predicting the oversampled class affects the performance of the classifier. However, even with these drawbacks sampling methods are still the most feasible option when dealing with issue of absolute rarity since relative rarity is generally not considered a problem at the data level.
24
8.
BIBLIOGRAPHY
[1] Andrew P. Bradley. The use of the area under the ROC curve in the evaluation of machine learning algorithms. Pattern Recognition, 30(7):1145 - 1159, 1997. URL
http://www.sciencedirect.com/science/article/pii/S0031320396001422.
[2] Gustavo E. A. P. A. Batista, Ronaldo C. Prati, Maria Carolina Monard. A study of the behavior of several methods for balancing machine learning training data. ACM SIGKDD Explorations Newsletter, 6(1):20, 2004. URL http://portal.acm.org/citation.cfm?doid=1007730.1007735.
[3] Philip K. Chan, Salvatore J. Stolfo. Toward Scalable Learning with Non-uniform Class and Cost Distributions: A Case Study in Credit Card Fraud Detection. Proceedings of the Fourth International Conference on Knowledge Discovery and Data Mining:164—168, 1998. URL
http://dl.acm.org/citation.cfm?id=3000292.3000320.
[4] N. V. Chawla, K. W. Bowyer, L. O. Hall, W. P. Kegelmeyer. SMOTE: Synthetic Minority Oversampling Technique. eprint arXiv:1106.1813, 16:321—357, 2011. URL
http://arxiv.org/abs/1106.1813%0Ahttp://dx.doi.org/10.1613/jair.953.
[5] Chao Chen, Andy Liaw, Leo Breiman. Using random forest to learn imbalanced data. University of California, Berkeley, (1999):1—12, 2004.
[6] D.A. Cieslak, N.V. Chawla, A. Striegel. Combating imbalance in network intrusion datasets. 2006 IEEE International Conference on Granular Computing:732—737, 2006. URL
http://ieeexplore.ieee.org/lpdocs/epic03/wrapper.htm?arnumber=1635905.
[7] Seyda Ertekin, Jian Huang, C. Lee Giles. Active Learning for Class Imbalance Problem. Proceedings of the 30th Annual International ACM SIGIR Conference on Research and Development in Information
Retrieval:823—824, 2007. URL http://doi.acm.org/10.1145/1277741.1277927.
[8] Jerome H. Friedman. Lazy Decision Trees. Proceedings of the Thirteenth National Conference on Artificial Intelligence - Volume 1:717—724, 1996. URL
http://dl.acm.org/citation.cfm?id=1892875.1892982.
[9] Haibo HE, Edwardo a. Garcia. Learning from Imbalanced Data Sets. IEEE Transactions on knowledge and data engineering, 21(9):1263——1264, 2010. URL
http://www.aaai.org/Papers/Workshops/2000/WS-00-05/WS00-05-003.pdf.
25 [11] Nathalie Japkowicz. Concept-Learning in the Presence of Between-Class and Within-Class
Imbalances. Springer Berlin Heidelberg, 2001. URL https://doi.org/10.1007/3-540-45153-6_7.
[12] Taeho Jo, Nathalie Japkowicz. Class Imbalances Versus Small Disjuncts. SIGKDD Explor. Newsl., 6(1):40—49, 2004. URL http://doi.acm.org/10.1145/1007730.1007737.
[13] Pilsung Kang, Sungzoon Cho. EUS SVMs : Ensemble of Under-Sampled SVMs for Data Imbalance Problems. Proceedings of the International Conference on Neural Information Processing (ICONIP), 298:837—846, 2006.
[14] Miroslav Kubat, Robert C. Holte, Stan Matwin. Machine Learning for the Detection of Oil Spills in Satellite Radar Images. Machine Learning, 30(2):195—215, 1998. URL
https://doi.org/10.1023/A:1007452223027.
[15] Miroslav Kubat, Stan Matwin, others. Addressing the curse of imbalanced training sets: one-sided selection. ICML, 97:179—186, 1997.
[16] Charles X. Ling, Chenghui Li. Data Mining for Direct Marketing: Problems and Solutions.
Proceedings of the Fourth International Conference on Knowledge Discovery and Data Mining:73— 79, 1998. URL http://dl.acm.org/citation.cfm?id=3000292.3000304.
[17] Victoria López, Alberto Fernández, Salvador Garci ́a, Vasile Palade, Francisco Herrera. An insight into classification with imbalanced data: Empirical results and current trends on using data intrinsic characteristics. Information Sciences, 250:113—141, 2013. URL
http://dx.doi.org/10.1016/j.ins.2013.07.007.
[18] Ajinkya More. Survey of resampling techniques for improving classification performance in unbalanced datasets. , 10000:1—7, 2016. URL http://arxiv.org/abs/1608.06048.
[19] S.H. Clearwater, E.G. Stern. A rule-learning program in high energy physics event classification.
Computer Physics Communications, 67(2):159 - 182, 1991. URL
http://www.sciencedirect.com/science/article/pii/001046559190014C.
[20] Yanmin Sun. Classification of Imbalanced Data : a Review. International Journal of Pattern Recognition and Artificial Intelligence, 23(4):687—719, 2009.
[21] KEVIN S. WOODS, CHRISTOPHER C. DOSS, KEVIN W. BOWYER, JEFFREY L. SOLKA, CAREY E. PRIEBE, W. PHILIP KEGELMEYER. COMPARATIVE EVALUATION OF PATTERN RECOGNITION
TECHNIQUES FOR DETECTION OF MICROCALCIFICATIONS IN MAMMOGRAPHY. International Journal of Pattern Recognition and Artificial Intelligence, 07(06):1417-1436, 1993. URL
26 [22] Gary M. Weiss, Haym Hirsh. A Quantitative Study of Small Disjuncts. Proceedings of the
Seventeenth National Conference on Artificial Intelligence and Twelfth Conference on Innovative
Applications of Artificial Intelligence:665—670, 2000. URL
http://dl.acm.org/citation.cfm?id=647288.721597.
[23] Gary M. Weiss, Haym Hirsh. Learning to Predict Rare Events in Event Sequences. Proceedings of the Fourth International Conference on Knowledge Discovery and Data Mining:359—363, 1998. URL
http://dl.acm.org/citation.cfm?id=3000292.3000360.
[24] Gary M. Weiss. Foundations of Imbalanced Learning. John Wiley & Sons, Inc., 2013. URL
http://dx.doi.org/10.1002/9781118646106.ch2.
[25] Gary Weiss. Learning with Rare Cases and Small Disjuncts. , 1998.
[26] Ya-Han Hu, Yen-Liang Chen. Mining association rules with multiple minimum supports: a new mining algorithm and a support tuning mechanism. Decision Support Systems, 42(1):1 - 24, 2006. URL
http://www.sciencedirect.com/science/article/pii/S0167923604002052.
[27] Hong Yao, Howard J. Hamilton. Mining Itemset Utilities from Transaction Databases. Data Knowl. Eng., 59(3):603—626, 2006. URL http://dx.doi.org/10.1016/j.datak.2005.10.004.
[28] Ethan Zhang, Yi Zhang. F-Measure. Springer US, 2009. URL https://doi.org/10.1007/978-0-387-39940-9_483
[29] Ma, L., & Fan, S. (2017). CURE-SMOTE algorithm and hybrid algorithm for feature selection and parameter optimization based on random forests. BMC Bioinformatics, 18(1), 169
https://doi.org/10.1186/s12859-017-1578-z
[30] Last, F., Douzas, G., & Bacao, F. (2012). Oversampling for Imbalanced Learning Based on K-Means and SMOTE, 1–19.
[31] Douzas, G., & Bacao, F. (2017). Self-Organizing Map Oversampling (SOMO) for imbalanced data set learning. Expert Systems with Applications, 82(Japkowicz 2000), 40–52.
https://doi.org/10.1016/j.eswa.2017.03.073
[32] Chawla, N. V., Lazarevic, A., Hall, L. O., & Bowyer, K. W. (2003). SMOTEBoost: Improving Prediction of the Minority Class in Boosting, 107–119. https://doi.org/10.1007/978-3-540-39804-2_12
[33] Bach, M., Werner, A., Żywiec, J., & Pluskiewicz, W. (2017). The study of under-and oversampling
methods’ utility in analysis of highly imbalanced data on osteoporosis. Information Sciences, 384, 174-190
27 [35] Oskouei, R. J., & Bigham, B. S. (n.d.). Oversampling via Under-Sampling in Strongly Imbalanced Data, 1–10. https://doi.org/10.1504/IJAIP.2017.081179
[36] Ah-Pine, J., & Morales, E. P. S. (2016). A study of synthetic oversampling for twitter imbalanced sentiment analysis. CEUR Workshop Proceedings, 1646, 17–24.
[37] G Douzas, D., Bacao, F., (2018), Effective data generation for imbalanced learning using conditional generative adversarial networks, Expert Systems with Applications 91, 464-471