ACPD
13, 7151–7174, 2013Self-limited uptake ofα-pinene-oxide to
acidic aerosol
G. T. Drozd et al.
Title Page
Abstract Introduction
Conclusions References
Tables Figures
◭ ◮
◭ ◮
Back Close
Full Screen / Esc
Printer-friendly Version
Interactive Discussion
Discussion
P
a
per
|
Dis
cussion
P
a
per
|
Discussion
P
a
per
|
Discussio
n
P
a
per
|
Atmos. Chem. Phys. Discuss., 13, 7151–7174, 2013 www.atmos-chem-phys-discuss.net/13/7151/2013/ doi:10.5194/acpd-13-7151-2013
© Author(s) 2013. CC Attribution 3.0 License.
Atmospheric Chemistry and Physics
Open Access
Discussions
Geoscientific Geoscientific
Geoscientific Geoscientific
This discussion paper is/has been under review for the journal Atmospheric Chemistry and Physics (ACP). Please refer to the corresponding final paper in ACP if available.
Self-limited uptake of
α
-pinene-oxide to
acidic aerosol: the e
ff
ects of liquid-liquid
phase separation and implications for the
formation of secondary organic aerosol
and organosulfates from epoxides
G. T. Drozd, J. L. Woo, and V. F. McNeill
Department of Chemical Engineering, Columbia University, New York, NY, 10027, USA
Received: 5 March 2013 – Accepted: 8 March 2013 – Published: 18 March 2013
Correspondence to: V. F. McNeill (vfm2103@columbia.edu)
ACPD
13, 7151–7174, 2013Self-limited uptake ofα-pinene-oxide to
acidic aerosol
G. T. Drozd et al.
Title Page
Abstract Introduction
Conclusions References
Tables Figures
◭ ◮
◭ ◮
Back Close
Full Screen / Esc
Printer-friendly Version
Interactive Discussion
Discussion
P
a
per
|
Dis
cussion
P
a
per
|
Discussion
P
a
per
|
Discussio
n
P
a
per
|
Abstract
The reactive uptake of α-pinene oxide (αPO) to acidic sulfate aerosol was studied under humid conditions in order to gain insight into the effects of liquid-liquid phase separation on aerosol heterogeneous chemistry and further elucidate the formation of secondary organic aerosol and organosulfates from epoxides. A continuous flow 5
environmental chamber was used to monitor changes in diameter of monodisperse, deliquesced, acidic sulfate particles exposed to αPO at 30 and 50 % RH. In order to induce phase separation and probe potential limits to particle growth from acidic uptake, αPO was introduced over a wide range of concentrations, from 200 ppb to 5 ppm. Uptake was observed to be highly dependent on initial aerosol pH. Significant 10
uptake ofαPO to aerosol was observed with initial pH<0. When exposed to 200 ppb αPO, aerosol with pH=−1 doubled in volume, and 6 % volume growth was observed at pH=0. Aerosol with pH=1 showed no growth. The extreme acidity required for efficient αPO uptake suggests that this chemistry is typically not a major route to formation of aerosol mass or organosulfates in the atmosphere. Partition coefficients (Kp) ranged 15
from 0.2–1.6×10⁻⁴m3µg−1 and were correlated to initial particle acidity and particle
organic content; particles with higher organic content had lower partition coefficients. Effective uptake coefficients (γ) ranged from 0.4 to 4.7×10⁻⁵ and are much lower
than recently reported for uptake to bulk solutions. In experiments in whichαPO was added to bulk H2SO4 solutions, phase separation was observed for mass loadings 20
ACPD
13, 7151–7174, 2013Self-limited uptake ofα-pinene-oxide to
acidic aerosol
G. T. Drozd et al.
Title Page
Abstract Introduction
Conclusions References
Tables Figures
◭ ◮
◭ ◮
Back Close
Full Screen / Esc
Printer-friendly Version
Interactive Discussion
Discussion
P
a
per
|
Dis
cussion
P
a
per
|
Discussion
P
a
per
|
Discussio
n
P
a
per
|
1 Introduction
The reactive uptake of volatile organic compounds (VOCs) by tropospheric aqueous aerosols has recently gained attention as a potential source of secondary organic aerosol (SOA) and organosulfate species (Ervens et al., 2011; Lim et al., 2010; Mc-Neill et al., 2012; Volkamer et al., 2009; Sareen et al., 2010; Kroll et al., 2005; Nozi ´ere 5
et al., 2010; Galloway et al., 2009; Liggio et al., 2005). Volatile compounds can react in the particle phase (e.g. hydrolyzing or oligomerizing) after uptake to form low-volatility products. Recently, interest has grown in reactive uptake for aerosols with significant water content (McNeill et al., 2012). Aqueous uptake and processing of organic matter may be important in explaining the extreme levels of oxidation (O : C≥1) observed in
10
secondary organic aerosol (Lee et al., 2011; McNeill et al., 2012). The focus of this study is the reactive uptake of epoxides to acidic sulfate aerosol and understanding the effects of particle composition on acid-mediated reactive uptake.
Epoxides have been identified as potential SOA precursors in both laboratory studies and thermodynamic calculations, in particular through their ability to form organosul-15
fates (OS) through acid-catalyzed ring opening (Iinuma et al., 2009; Lal et al., 2012; Minerath and Elrod, 2009; Paulot et al., 2009). Recent observations of OS in ambient samples have led to laboratory studies aimed at determining their formation mecha-nisms and organic precursors (Surratt et al., 2006, 2007, 2008; Lin et al., 2011; Hatch et al., 2011; Lal et al., 2012; Minerath et al., 2008, 2009; Minerath and Elrod, 2009; 20
Darer et al., 2011; Hu et al., 2011; Perri et al., 2010). OS yields are known to depend on particle acidity and total aerosol volume (Surratt et al., 2007; Iinuma et al., 2009; Lal et al., 2012; Hu et al., 2011). In addition, while initial OS formation may drive uptake to aerosol, less-substituted OS or those with nearby electron-withdrawing groups may readily hydrolyze to diol compounds (Hu et al., 2011). Laboratory experiments have 25
ACPD
13, 7151–7174, 2013Self-limited uptake ofα-pinene-oxide to
acidic aerosol
G. T. Drozd et al.
Title Page
Abstract Introduction
Conclusions References
Tables Figures
◭ ◮
◭ ◮
Back Close
Full Screen / Esc
Printer-friendly Version
Interactive Discussion
Discussion
P
a
per
|
Dis
cussion
P
a
per
|
Discussion
P
a
per
|
Discussio
n
P
a
per
|
experiments over a wide range of aerosol pH andαPO concentrations to explore the importance of epoxide uptake under ambient conditions.
Reactive uptake can be strongly affected by particle morphology and phase sep-aration of particle organic and inorganic components. After liquid-liquid phase sepa-ration, a core-shell morphology with the organic phase coating the outer surface of 5
the particle has been observed (Bertram et al., 2011; Smith et al., 2012; You et al., 2012). Such a morphology change is expected to impact aerosol heterogeneous chem-istry by changing the surface composition from aqueous to organic (You et al., 2012). Zuend and Seinfeld also showed via calculations that liquid-liquid phase separation can dramatically impact gas-particle partitioning of semivolatile species (Zuend et al., 10
2010). Particles with significant water content may exist in several morphologies. These could include a fully mixed aqueous/organic particle, a phase separated aqueous core with an organic shell, and an aqueous phase partially engulfed by an organic phase (Smith et al., 2012). The organic-rich phase of phase-separated acidic particles may be proton-depleted, with the aqueous phase retaining the initial acidity (Reichardt, 1990; 15
Pavia et al., 1999). In addition, uptake studies with bulk phase mimics of acidic sulfate aerosol particles (e.g. sulfuric acid solutions) do not replicate this complicated phase behavior and may only represent initial uptake rates to systems with low levels of or-ganics. By studying uptake to both bulk solutions and particles over a range of organic content and acidities, we begin to elucidate the effects of particle morphology on uptake 20
to acidic aerosol.
2 Experimental methods
2.1 Smog chamber setup
All chamber experiments were conducted in a∼ 3.5 m3 Teflon chamber as shown in
Fig. 1. The chamber is run in steady-state operation with a constant gas flow of 13 Lpm 25
ACPD
13, 7151–7174, 2013Self-limited uptake ofα-pinene-oxide to
acidic aerosol
G. T. Drozd et al.
Title Page
Abstract Introduction
Conclusions References
Tables Figures
◭ ◮
◭ ◮
Back Close
Full Screen / Esc
Printer-friendly Version
Interactive Discussion
Discussion
P
a
per
|
Dis
cussion
P
a
per
|
Discussion
P
a
per
|
Discussio
n
P
a
per
|
reached between 3 and 4 h. This is consistent with previous static chamber studies of epoxides and similar aerosol acidity, particle concentration, andαPO concentration that indicate reactive uptake reaches steady state after about 2 h (Lin et al., 2011; Iinuma et al., 2009). Prior to each experiment, the bag was rinsed with de-ionized wa-ter and flushed with dry nitrogen to remove any mawa-terial present on the chamber walls. 5
All chamber experiments were conducted at approximately 50 % RH and 25◦C, except for experiments with a particularly high particle acidity of pH=−1, which were run at 30 % RH. A hygrometer (Vaisala) was used to monitor the humidity and temperature of the chamber. The conditions for each experiment are listed in Table 1; also shown are the results of each experiment to be discussed below.
10
The bag was filled with a combination of three flows: humidified nitrogen, ammo-nium sulfate/sulfuric acid aerosol in nitrogen, andαPO in nitrogen. The final humidity was adjusted by combining a nitrogen flow that passed through a water bubbler filled with de-ionized water and a second flow of dry nitrogen. The total humid-nitrogen flow was 11 Lpm. An atomizer (TSI-3076) produced seed particles by atomizing a 0.2 M 15
(NH4)2SO4 with a nitrogen flow rate of 2 Lpm. Particle acidity was altered by adjust-ing the ratio of H2SO4: (NH4)2SO4 in the atomizing solution. In order to achieve pre-cise growth measurements, the atomizer output was size-selected at 150 nm using a DMA operating at a 8 : 0.8 sheath to sample flow (Lpm) ratio. Particle concentrations in the bag were in the range of 1000–3000 cm−3. αPO (Sigma Aldrich, >97 %) va-20
por was injected at variable concentrations by passing nitrogen over liquidαPO held at varying temperature, which was controlled using a cold finger setup. To run below ambient temperatures, the cold finger was immersed in a dewar filled with either ice (0◦C) or an NaCl/ice bath (−20◦C). The concentration of theαPO delivered from the
cold finger was calibrated in a separate set of experiments with a custom-built chem-25
ACPD
13, 7151–7174, 2013Self-limited uptake ofα-pinene-oxide to
acidic aerosol
G. T. Drozd et al.
Title Page
Abstract Introduction
Conclusions References
Tables Figures
◭ ◮
◭ ◮
Back Close
Full Screen / Esc
Printer-friendly Version
Interactive Discussion
Discussion
P
a
per
|
Dis
cussion
P
a
per
|
Discussion
P
a
per
|
Discussio
n
P
a
per
|
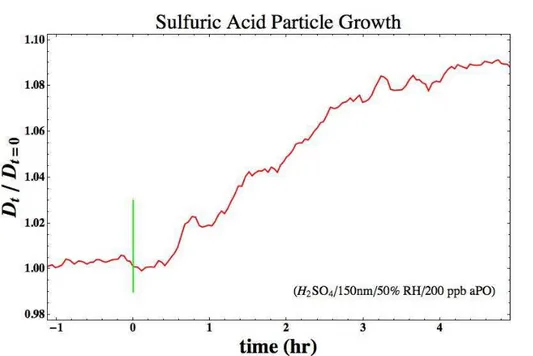
2.2 Chamber operation
Data from a typical experiment are shown in Fig. 2. After a stable initial diameter is achieved for the seed particles, in this case ∼150 nm pure sulfuric acid particles at
50 % RH, theαPO flow was initiated. After∼30 min lag period, particles are observed at larger diameters. After injecting αPO for roughly 4 h, the particles in the chamber 5
attain a stable output diameter.
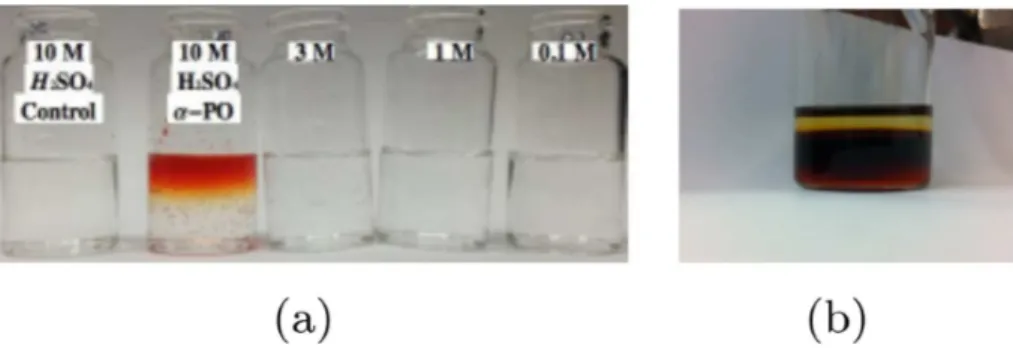
2.3 Bulk uptake studies
2.3.1 Gas phase uptake to bulk surfaces
The phase behavior and diffusivity of αPO reactive uptake products were observed in additional experiments in which gas-phase αPO was taken up by bulk aqueous 10
sulfuric acid samples. 4 vials with 10 mL of sulfuric acid of varying concentration in water (10, 3, 1, and 0.1 M) and 1 vial with 3 mL of pure αPO were placed beneath a large inverted beaker. This created a sustained exposure of the acid surface to the room temperature vapor pressure of gas-phase αPO (0.819 torr, 25◦C). Vials after 18 h ofαPO exposure are shown in Fig. 3a. In the 10 M acid solution, a light-red layer 15
was formed at the solution surface within several hours and continued to thicken with longerαPO exposure. The 3 M solution became slightly cloudy, and none of the other solutions formed visible products from αPO exposure. The top and bottom layer of the acid solutions were extracted with a pipette, and the UV-Vis absorbance spectra of these fractions were measured. Digital photographs of the 10 M reaction vials were 20
ACPD
13, 7151–7174, 2013Self-limited uptake ofα-pinene-oxide to
acidic aerosol
G. T. Drozd et al.
Title Page
Abstract Introduction
Conclusions References
Tables Figures
◭ ◮
◭ ◮
Back Close
Full Screen / Esc
Printer-friendly Version
Interactive Discussion
Discussion
P
a
per
|
Dis
cussion
P
a
per
|
Discussion
P
a
per
|
Discussio
n
P
a
per
|
2.3.2 Slow addition of liquidαPO to bulk acid solution
To deliver a larger volume fraction ofαPO, 3 mL of liquidαPO was slowly added at 750µL h−1 to 3 mL of sulfuric acid solutions with a syringe pump to achieve a 50 % volume fraction ofαPO after 3 h. For both the 10 M and 3 M acid concentrations, visible phase separation occurred; the vial with 10 M acid is shown in Fig. 3b.
5
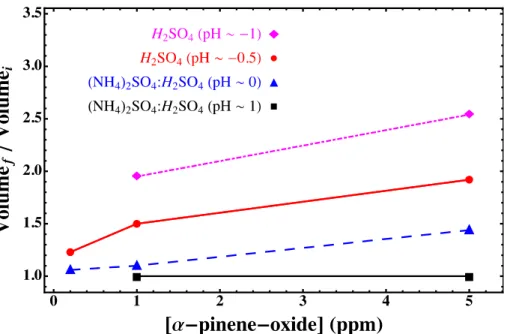
3 Results and discussion
3.1 Uptake ofαPO to particles: effect ofαPO concentration and particle acidity
The volume-growth factor, defined as the ratio between the final and initial volumes (Vf/Vi), increased with the gas-phaseαPO concentration. These results are displayed in Fig. 4 and Table 1 for experiments for several particle acidities. High particle acidity and 10
gas-phaseαPO concentration resulted in very high growth factors and particle organic content. For particles with pH∼ −0.5 and 5 ppmαPO, the growth factor is greater than 2 and the organic fraction of the particle, (Vf/Vi−1)/Vfreaches nearly 50 %.
The clear trend of increased uptake with particle acidity indicates that αPO only forms SOA under conditions of reactive uptake. This is consistent with the relatively 15
low aqueous solubility ofαPO (219 mg L−1or roughly 0.02 % by mass). Previous mea-surements have also shownαPO uptake to be strongly dependent on particle acidity (Surratt et al., 2006, 2007; Lin et al., 2011; Iinuma et al., 2009; Lal et al., 2012). Iinuma et al. ran experiments with acidic (pH=0) and neutral aerosol, but only observed up-take at pH=0 (Lal et al., 2012). Surratt and co-workers also observed a strong pH 20
ACPD
13, 7151–7174, 2013Self-limited uptake ofα-pinene-oxide to
acidic aerosol
G. T. Drozd et al.
Title Page
Abstract Introduction
Conclusions References
Tables Figures
◭ ◮
◭ ◮
Back Close
Full Screen / Esc
Printer-friendly Version
Interactive Discussion
Discussion
P
a
per
|
Dis
cussion
P
a
per
|
Discussion
P
a
per
|
Discussio
n
P
a
per
|
3.2 Partitioning coefficients
To quantify the partitioning of a gas-phase component to the aqueous aerosol, we use an effective partitioning coefficient,Kp,eff (µg m−3):
Kp,eff= ∆Cp,tot
Cg×Cp,tot (1)
where∆Cp,tot is the increase in total particle mass concentration from gas uptake,Cg 5
is the mass concentration of organic precursor in the gas phase, andCp,tot is the total particle mass concentration, all expressed in (µg m−3). The partitioning coefficient is shown as a function of particle growth factor in Fig. 5. A value of 2.8×10⁻⁴m3µ−1g−1
was measured by Iinuma et al. under conditions of 50 ppbαPO, 4×10⁻⁶cm3m−3seed concentration, and particles with pH=0 (Iinuma et al., 2009). We measuredKp,effunder 10
similar conditions and 200 ppb αPO to be between 0.4–1×10⁻⁴m3µ−1g−1. This is good agreement given measurement uncertainty and the observed increase in uptake coefficient with lowerαPO concentration.
As shown in Fig. 5, the partitioning coefficient decreases with increasing growth factor. In other words, as the organic fraction of the particle becomes greater, the affinity 15
ofαPO for the particle decreases. The trend of uptake with growth factor suggests that changes in particle composition and/or morphology uponαPO uptake play a major role in determiningαPO partitioning to acidic particles.
3.3 Uptake ofαPO to bulk solutions
The uptake of αPO to bulk sulfuric acid solutions was strongly pH-dependent. The 20
ACPD
13, 7151–7174, 2013Self-limited uptake ofα-pinene-oxide to
acidic aerosol
G. T. Drozd et al.
Title Page
Abstract Introduction
Conclusions References
Tables Figures
◭ ◮
◭ ◮
Back Close
Full Screen / Esc
Printer-friendly Version
Interactive Discussion
Discussion
P
a
per
|
Dis
cussion
P
a
per
|
Discussion
P
a
per
|
Discussio
n
P
a
per
|
dilution with water (see Supplement). The change in thickness of the red layer over time allowed an estimate of the diffusivity for the reactive uptake products ofαPO. After 45 h the products formed a layer roughly 1.5 cm thick. Fick’s law (Eq. 2) gives a relationship between diffusivity, D, the distance traveled in a given direction, x, and the elapsed time,t:
5
D=x 2
2t (2)
The diffusivity of the reaction products is calculated to be 9×10⁻⁶cm2s−1. This value
is similar to that of glucose in water (Gladden and Dole, 1953), and does not indicate particularly low diffusivity.
Liquid–liquid phase separation was observed at higher mass loadings ofαPO. Using 10
a syringe pump, liquidαPO was slowly injected to the surface of sulfuric acid solutions. The flow rate was set to give a similar volume-addition rate of αPO to the acid solu-tion as was observed in the particle uptake experiments, doubling the solusolu-tion volume over 3 h. Phase separation occurred for both the 10 and 3 M sulfuric acid solutions, but the organic phase in the 3 M solutions was not colored, consistent with our other 15
bulk experiments. TheαPO concentration in a solution or particle will affect the prod-uct distribution, because a higher organic concentration will favor oligomerization. Lal et al. observed a change in the product distribution in bulk studies of the mixed liquids with different αPO : acid mass ratios, suggesting that the concentration of organics at the bulk surface or in a particle affects the product distribution (Lal et al., 2012). 20
Standard organic synthesis has shown that, at least in bulk sulfuric acid solutions, the hydrolysis products involve opening of the 4-member ring inαPO (Coelho et al., 2012). This is not likely to be reversible and retains a double bond that will allow for further reaction. The estimation of relatively fast diffusion rates in these systems and the decreasedKp values at high-mass loading experiments suggest that products of 25
ACPD
13, 7151–7174, 2013Self-limited uptake ofα-pinene-oxide to
acidic aerosol
G. T. Drozd et al.
Title Page
Abstract Introduction
Conclusions References
Tables Figures
◭ ◮
◭ ◮
Back Close
Full Screen / Esc
Printer-friendly Version
Interactive Discussion
Discussion
P
a
per
|
Dis
cussion
P
a
per
|
Discussion
P
a
per
|
Discussio
n
P
a
per
|
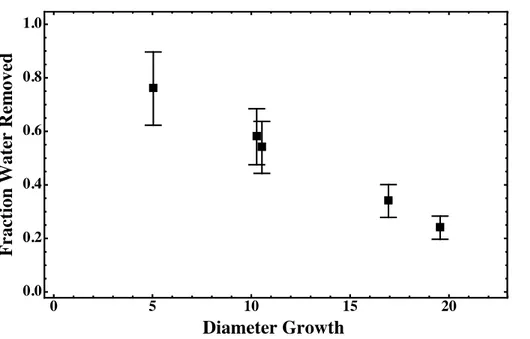
3.4 Loss of water upon drying
Particles were dried after organic uptake in order to get more information about their phase/morphology. The results from drying are shown in Table 1 and also Fig. 6 as diameter growth vs. the fraction of water lost from the particle. The fraction of water lost is calculated as:
5
Floss= Vwet
−VDry
V(H2O)RH,wet−V(H2O)RH,Dry
(3)
where Vwet and VDry are the particle volumes before and after the drier, and V(H2O)RH,Wet and V(H2O)RH,Dry are the volumes of water at the RH conditions before and after the drier. The volumes of water can be predicted from the efflorescence and deliquescence curves for sulfuric acid and ammonium sulfate (Seinfeld and Pandis, 10
2006b). We observe a clear trend in the fraction of the total particle-water lost with the increase in particle diameter. Greater particle diameter growth (i.e. a thicker organic coating) led to decreased water loss from the particles. This suggests that the organic component of the particle inhibited evaporation.
Separation of the particles into water-rich and organic-rich liquid phases is suggested 15
by our bulk-phase studies. This is consistent with recent studies by Bertram et al. which showed phase separation for particles of ammonium sulfate and organic compounds that have atomic O : C ratios of less than 0.7, and product studies of αPO+H2SO4 suggest material with O : C of 0.2–0.5 is formed (Lal et al., 2012; Iinuma et al., 2009; Coelho et al., 2012). In their studies, Bertram et al. observed a core-shell morphology 20
for phase separated particles, with the organic phase on the outside. Inhibition of water loss from particles with high organic content is consistent with slow diffusion of water out of the particle through the organic-rich phase of the particle. The observed trend in water loss highlights the importance of phase separation in predicting the effects of RH on particle mixing state and water uptake/loss.
ACPD
13, 7151–7174, 2013Self-limited uptake ofα-pinene-oxide to
acidic aerosol
G. T. Drozd et al.
Title Page
Abstract Introduction
Conclusions References
Tables Figures
◭ ◮
◭ ◮
Back Close
Full Screen / Esc
Printer-friendly Version
Interactive Discussion
Discussion
P
a
per
|
Dis
cussion
P
a
per
|
Discussion
P
a
per
|
Discussio
n
P
a
per
|
3.5 Uptake coefficients
The dynamic uptake of gases to the particle surface is determined by the uptake co-efficient. It characterizes the collision efficiency for uptake of an organic molecule to a surface. Assuming a set timescale to grow to the final diameter, we can estimate this parameter, and then compare this value to previous measurements and values for 5
similar cases. Our experiments do not directly yield the timescale to reach the final growth factor, because the experimental timescale is determined by the time to reach steady state in the continuous-flow chamber. We can use the estimate of∼1.5 h. from the batch reactor experiments of Iinuma et al. as a guide (Iinuma et al., 2009). Assum-ing a constant particle density, there is a simple relation between the mass flux and 10
molecular collision with a particle that yields the uptake coefficient:
∆Dp=γωCgasMWgas
4ρ ∆t (4)
where ∆Dp is the change in particle diameter, γ is the uptake coefficient, ω is the molecular speed,Cgas is the condensing species’ gas-phase concentration, MWgas is the molecular weight of the condensing species, ρ is the particle density, and ∆t is 15
the duration of condensation. As a first approximation we can use this relation to cal-culate an average uptake coefficient during the course of an experiment. Using the timescale from Iinuma et al. we calculate uptake coefficients between 1 and 50×10−6.
These values, shown in Fig. 7, are particularly low for reactive uptake of organics. Lal et al. have measured uptake coefficients forαPO to bulk sulfuric acid surfaces to 20
be 4.6×10⁻², and uptake coefficients for other reactive organics are in the range of
1×10⁻³ (Lal et al., 2012; Liggio et al., 2005). The absorbing phase in the previous studies ofαPO to bulk solution does not reach high volume fractions of organics, so these measurements might reflect only initial uptake ofαPO to particles, before accu-mulation (or without the presence) of organic material. Our low values for the effective 25
ACPD
13, 7151–7174, 2013Self-limited uptake ofα-pinene-oxide to
acidic aerosol
G. T. Drozd et al.
Title Page
Abstract Introduction
Conclusions References
Tables Figures
◭ ◮
◭ ◮
Back Close
Full Screen / Esc
Printer-friendly Version
Interactive Discussion
Discussion
P
a
per
|
Dis
cussion
P
a
per
|
Discussion
P
a
per
|
Discussio
n
P
a
per
|
organics and decreases as the particle accumulates organic material. SinceαPO up-take is driven by reaction with acid in the aqueous phase, this is again consistent with the formation of an organic-rich phase at the gas-aerosol interface.
4 Conclusions
We have demonstrated via bulk and aerosol chamber measurements that the reactive 5
uptake of αPO to acidic aerosol is self-limiting due to liquid-liquid phase separation at high organic loadings. Both the effective partition coefficients and uptake coeffi -cients decreased for particles with higher volume fractions of organics, and inhibited water loss was observed at high organic loadings. In experiments using bulk solutions, phase separation was observed for solutions with high volume fractions ofαPO and 10
its reaction products. Similar effects are possible for aqueous aerosol SOA formation in other systems with O : C ratios<0.7 (and therefore liquid-liquid phase separation is predicted) (Bertram et al., 2011). In scenarios where isoprene epoxydiols or glyoxal dominate uptake to the aerosol aqueous phase, the O : C ratio is expected to be>0.7, so this effect may not limit SOA formation via those pathways (McNeill et al., 2012). 15
However, more experimental evidence is needed to confirm this prediction.
To date, studies have only shown uptake of monoterpene-derived epoxides at an aerosol pH of zero. Our results support this fact and show that even at an aerosol pH of 1.0, no observable uptake occurred forαPO. This suggests that under typical am-bient conditions, significant formation of monoterpene-derived SOA or organosulfate 20
ACPD
13, 7151–7174, 2013Self-limited uptake ofα-pinene-oxide to
acidic aerosol
G. T. Drozd et al.
Title Page
Abstract Introduction
Conclusions References
Tables Figures
◭ ◮
◭ ◮
Back Close
Full Screen / Esc
Printer-friendly Version
Interactive Discussion
Discussion
P
a
per
|
Dis
cussion
P
a
per
|
Discussion
P
a
per
|
Discussio
n
P
a
per
|
Supplementary material related to this article is available online at: http://www.atmos-chem-phys-discuss.net/13/7151/2013/
acpd-13-7151-2013-supplement.pdf.
Acknowledgements. This work was supported by the Camille & Henry Dreyfus Foundation Postdoctoral Program in Environmental Chemistry and the NASA Tropospheric Chemistry pro-5
gram (Grant NNX09AF26G).
References
Bertram, A. K., Martin, S. T., Hanna, S. J., Smith, M. L., Bodsworth, A., Chen, Q., Kuwata, M., Liu, A., You, Y., and Zorn, S. R.: Predicting the relative humidities of liquid-liquid phase
sep-aration, efflorescence, and deliquescence of mixed particles of ammonium sulfate, organic
10
material, and water using the organic-to-sulfate mass ratio of the particle and the oxygen-to-carbon elemental ratio of the organic component, Atmos. Chem. Phys., 11, 10995–11006, doi:10.5194/acp-11-10995-2011, 2011.
Coelho, J. V., de Meireles, A. L. P., da Silva Rocha, K. A., Pereira, M. C., Oliveira, L. C. A., and
Gusevskaya, E. V.: Isomerization of±-pinene oxide catalyzed by iron-modified mesoporous
15
silicates, Appl. Catal. A-Gen., 443–444, 125–132, doi:10.1016/j.apcata.2012.07.030, 2012. Darer, A. I., Cole-Filipiak, N. C., O’Connor, A. E., and Elrod, M. J.: Formation and stability of
atmospherically relevant isoprene-derived organosulfates and organonitrates, Environ. Sci. Technol., 45, 1895–1902, doi:10.1021/es103797z, 2011.
Ervens, B., Turpin, B. J., and Weber, R. J.: Secondary organic aerosol formation in cloud 20
droplets and aqueous particles (aqSOA): a review of laboratory, field and model studies, Atmos. Chem. Phys., 11, 11069–11102, doi:10.5194/acp-11-11069-2011, 2011.
Galloway, M. M., Chhabra, P. S., Chan, A. W. H., Surratt, J. D., Flagan, R. C., Seinfeld, J. H., and Keutsch, F. N.: Glyoxal uptake on ammonium sulphate seed aerosol: reaction products and reversibility of uptake under dark and irradiated conditions, Atmos. Chem. Phys., 9, 3331– 25
3345, doi:10.5194/acp-9-3331-2009, 2009.
Gladden, J. K. and Dole, M.: Diffusion in supersaturated solutions. I I. Glucose solutions, J. Am.
ACPD
13, 7151–7174, 2013Self-limited uptake ofα-pinene-oxide to
acidic aerosol
G. T. Drozd et al.
Title Page
Abstract Introduction
Conclusions References
Tables Figures
◭ ◮
◭ ◮
Back Close
Full Screen / Esc
Printer-friendly Version
Interactive Discussion
Discussion
P
a
per
|
Dis
cussion
P
a
per
|
Discussion
P
a
per
|
Discussio
n
P
a
per
|
Hatch, L. E., Creamean, J. M., Ault, A. P., Surratt, J. D., Chan, M. N., Seinfeld, J. H., Edger-ton, E. S., Su, Y., and Prather, K. A.: Measurements of isoprene-derived organosulfates in ambient aerosols by aerosol time-of-flight mass spectrometry – Part 2: Temporal variability and formation mechanisms, Environ. Sci. Technol., 45, 8648–8655, doi:10.1021/es2011836, 2011.
5
Hu, K. S., Darer, A. I., and Elrod, M. J.: Thermodynamics and kinetics of the hydrolysis of atmospherically relevant organonitrates and organosulfates, Atmos. Chem. Phys., 11, 8307– 8320, doi:10.5194/acp-11-8307-2011, 2011.
Iinuma, Y., Boge, O., Kahnt, A., and Herrmann, H.: Laboratory chamber studies on the formation of organosulfates from reactive uptake of monoterpene oxides, Phys. Chem. Chem. Phys., 10
11, 7985–7997, doi:10.1039/b904025k, 2009.
Kroll, J. H., Ng, N. L., Murphy, S. M., Varutbangkul, V., Flagan, R. C., and Seinfeld, J. H.: Chamber studies of secondary organic aerosol growth by reactive uptake of simple carbonyl compounds, J. Geophys. Res.-Atmos., 110, doi:10.1029/2005jd006004, 2005.
Lal, V., Khalizov, A. F., Lin, Y., Galvan, M. D., Connell, B. T., and Zhang, R.: Hetero-15
geneous Reactions of Epoxides in Acidic Media, J. Phys. Chem. A, 116, 6078–6090, doi:10.1021/jp2112704, 2012.
Lee, A. K. Y., Herckes, P., Leaitch, W. R., Macdonald, A. M., and Abbatt, J. P. D.: Aqueous OH oxidation of ambient organic aerosol and cloud water organics: formation of highly oxidized products, Geophys. Res. Lett., 38, L11805, doi:10.1029/2011gl047439, 2011.
20
Liggio, J., Li, S.-M., and McLaren, R.: Reactive uptake of glyoxal by particulate matter, J. Geo-phys. Res., 110, D10304, doi:10.1029/2004jd005113, 2005.
Lim, Y. B., Tan, Y., Perri, M. J., Seitzinger, S. P., and Turpin, B. J.: Aqueous chemistry and its role in secondary organic aerosol (SOA) formation, Atmos. Chem. Phys., 10, 10521–10539, doi:10.5194/acp-10-10521-2010, 2010.
25
Lin, Y.-H., Zhang, Z., Docherty, K. S., Zhang, H., Budisulistiorini, S. H., Rubitschun, C. L., Shaw, S. L., Knipping, E. M., Edgerton, E. S., Kleindienst, T. E., Gold, A., and Surratt, J. D.: Isoprene epoxydiols as precursors to secondary organic aerosol formation: acid-catalyzed reactive uptake studies with authentic compounds, Environ. Sci. Techol., 46, 250–258, doi:10.1021/es202554c, 2011.
30
forma-ACPD
13, 7151–7174, 2013Self-limited uptake ofα-pinene-oxide to
acidic aerosol
G. T. Drozd et al.
Title Page
Abstract Introduction
Conclusions References
Tables Figures
◭ ◮
◭ ◮
Back Close
Full Screen / Esc
Printer-friendly Version
Interactive Discussion
Discussion
P
a
per
|
Dis
cussion
P
a
per
|
Discussion
P
a
per
|
Discussio
n
P
a
per
|
tion in atmospheric aerosols: a modeling study, Environ. Sci. Techol., 46, 8075–8081, doi:10.1021/es3002986, 2012.
Minerath, E. C. and Elrod, M. J.: Assessing the potential for diol and hydroxy sulfate ester formation from the reaction of epoxides in tropospheric aerosols, Environ. Sci. Techol., 43, 1386–1392, doi:10.1021/es8029076, 2009.
5
Minerath, E. C., Casale, M. T., and Elrod, M. J.: Kinetics feasibility study of alcohol sul-fate esterification reactions in tropospheric aerosols, Environ. Sci. Techol., 42, 4410–4415, doi:10.1021/es8004333, 2008.
Minerath, E. C., Schultz, M. P., and Elrod, M. J.: Kinetics of the reactions of isoprene-derived epoxides in model tropospheric aerosol solutions, Environ. Sci. Techol., 43, 8133–8139, 10
doi:10.1021/es902304p, 2009.
Nozi ´ere, B., Dziedzic, P., and C ´ordova, A.: Inorganic ammonium salts and carbonate salts are
efficient catalysts for aldol condensation in atmospheric aerosols, Phys. Chem. Chem. Phys.,
12, 3864–3872, 2010.
Paulot, F., Crounse, J. D., Kjaergaard, H. G., Kurten, A., St. Clair, J. M., Seinfeld, J. H., and 15
Wennberg, P. O.: Unexpected epoxide formation in the gas-phase photooxidation of isoprene, Science, 325, 730–733, 2009.
Pavia, D., Lampman, G., and Kriz, G.: Organic Laboratoy Techniques, 3 edn., Brooks/Cole, Pacific Grove, CA, 1999.
Perri, M. J., Lim, Y. B., Seitzinger, S. P., and Turpin, B. J.: Organosulfates from glycolalde-20
hyde in aqueous aerosols and clouds: laboratory studies, Atmos. Environ., 44, 2658–2664, doi:10.1016/j.atmosenv.2010.03.031, 2010.
Reichardt, C.: Solvents and solvent effects in organic chemistry, VCH Weinheim, Basel,
Switzerland, 1990.
Sareen, N., Schwier, A. N., Shapiro, E. L., Mitroo, D., and McNeill, V. F.: Secondary organic 25
material formed by methylglyoxal in aqueous aerosol mimics, Atmos. Chem. Phys., 10, 997– 1016, doi:10.5194/acp-10-997-2010, 2010.
Seinfeld, J. H. and Pandis, S. N.: Atmospheric Chemistry and Physics, 2 edn., Wiley, Hoboken, New Jersey, 2006.
Smith, M. L., Bertram, A. K., and Martin, S. T.: Deliquescence, efflorescence, and phase
misci-30
ACPD
13, 7151–7174, 2013Self-limited uptake ofα-pinene-oxide to
acidic aerosol
G. T. Drozd et al.
Title Page
Abstract Introduction
Conclusions References
Tables Figures
◭ ◮
◭ ◮
Back Close
Full Screen / Esc
Printer-friendly Version
Interactive Discussion
Discussion
P
a
per
|
Dis
cussion
P
a
per
|
Discussion
P
a
per
|
Discussio
n
P
a
per
|
Surratt, J. D., Kroll, J. H., Kleindienst, T. E., Edney, E. O., Claeys, M., Sorooshian, A., Ng, N. L.,
Offenberg, J. H., Lewandowski, M., Jaoui, M., Flagan, R. C., and Seinfeld, J. H.:
Evi-dence for organosulfates in secondary organic aerosol, Environ. Sci. Techol., 41, 517–527, doi:10.1021/es062081q, 2006.
Surratt, J. D., Lewandowski, M., Offenberg, J. H., Jaoui, M., Kleindienst, T. E., Edney, E. O.,
5
and Seinfeld, J. H.: Effect of acidity on secondary organic aerosol formation from isoprene,
Environ. Sci. Techol., 41, 5363–5369, doi:10.1021/es0704176, 2007.
Surratt, J. D., Gom ´ez-Gonz ´alez, Y., Chan, A. W. H., Vermeylen, R., Shahgholi, M.,
Kleindi-enst, T. E., Edney, E. O., Offenberg, J. H., Lewandowski, M., Jaoui, M., Maenhaut, W.,
Claeys, M., Flagan, R. C., and Seinfeld, J. H.: Organosulfate formation in biogenic secondary 10
organic aerosol, J. Phys. Chem. A, 112, 8345–8378, doi:10.1021/jp802310p, 2008.
Volkamer, R., Ziemann, P. J., and Molina, M. J.: Secondary Organic Aerosol Formation from
Acetylene (C2H2): seed effect on SOA yields due to organic photochemistry in the aerosol
aqueous phase, Atmos. Chem. Phys., 9, 1907–1928, doi:10.5194/acp-9-1907-2009, 2009.
You, Y., Renbaum-Wolff, L., Carreras-Sospedra, M., Hanna, S. J., Hiranuma, N., Kamal, S.,
15
Smith, M. L., Zhang, X., Weber, R. J., Shilling, J. E., Dabdub, D., Martin, S. T., and Bertram, A. K.: Images reveal that atmospheric particles can undergo liquid–liquid phase separations, P. Natl. Acad. Sci. USA, 109, 13188–13193, doi:10.1073/pnas.1206414109, 2012.
Zuend, A., Marcolli, C., Peter, T., and Seinfeld, J. H.: Computation of liquid-liquid equilibria and 20
ACPD
13, 7151–7174, 2013Self-limited uptake ofα-pinene-oxide to
acidic aerosol
G. T. Drozd et al.
Title Page
Abstract Introduction
Conclusions References
Tables Figures
◭ ◮
◭ ◮
Back Close
Full Screen / Esc
Printer-friendly Version
Interactive Discussion
Discussion
P
a
per
|
Dis
cussion
P
a
per
|
Discussion
P
a
per
|
Discussio
n
P
a
per
|
Table 1.Summary of experimental conditions.
Expt. # 1 2 3 4 5 6 7 8 9 10
pHa −1 −1 −0.5 −0.5 −0.5 0 0 0 1 1
αPO (ppm) 5 1 5 1 0.2 5 1 0.2 5 1 Initial Diameter (nm) 160 146 163 155 147 170 165 165 175 170 Growth Factorb 2.55 1.93 1.92 1.48 1.23 1.44 1.1 1.06 0 0 Fraction water lostc – 0.34 0.24 0.58 0.76 0.54 – – – – Init. water contentd 33 % 33 % 58 % 58 % 58 % 46 % 46 % 46 % 41 % 41 % (vol/vol)
apH values calculated using atomizing solution. b
Ratio of final to initial particle volume:Vf/Vi.
cSee results and discussion.
ACPD
13, 7151–7174, 2013Self-limited uptake ofα-pinene-oxide to
acidic aerosol
G. T. Drozd et al.
Title Page
Abstract Introduction
Conclusions References
Tables Figures
◭ ◮
◭ ◮
Back Close
Full Screen / Esc
Printer-friendly Version
Interactive Discussion
Discussion
P
a
per
|
Dis
cussion
P
a
per
|
Discussion
P
a
per
|
Discussio
n
P
a
per
|
Fig. 2.Change in diameter of 150 nm sulfuric acid aerosol particles at 50 % RH due to uptake
ofαPO (200 ppb) during the approach to steady state in the continuous-flow chamber. See text
ACPD
13, 7151–7174, 2013Self-limited uptake ofα-pinene-oxide to
acidic aerosol
G. T. Drozd et al.
Title Page
Abstract Introduction
Conclusions References
Tables Figures
◭ ◮
◭ ◮
Back Close
Full Screen / Esc
Printer-friendly Version
Interactive Discussion
Discussion
P
a
per
|
Dis
cussion
P
a
per
|
Discussion
P
a
per
|
Discussio
n
P
a
per
|
Fig. 3. (a)Photograph of reaction vials after 19 h of gas-phase uptake toαPO to acid solutions of (second on left to right) 10, 3, 1, and 0.1 M. At the far left is a control vial of 10 M acid not
exposed toαPO.(b)Photograph of a reaction vial with slow addition of liquidαPO (750 µL h−1)
ACPD
13, 7151–7174, 2013Self-limited uptake ofα-pinene-oxide to
acidic aerosol
G. T. Drozd et al.
Title Page
Abstract Introduction
Conclusions References
Tables Figures
◭ ◮
◭ ◮
Back Close
Full Screen / Esc
Printer-friendly Version
Interactive Discussion
Discussion
P
a
per
|
Dis
cussion
P
a
per
|
Discussion
P
a
per
|
Discussio
n
P
a
per
|
Fig. 4.Effect of acidity andαPO concentration on the growth factor of acidic sulfate particles (pH−1: magenta diamonds, pH−0.5: redcircles, pH 0: blue triangles, pH 1: black squares).
ACPD
13, 7151–7174, 2013Self-limited uptake ofα-pinene-oxide to
acidic aerosol
G. T. Drozd et al.
Title Page
Abstract Introduction
Conclusions References
Tables Figures
◭ ◮
◭ ◮
Back Close
Full Screen / Esc
Printer-friendly Version
Interactive Discussion
Discussion
P
a
per
|
Dis
cussion
P
a
per
|
Discussion
P
a
per
|
Discussio
n
P
a
per
|
Fig. 5.Effective partitioning coefficients as a function of particle growth factor. Data are shown
for three particle pH levels:−1 (magenta, dashed, circles),−0.5 (red, solid, circles), 0 (blue,
dot-dashed, asterisks). Partitioning coefficients increase with increasing particle acidity and
ACPD
13, 7151–7174, 2013Self-limited uptake ofα-pinene-oxide to
acidic aerosol
G. T. Drozd et al.
Title Page
Abstract Introduction
Conclusions References
Tables Figures
◭ ◮
◭ ◮
Back Close
Full Screen / Esc
Printer-friendly Version
Interactive Discussion
Discussion
P
a
per
|
Dis
cussion
P
a
per
|
Discussion
P
a
per
|
Discussio
n
P
a
per
|
Fig. 7.Uptake coefficient dependence on growth factor for particles in the pH range−1 to 0.