www.atmos-chem-phys.net/16/7969/2016/ doi:10.5194/acp-16-7969-2016
© Author(s) 2016. CC Attribution 3.0 License.
Observations and implications of liquid–liquid phase separation at
high relative humidities in secondary organic material produced by
α
-pinene ozonolysis without inorganic salts
Lindsay Renbaum-Wolff1,a,*, Mijung Song1,b,*, Claudia Marcolli2,3, Yue Zhang4,a, Pengfei F. Liu4, James W. Grayson1, Franz M. Geiger5, Scot T. Martin4,6, and Allan K. Bertram1
1Department of Chemistry, University of British Columbia, Vancouver, BC, V6T 1Z1, Canada 2Marcolli Chemistry and Physics Consulting GmbH, Zurich, Switzerland
3Institute for Atmospheric and Climate Science, ETH Zurich, Zurich, Switzerland
4School of Engineering and Applied Sciences, Harvard University, Cambridge, MA 02138, USA 5Department of Chemistry, Northwestern University, Evanston, IL 60208, USA
6Department of Earth and Planetary Sciences, Harvard University, Cambridge, MA 02138, USA
anow at: Aerodyne Research, Inc, Billerica, MA 01821 and Boston College, Chestnut Hill, MA 02467, USA
bnow at: Department of Earth and Environmental Sciences, Chonbuk National University, Jeollabuk-do, Republic of Korea *These authors contributed equally to this work.
Correspondence to:Allan K. Bertram ([email protected]) and Scot T. Martin ([email protected]) Received: 18 October 2015 – Published in Atmos. Chem. Phys. Discuss.: 26 November 2015
Revised: 14 April 2016 – Accepted: 6 May 2016 – Published: 1 July 2016
Abstract.Particles consisting of secondary organic material (SOM) are abundant in the atmosphere. To predict the role of these particles in climate, visibility and atmospheric chem-istry, information on particle phase state (i.e., single liquid, two liquids and solid) is needed. This paper focuses on the phase state of SOM particles free of inorganic salts produced by the ozonolysis ofα-pinene. Phase transitions were investi-gated in the laboratory using optical microscopy and theoreti-cally using a thermodynamic model at 290 K and for relative humidities ranging from <0.5 to 100 %. In the laboratory studies, a single phase was observed from 0 to 95 % relative humidity (RH) while two liquid phases were observed above 95 % RH. For increasing RH, the mechanism of liquid–liquid phase separation (LLPS) was spinodal decomposition. The RH range over which two liquid phases were observed did not depend on the direction of RH change. In the modeling studies, the SOM took up very little water and was a sin-gle organic-rich phase at low RH values. At high RH, the SOM underwent LLPS to form an organic-rich phase and a water-rich phase, consistent with the laboratory studies. The presence of LLPS at high RH values can have consequences for the cloud condensation nuclei (CCN) activity of SOM
particles. In the simulated Köhler curves for SOM particles, two local maxima were observed. Depending on the compo-sition of the SOM, the first or second maximum can deter-mine the critical supersaturation for activation. Recently re-searchers have observed inconsistencies between measured CCN properties of SOM particles and hygroscopic growth measured below water saturation (i.e., hygroscopic parame-ters measured below water saturation were inconsistent with hygroscopic parameters measured above water saturation). The work presented here illustrates that such inconsistencies are expected for systems with LLPS when the water uptake at subsaturated conditions represents the hygroscopicity of an organic-rich phase while the barrier for CCN activation can be determined by the second maximum in the Köhler curve when the particles are water rich.
1 Introduction
Jimenez et al., 2009). SOM in the particle phase consists of the low volatility fraction of the oxidized products of bio-genic or anthropobio-genic volatile organic compounds (Hal-lquist et al., 2009). To predict the role of SOM particles for climate, visibility and atmospheric chemistry, information on the phase state within individual SOM particles (e.g., one liquid, two liquids and one solid) is needed. Particle phase state influences the properties of particles such as cloud con-densation nuclei (CCN) properties, optical properties and in-teractions with reactive and non-reactive gas-phase species (Martin et al., 2000; Raymond and Pandis, 2002; Bilde and Svenningsson, 2004; Zuend et al., 2010; Kuwata and Martin, 2012).
A possible phase transition of SOM particles during rel-ative humidity (RH) cycling is liquid–liquid phase separa-tion (LLPS) (Pankow et al., 2003; Petters et al., 2006). LLPS has been observed in the laboratory when SOM produced by α-pinene ozonolysis was combined with ammonium sulfate and for other organic systems when mixed with inorganic salts when the average organic oxygen-to-carbon elemental ratios (O : C) were less than approximately 0.8 (Krieger et al., 2012; You et al., 2014). The presence of the ammonium sulfate causes salting-out of the organic material and the for-mation of two liquid phases. However, we are not aware of previous laboratory studies focusing on LLPS in SOM in the absence of inorganic salts.
This paper focuses on phase transitions of SOM produced byα-pinene ozonolysis free of inorganic salts.α-pinene was chosen for the precursor gas for SOM because it is an impor-tant contributor to organic particle mass in the atmosphere, especially in regions such as boreal forests (Cavalli et al., 2006). Phase transitions were investigated both in the labo-ratory and with a thermodynamic model over the range of < 0.5 % to 100 % RH.
2 Methods
2.1 Laboratory studies
2.1.1 Production and collection of secondary organic material
Particles of secondary organic material were produced by α-pinene ozonolysis in a flow tube reactor by the methods de-scribed in Shrestha et al. (2013). To remove excess reactants, the aerosol in the outflow from flow tube reactor continued through a diffusion dryer charged with ozone destruction cat-alyst (Ozone Solutions, model ODS-2) and a carbon filter de-nuder (Sunset Laboratory). Particle mass concentrations in the flow tube reactor ranged from 75 to 11 000 µg m−3 (Ta-ble 1).
At the outlet of the flow tube reactor, particles were col-lected using one of two different methods. In the first method, after charging in a bipolar charger (TSI, model 3077), a
portion of the flow (1.5 slpm) was sampled into a Nanome-ter Aerosol Sampler (TSI, model 3089). The particles were collected by electrostatic precipitation (−10 kV sampler po-tential) onto a siliconized glass slide (Hampton Research, Canada). This method of collection resulted in submicron particles distributed evenly over the glass slide (Liu et al., 2013). In the second method, a portion (1.5 slpm) of the aerosol flow exiting the flow reactor was sampled into a single stage impactor (Prenni et al., 2009; Pöschl et al., 2010). The collection substrate was a glass slide coated with trichloro(1H,1H,2H,2H-perfluorooctyl)silane (Sigma-Aldrich, 97 % purity). The coating procedure, which was de-scribed in Knopf (2003), produced a hydrophobic surface. The size of the particles after coagulation on the glass slides ranged from 10 to 80 µm in diameter. Table 1 lists samples collected by method 1 or method 2.
For the optical microscope experiments (see Sect. 2.1.2), supermicron particles are needed, and in the case of method 1 the collected submicron particles were exposed to water su-persaturation (SS) conditions to grow and coagulate the par-ticles (Song et al., 2015). Specifically, the slides containing the submicron particles were mounted to a temperature and RH-controlled flow cell, which was coupled to a reflectance microscope, as described previously (Koop et al., 2000; Par-son et al., 2004; Pant et al., 2006). The RH in the flow cell was initially set to > 100 % by decreasing the cell tempera-ture to below the dew point temperatempera-ture. At the initial RH (> 100 %) water condensed on the slides forming large (150– 300 µm) droplets by growth and coagulation. The RH was then ramped back to ∼98 % by warming the cell back to room temperature, resulting in water evaporating from the droplets. This process of coagulation followed by evapora-tion resulted in SOM particles with lateral dimensions of 5– 30 µm.
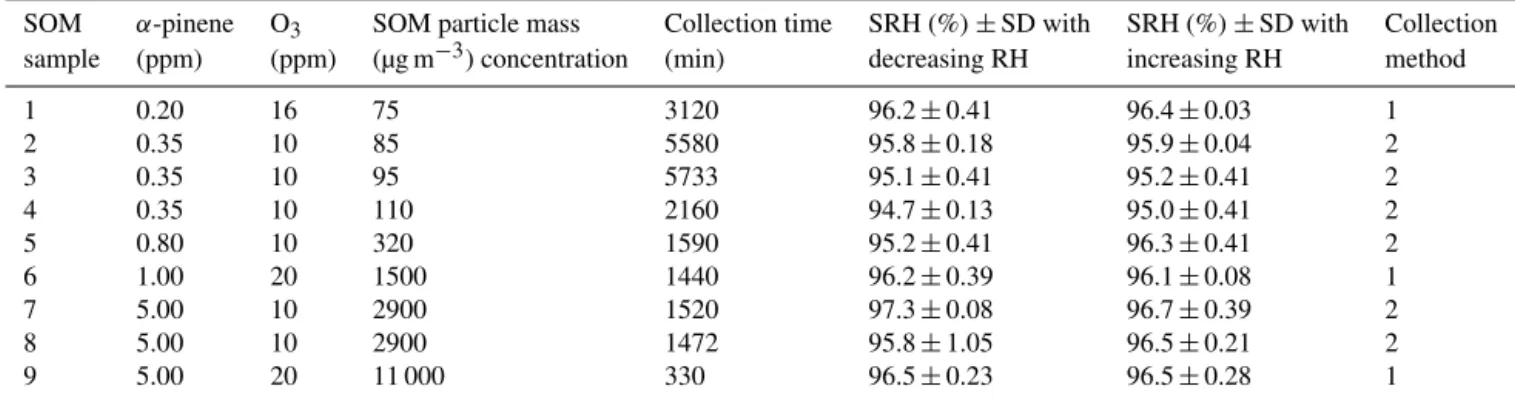
Table 1.Summary of experimental conditions for the production and collection ofα-pinene-derived SOM. SOM samples 2, 3, 4, 5, 7 and 8 were collected on hydrophobic substrates using a single stage impactor. SOM samples 1, 6 and 9 were collected on hydrophobic substrates using an electrostatic precipitator. The separation relative humidity (SRH) from one to two phases is listed for each SOM. The standard deviation (stdev) is derived from several cycles of RH for different deposited particles. In cases for which the SRH was only determined for one humidity cycle (SOM samples 3–5), the error represents the maximum error reported for the other SOM samples. SOM particle mass concentration refers to the concentration of organic particles suspended in the gas phase at the time of SOM production.
SOM α-pinene O3 SOM particle mass Collection time SRH (%)±SD with SRH (%)±SD with Collection sample (ppm) (ppm) (µg m−3) concentration (min) decreasing RH increasing RH method
1 0.20 16 75 3120 96.2±0.41 96.4±0.03 1
2 0.35 10 85 5580 95.8±0.18 95.9±0.04 2
3 0.35 10 95 5733 95.1±0.41 95.2±0.41 2
4 0.35 10 110 2160 94.7±0.13 95.0±0.41 2
5 0.80 10 320 1590 95.2±0.41 96.3±0.41 2
6 1.00 20 1500 1440 96.2±0.39 96.1±0.08 1
7 5.00 10 2900 1520 97.3±0.08 96.7±0.39 2
8 5.00 10 2900 1472 95.8±1.05 96.5±0.21 2
9 5.00 20 11 000 330 96.5±0.23 96.5±0.28 1
2.1.2 Method of determining SOM phase(s)
Hydrophobic substrates containing the supermicron particles were located within a flow cell with temperature and RH control and coupled to a reflectance microscope (Zeiss, Ax-ioTech, 50×objective) for observation (Koop et al., 2000; Parson et al., 2004; Pant et al., 2006). During experiments, the RH was changed by adjusting the moisture content of the gas flow. The RH was measured with a chilled-mirror hygrometer (General Eastern, model 1311DR), which was calibrated using the deliquescence RH of pure ammonium sulfate particles. During typical experiments, the RH was first set to∼100 %, and then the RH was ramped down at a rate of 0.1–0.3 % RH min−1and images were collected
ev-ery 5–20 s. After the RH reached≤0.5 % RH, it was ramped up again at the same rate to ∼100 %. During the exper-iments, temperature was constant at 290±1 K. From im-ages recorded while changing the RH, the number of phases present in the SOM was determined.
During the experiments used to determine SOM phase state the concentration of organic vapors in the flow cell was not controlled. Hence, some of the more volatile material in the SOM may have evaporated during these experiments. However, no visible change in the particle volume occurred during these experiments, suggesting evaporative loss was minimal. The SOM particle mass concentrations used when generating the SOM were similar to those used in Grayson et al. (2016), and the sample preparation methods were iden-tical to those used in Grayson et al. (2016), who showed no visible volume change of the droplets over time periods of greater than 44 h. It is possible that condensed-phase reac-tions may have occurred that lowered the vapor pressure of the SOM.
2.2 Thermodynamic modeling studies
Liquid–liquid equilibria and water uptake were calculated with the methods developed by Zuend et al. (2008, 2010, 2011) and Zuend and Seinfeld (2012, 2013). To calcu-late activity coefficients of the organic species as a func-tion of the solufunc-tion composifunc-tion, the thermodynamic group-contribution model AIOMFAC (Aerosol Inorganic–Organic Mixtures Functional groups Activity Coefficients) developed by Zuend et al. (2008, 2010, 2011) was utilized. To deter-mine whether two liquid phases or a single liquid phase was the thermodynamic stable state, the Gibbs free energies of a two-liquid phase state and a one-liquid phase state were cal-culated (Zuend et al., 2010). If the two-liquid phase state had a lower Gibbs free energy compared to the one liquid phase state, then LLPS was predicted.
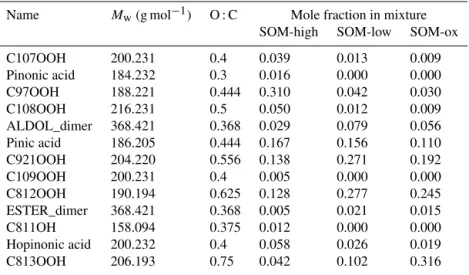
gas-to-Table 2. Molecular weights (Mw), O : C elemental ratios and mole fractions of theα-pinene ozonolysis products from Zuend and
Sein-feld (2012) used in the thermodynamic modeling study. Three different scenarios were investigated: high SOM concentrations (SOM-high), low SOM concentration (SOM-low) and with higher shares of the more oxidized products (SOM-ox).
Name Mw(g mol−1) O : C Mole fraction in mixture SOM-high SOM-low SOM-ox
C107OOH 200.231 0.4 0.039 0.013 0.009 Pinonic acid 184.232 0.3 0.016 0.000 0.000 C97OOH 188.221 0.444 0.310 0.042 0.030 C108OOH 216.231 0.5 0.050 0.012 0.009 ALDOL_dimer 368.421 0.368 0.029 0.079 0.056 Pinic acid 186.205 0.444 0.167 0.156 0.110 C921OOH 204.220 0.556 0.138 0.271 0.192 C109OOH 200.231 0.4 0.005 0.000 0.000 C812OOH 190.194 0.625 0.128 0.277 0.245 ESTER_dimer 368.421 0.368 0.005 0.021 0.015 C811OH 158.094 0.375 0.012 0.000 0.000 Hopinonic acid 200.232 0.4 0.058 0.026 0.019 C813OOH 206.193 0.75 0.042 0.102 0.316
particle partitioning to isolate the effect of LLPS. The aver-age O : C ratios used in the thermodynamic modeling stud-ies are similar to those measured in environmental chambers (e.g., see Chhabra et al. (2011) and references therein).
The oxidation products and mole fractions used in the thermodynamic modeling studies were used to (1) improve our understanding of the phase state of multicomponent or-ganic mixtures such as those generated during SOM forma-tion fromα-pinene ozonolysis and (2) to explore the possible implications of liquid–liquid phase separation in multicom-ponent organic mixtures such as SOM. However, the oxida-tion products and their mole fracoxida-tions were not intended to reproduce the laboratory conditions used here or atmospheric SOM.
In addition to detecting the presence of LLPS, the thermo-dynamic model was used to predict the hygroscopic growth factor (HGF), CCN activation and the hygroscopicity param-eter (κ), from calculations of hygroscopic growth (κHGF) and
calculations of CCN activation (κCCN) (see Table 3). The
hy-groscopic growth factor was calculated with the following Eq. (1):
HGF(RH)=D(RH) D0
, (1)
whereD(RH) andD0represent the wet and the dry
diame-ters of the particles, respectively. The dry diameter D0was
calculated at 0 % RH. The following equation was used to calculate theκHGF(Petters and Kreidenweis, 2007; Pajunoja
et al., 2015): κHGF=1−HGF3+
HGF3−1
RH 100 %
e
4σ M
w
RT ρwD0HGF
, (2)
whereσis surface tension at the particle–air interface,Mwis
the molecular weight of water (18 g mol−1),Ris the
univer-sal gas constant,T is temperature (298 K) andρwis the
den-sity of water (1 g cm−3). The following equation was used to calculateκCCN (Petters and Kreidenweis, 2007; Pajunoja et
al., 2015):
κCCN=
4A3Kelvin 27d3
cln2Sc
, (3)
where AKelvin=
4σ Mw
RT ρw
, (4)
anddcandSc are the critical diameter and saturation ratio,
respectively.
3 Results and discussion
3.1 Observations of LLPS inα-pinene-derived SOM particles: laboratory studies
Table 3.Calculated properties of the mixtures SOM-high, SOM-low and SOM-ox: average O : C elemental ratio, average molecular weight, simulated mass yields at 60% RH reported in Zuend and Seinfeld (2012), range of LLPS for a 20 µm particle in diameter, range of LLPS for a 100 nm particle in diameter, critical supersaturation SSc for a 100 nm particle with a surface tension of 72 mN m−1, critical supersaturation SSc for a 100 nm particle with a surface tension of 40 mN m−1,κHGFfrom the hygroscopic growth curve at 90 % RH for a 100 nm diameter particle and surface tension of 72 mN m−1,κHGFfrom the hygroscopic growth curve at 90 % RH for a 100 nm diameter particle and surface tension of 40 mN m−1,κCCNfrom SSc of the Köhler curve for a 100 nm particle and surface tension of 72 mN m−1,κCCNfrom SSc of the Köhler curve for a 100 nm particle and surface tension of 40 mN m−1.
SOM-high SOM-low SOM-ox
Av. O : C 0.472 0.513 0.582
Av.Mw(g mol−1) 199.5 213.5 210.6 PM mass conc. (µg m−3) 21.86 0.81 –
LLPS range (% RH), 20 µm 99.31–99.88 98.91–99.94 98.71–99.92 LLPS range (% RH), 100 nm > 100 % > 100 % > 100 % SSc (%), 72 mN m−1 1.206 0.668 0.432 SSc (%), 40 mN m−1 0.335 0.177 0.172
κHGFat 90 % RH, 72 mN m−1 0.0228 0.0278 0.0319
κHGFat 90 % RH, 40 mN m−1 0.0228 0.0278 0.0319
κCCN, 72 mN m−1 0.0093 0.0318 0.0758
κCCN, 40 mN m−1 0.0198 0.0750 0.0793
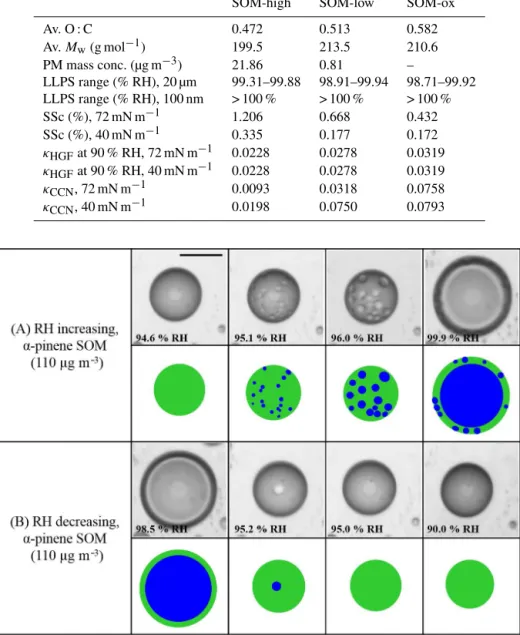
Figure 1.Effect of RH cycles onα-pinene-derived SOM for SOM produced at 110 µg m−3. Illustrations of the images are shown for clarity. Green: SOM-rich phase. Blue: water-rich phase. Size bar is 20 µm.
phase throughout the particle (Ciobanu et al., 2009; Song et al., 2012). After phase separation by spinodal decomposition, the inclusions containing the second phase increased in size and coagulated into larger inclusions and eventually formed the inner phase of the particle as the RH was increased above ∼95 % RH (see movie S1 in the Supplement). After phase separation, two liquid phases persisted until∼100 % RH.
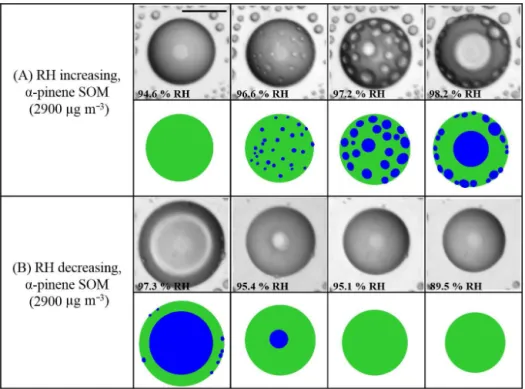
Figure 2.Effect of RH cycles onα-pinene-derived SOM for SOM produced at 2900 µg m−3. Illustrations of the images are shown for clarity. Green: SOM-rich phase. Blue: water-rich phase. Size bar is 20 µm.
no abrupt change was observed, indicating the absence of any further phase transitions. Figure 2 and movies S3–S4 in the Supplement show similar pictures and movies as Fig. 1 and movies S1–S2 in the Supplement, except in this case the SOM was generated using a higher particle mass concentra-tion in the flow tube reactor.
Figures 1–2 and movies S1–S4 in the Supplement show that there are differences in the process of LLPS and the re-sulting morphology depending on the direction of the RH change. For increasing RH, spinodal decomposition was identified as the mechanism of phase separation. For de-creasing RH, disappearance of phase separation occurred by merging of the two phases.
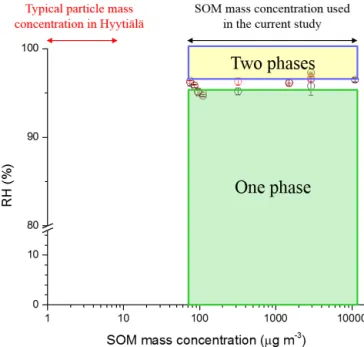
Experiments were also carried out to determine whether the lowest RH at which two phases existed depended on the direction of RH change. Values for the lowest RH at which two phases were observed when increasing and de-creasing RH are listed in Table 1 and shown in Fig. 3 (black circles correspond to increasing RH and red circles corre-spond to decreasing RH). Table 1 and Fig. 3 illustrate that the lowest RH at which two phases were observed did not depend significantly on the direction of RH change. Fig-ure 3 and Table 1 also show that within uncertainties of the measurements, there is no effect of the SOM particle mass concentrations in the flow tube reactor on the lowest RH at which two liquid phases were observed for the range of 75 to 11 000 µg m−3. Also included in Fig. 3 are typical SOM particle mass concentrations measured over a boreal forest (Raatikainen et al., 2010), where α-pinene is an important
contributor to SOM (Cavalli et al., 2006). Since the SOM par-ticle mass concentrations used in our experiments when gen-erating the SOM were higher than typically observed in the atmosphere, additional studies are needed to confirm LLPS with SOM produced using atmospherically relevant particle mass concentrations.
Figure 3. Relative humidity (RH) at which phase transition be-tween one phase and two liquid phases were observed forα -pinene-derived SOM as a function of the mass concentration of SOM produced. Red circles: onset of phase separation upon moistening. Black circles: merging of the two liquid phases upon drying. The
y error bars represent the standard deviation in RH determination at the phase transition. Green shaded region: one phase prevalent in
α-pinene-derived SOM. Yellow shaded region: two phases present. Also shown is the mass concentration observed over a representa-tive boreal forest in Hyytiälä (Raatikainen et al., 2010).
Figure 4.Simulated hygroscopic growth factors HGF=D / D0for SOM-high (green, O : C=0.472), SOM-low (blue, O : C=0.513) and SOM-ox (purple, O : C=0.582). The red segments on the lines indicate the presence of LLPS. Panel(a)corresponds to a dry di-ameter of 20 µm, which is similar in size to the particles used in the optical microscope experiments, and a surface tension of water. Panel(b)corresponds to a dry diameter of 100 nm and a surface tension of water.
3.2 Observations of LLPS inα-pinene-derived SOM particles: thermodynamic modeling studies
Shown in panel a of Fig. 4 are the simulated hygroscopic growth factors for the three different SOM mixtures (SOM-high, SOM-low, SOM-ox) with a dry diameter of 20 µm, which is similar in size to the particles used in the optical
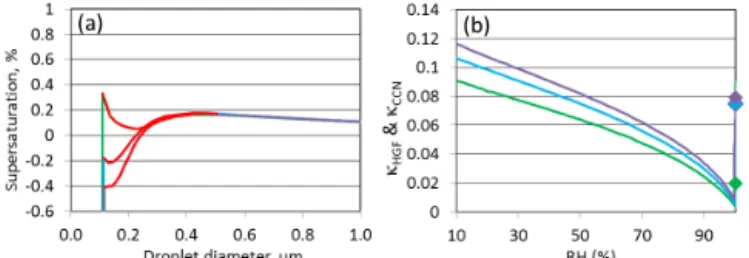
Figure 5.Assuming the surface tension of water, Köhler curves (panel a) and hygroscopicity parameter κ (panel b) for a par-ticle with a dry diameter of 100 nm for SOM-high (green, O : C=0.472), SOM-low (blue, O : C=0.513) and SOM-ox (pur-ple, O : C=0.582). The red segments on the lines in panel(a) indi-cate the presence of LLPS. In panel(b),κHGFis given as solid line as a function of RH andκCCNas diamond at RH=100 %.
microscope experiments, and assuming a surface tension (σ) of water. At RH values < 98 % the SOM took up little water. However, when the multicomponent systems consisting of organic substances with different hydrophilicities (i.e., differ-ent O : C elemdiffer-ental ratios) were exposed to RH values > 98 % RH, LLPS into an organic-rich phase and a water-rich phase was observed. At the RH of LLPS, the particles took up a significant amount of water, leading to an almost vertical in-crease in the hygroscopic growth curve as shown in panel a of Fig. 4. For the SOM-high mixture LLPS occurred from 99.3 to 99.88 % RH as indicated by the red segment on the green line. When the share of the more hydrophilic substances is in-creased, as is the case for the low SOM loading (SOM-low) with a particle mass concentration of 0.81 µg m−3, the on-set of LLPS shifted to lower RH and the RH range of LLPS was increased. In the laboratory experiments, LLPS was ob-served starting at 95 % RH. This lower onset may be due to more highly oxidized products produced in the laboratory compared with the oxidation products used in the thermody-namic calculations. When the range of O : C elemental ratios of the individual products used in the thermodynamic calcu-lations is narrower than what is present in the SOM generated in the experiment, the calculated width of LLPS in terms of RH would be narrower than the measured one.
4 Implications
4.1 Cloud condensation nuclei properties
The presence of a miscibility gap at RH > 95 % has conse-quences for the CCN activity of particles as suggested pre-viously (Petters et al., 2006). Shown in panel a of Fig. 5 are simulated Köhler curves for SOM particles with dry diam-eters of 100 nm and using the surface tension of water. The Köhler curves show a sharp increase in the equilibrium wa-ter vapor SS above the particles as the size of the particles increases from 100 to roughly 110 nm due to the Kelvin ef-fect when they are still in their organic-rich phase (i.e., low water content state). As the particle size increases from 110 to 200 nm there is a steep decrease in SS as the particles switch from the organic-rich phase to two phases by tak-ing up water from the gas phase. This gives rise to the first maximum in the Köhler curve, which occurs at a wet parti-cle diameter ofDp≈110 nm for the SOM-high mixture. The
second maximum of SS at a wet diameter of Dp≈300 nm
is the regular maximum of the Köhler curve, which oc-curs when the droplet is dilute and close to solution ideal-ity. When the particle is composed of higher shares of the more hydrophilic substances, the first maximum decreases in height while the second maximum remains constant (see panel a of Fig. 5). For SOM-high (O : C=0.472) and SOM-low (O : C=0.513), the first maximum in the Köhler curve determines the critical SS to overcome the activation barrier. In SOM-ox (O : C=0.582) the second maximum is higher than the first one and relevant for CCN activation. The height of the second maximum in the Köhler curve is sensitive to the molecular weight of the organic substances making up the particle (e.g., Wex et al., 2007, 2008).
Shown in panel a of Fig. 6 are simulated Köhler curves for SOM particles with dry diameters of 100 nm and using the surface tension of 40 mN m−1, which is consistent with the surface tension of aqueous mixtures of pinonic acid, pinic acid and pinonaldehyde (Tuckermann and Cammenga, 2004; Hartz et al., 2006). Panel a of Fig. 6 illustrates that a lower surface tension has a large effect on the first maximum in the Köhler curve and also lowers the barrier of the second max-imum. During the activation process, the surface tension is expected to increase as the phase state changes from organic rich to water rich, but this process is not modeled here. Ad-ditional studies are needed to fully understand the effect of varying surface tension on the resulting Köhler curves (Ruehl et al., 2016).
The non-ideality of SOM also has consequences for the applicability of the single parameterκrepresentation of Köh-ler theory (Petters and Kreidenweis, 2007). If SOM forms an ideal mixture with water then κHGF is approximately
con-stant over the whole RH range and κCCN corresponds well
withκHGFfor an organic particle (Petters and Kreidenweis,
2007). However, panel b of Figs. 5 and 6 show that κHGF
for the mixtures SOM-high, SOM-low and SOM-ox with a
Figure 6. Assuming a surface tension of 40 mN m−1, Köhler curves (panel a) and hygroscopicity parameter κ (panel b) for a particle with a dry diameter of 100 nm for SOM-high (green, O : C=0.472), SOM-low (blue, O : C=0.513) and SOM-ox (pur-ple, O : C=0.582). The red segments on the lines in panel(a) indi-cate the presence of LLPS. In panel(b),κHGFis given as solid line as a function of RH andκCCNas diamond at RH=100 %.
dry diameter of 100 nm are not constant over the whole RH range. Due to the solution non-ideality,κHGFdecreases as the
RH increases. In addition,κCCNstrongly depends on whether
the first or the second maximum in the Köhler curve is limit-ing CCN activation.
Recently researchers have observed inconsistencies be-tween measured CCN properties of SOM particles and hy-groscopic growth measured below water saturation. In other words, hygroscopic parameters measured below water satu-ration were inconsistent with hygroscopic parameters mea-sured above water saturation. Several reasons have been put forward to explain these discrepancies (Petters et al., 2006, 2009; Prenni et al., 2007; Juranyi et al., 2009; Good et al., 2010; Massoli et al., 2010; Hersey et al., 2013; Pajunoja et al., 2015). The results shown in panel b of Figs. 5–6 illustrate that such inconsistencies are expected for systems with LLPS when the water uptake at subsaturated conditions represents the hygroscopicity of the organic-rich phase while the barrier for CCN activation is determined by the second maximum in the Köhler curve when the particles are water rich. Ad-ditional laboratory studies are needed to determine whether LLPS occurs inα-pinene SOM generated with particle mass concentrations typically found in the atmosphere. Additional studies are also needed to determine if LLPS occurs in other types of SOM particles of atmospheric relevance.
The Supplement related to this article is available online at doi:10.5194/acp-16-7969-2016-supplement.
calculations. The authors would also like to thank Doug Worsnop for enthusiastic and motivating discussions related to the current manuscript.
Edited by: A. Virtanen
References
Bertram, A. K., Martin, S. T., Hanna, S. J., Smith, M. L., Bodsworth, A., Chen, Q., Kuwata, M., Liu, A., You, Y., and Zorn, S. R.: Predicting the relative humidities of liquid-liquid phase separation, efflorescence, and deliquescence of mixed par-ticles of ammonium sulfate, organic material, and water using the organic-to-sulfate mass ratio of the particle and the oxygen-to-carbon elemental ratio of the organic component, Atmos. Chem. Phys., 11, 10995–11006, doi:10.5194/acp-11-10995-2011, 2011. Bilde, M. and Svenningsson, B.: CCN activation of slightly solu-ble organics: the importance of small amounts of inorganic salt and particle phase, Tellus B, 56, 128–134, doi:10.1111/j.1600-0889.2004.00090.x, 2004.
Cavalli, F., Facchini, M. C., Decesari, S., Emblico, L., Mircea, M., Jensen, N. R., and Fuzzi, S.: Size-segregated aerosol chem-ical composition at a boreal site in southern Finland, dur-ing the QUEST project, Atmos. Chem. Phys., 6, 993–1002, doi:10.5194/acp-6-993-2006, 2006.
Chhabra, P. S., Ng, N. L., Canagaratna, M. R., Corrigan, A. L., Rus-sell, L. M., Worsnop, D. R., Flagan, R. C., and Seinfeld, J. H.: El-emental composition and oxidation of chamber organic aerosol, Atmos. Chem. Phys., 11, 8827–8845, doi:10.5194/acp-11-8827-2011, 2011.
Ciobanu, V. G., Marcolli, C., Krieger, U. K., Weers, U., and Peter, T.: Liquid-liquid phase separation in Mixed Organic/Inorganic Aerosol Particles, J. Phys. Chem. A, 113, 10966–10978, doi:10.1021/Jp905054d, 2009.
Compernolle, S., Ceulemans, K., and Müller, J.-F.: EVAPORA-TION: a new vapour pressure estimation methodfor organic molecules including non-additivity and intramolecular interac-tions, Atmos. Chem. Phys., 11, 9431–9450, doi:10.5194/acp-11-9431-2011, 2011.
Ganbavale, G., Zuend, A., Marcolli, C., and Peter, T.: Improved AIOMFAC model parameterisation of the temperature depen-dence of activity coefficients for aqueous organic mixtures, At-mos. Chem. Phys., 15, 447–493, doi:10.5194/acp-15-447-2015, 2015.
Good, N., Topping, D. O., Duplissy, J., Gysel, M., Meyer, N. K., Metzger, A., Turner, S. F., Baltensperger, U., Ristovski, Z., Weingartner, E., Coe, H., and McFiggans, G.: Widening the gap between measurement and modelling of secondary or-ganic aerosol properties?, Atmos. Chem. Phys., 10, 2577–2593, doi:10.5194/acp-10-2577-2010, 2010.
Grayson, J. W., Zhang, Y., Mutzel, A., Renbaum-Wolff, L., Böge, O., Kamal, S., Herrmann, H., Martin, S. T., and Bertram, A. K.: Effect of varying experimental conditions on the viscosity ofα -pinene derived secondary organic material, Atmos. Chem. Phys., 16, 6027–6040, doi:10.5194/acp-16-6027-2016, 2016.
Hallquist, M., Wenger, J. C., Baltensperger, U., Rudich, Y., Simp-son, D., Claeys, M., Dommen, J., Donahue, N. M., George, C., Goldstein, A. H., Hamilton, J. F., Herrmann, H., Hoffmann, T.,
Iinuma, Y., Jang, M., Jenkin, M. E., Jimenez, J. L., Kiendler-Scharr, A., Maenhaut, W., McFiggans, G., Mentel, T. F., Monod, A., Prevot, A. S. H., Seinfeld, J. H., Surratt, J. D., Szmigielski, R., and Wildt, J.: The formation, properties and impact of secondary organic aerosol: current and emerging issues, Atmos. Chem. Phys., 9, 5155-5236, doi:10.5194/acp-9-5155-2009, 2009. Hartz, K. E. H., Tischuk, J. E., Chan, M. N., Chan, C. K., Donahue,
N. M., and Pandis, S. N.: Cloud condensation nuclei activation of limited solubility organic aerosol, Atmos. Environ., 40, 605–617, doi:10.1016/j.atmosenv.2005.09.076, 2006.
Hersey, S. P., Craven, J. S., Metcalf, A. R., Lin, J., Lathem, T., Suski, K. J., Cahill, J. F., Duong, H. T., Sorooshian, A., Jonsson, H. H., Shiraiwa, M., Zuend, A., Nenes, A., Prather, K. A., Flagan, R. C., and Seinfeld, J. H.: Composition and hygroscopicity of the Los Angeles Aerosol: CalNex, J. Geophys. Res.-Atmos., 118, 3016– 3036, doi:10.1002/jgrd.50307, 2013.
Jenkin, M. E., Saunders, S. M., and Pilling, M. J.: The tropo-spheric degradation of volatile organic compounds: A proto-col for mechanism development, Atmos. Environ., 31, 81–104, doi:10.1016/S1352-2310(96)00105-7, 1997.
Jimenez, J. L., Canagaratna, M. R., Donahue, N. M., Prevot, A. S. H., Zhang, Q., Kroll, J. H., DeCarlo, P. F., Allan, J. D., Coe, H., Ng, N. L., Aiken, A. C., Docherty, K. S., Ulbrich, I. M., Grieshop, A. P., Robinson, A. L., Duplissy, J., Smith, J. D., Wilson, K. R., Lanz, V. A., Hueglin, C., Sun, Y. L., Tian, J., Laaksonen, A., Raatikainen, T., Rautiainen, J., Vaattovaara, P., Ehn, M., Kulmala, M., Tomlinson, J. M., Collins, D. R., Cubi-son, M. J., Dunlea, E. J., Huffman, J. A., Onasch, T. B., Al-farra, M. R., Williams, P. I., Bower, K., Kondo, Y., Schnei-der, J., Drewnick, F., Borrmann, S., Weimer, S., Demerjian, K., Salcedo, D., Cottrell, L., Griffin, R., Takami, A., Miyoshi, T., Hatakeyama, S., Shimono, A., Sun, J. Y., Zhang, Y. M., Dzepina, K., Kimmel, J. R., Sueper, D., Jayne, J. T., Herndon, S. C., Trim-born, A. M., Williams, L. R., Wood, E. C., Middlebrook, A. M., Kolb, C. E., Baltensperger, U., and Worsnop, D. R.: Evolution of organic aerosols in the atmosphere, Science, 326, 1525–1529, doi:10.1126/science.1180353, 2009.
Juranyi, Z., Gysel, M., Duplissy, J., Weingartner, E., Tritscher, T., Dommen, J., Henning, S., Ziese, M., Kiselev, A., Stratmann, F., George, I., and Baltensperger, U.: Influence of gas-to-particle partitioning on the hygroscopic and droplet activation behaviour of alpha-pinene secondary organic aerosol, Phys. Chem. Chem. Phys., 11, 8091–8097, doi:10.1039/B904162a, 2009.
Knopf, D. A.: Thermodynamic properties and nucleation processes of upper tropospheric and lower stratospheric aerosol particles, Diss. ETH No. 15103, Zurich, Switzerland, 2003.
Koop, T., Kapilashrami, A., Molina, L. T., and Molina, M. J.: Phase transitions of sea-salt/water mixtures at low tempera-tures: Implications for ozone chemistry in the polar marine boundary layer, J. Geophys. Res.-Atmos., 105, 26393–26402, doi:10.1029/2000jd900413, 2000.
Krieger, U. K., Marcolli, C., and Reid, J. P.: Exploring the complexity of aerosol particle properties and processes using single particle techniques, Chem. Soc. Rev., 41, 6631–6662, doi:10.1039/c2cs35082c, 2012.
Liu, P. F., Zhang, Y., and Martin, S. T.: Complex refractive indices of thin films of secondary organic materials by spectroscopic ellipsometry from 220 to 1200 nm, Environ. Sci. Technol., 47, 13594–13601, doi:10.1021/Es403411e, 2013.
Martin, S. T.: Phase transitions of aqueous atmospheric particles, Chem. Rev., 100, 3403–3453, doi:10.1021/Cr990034t, 2000. Massoli, P., Lambe, A. T., Ahern, A. T., Williams, L. R., Ehn, M.,
Mikkila, J., Canagaratna, M. R., Brune, W. H., Onasch, T. B., Jayne, J. T., Petaja, T., Kulmala, M., Laaksonen, A., Kolb, C. E., Davidovits, P., and Worsnop, D. R.: Relationship between aerosol oxidation level and hygroscopic properties of laboratory generated secondary organic aerosol (SOM) particles, Geophys. Res. Lett., 37, L24801, doi:10.1029/2010gl045258, 2010. Pajunoja, A., Lambe, A. T., Hakala, J., Rastak, N., Cummings, M.
J., Brogan, J. F., Hao, L. Q., Paramonov, M., Hong, J., Prisle, N. L., Malila, J., Romakkaniemi, S., Lehtinen, K. E. J., Laak-sonen, A., Kulmala, M., Massoli, P., Onasch, T. B., Donahue, N. M., Riipinen, I., Davidovits, P., Worsnop, D. R., Petaja, T., and Virtanen, A.: Adsorptive uptake of water by semisolid sec-ondary organic aerosols, Geophys. Res. Lett., 42, 3063–3068, doi:10.1002/2015gl063142, 2015.
Pankow, J. F.: Gas/particle partitioning of neutral and ionizing compounds to single and multi-phase aerosol particles. 1. Uni-fied modeling framework, Atmos. Environ., 37, 3323–3333, doi:10.1016/S1352-2310(03)00346-7, 2003.
Pant, A., Parsons, M. T., and Bertram, A. K.: Crystalliza-tion of aqueous ammonium sulfate particles internally mixed with soot and kaolinite: Crystallization relative humidities and nucleation rates, J. Phys. Chem. A, 110, 8701–8709, doi:10.1021/Jp060985s, 2006.
Parsons, M. T., Knopf, D. A., and Bertram, A. K.: Deliques-cence and crystallization of ammonium sulfate particles inter-nally mixed with water-soluble organic compounds, J. Phys. Chem. A, 108, 11600–11608, doi:10.1021/Jp0462862, 2004. Petters, M. D. and Kreidenweis, S. M.: A single parameter
repre-sentation of hygroscopic growth and cloud condensation nucleus activity, Atmos. Chem. Phys., 7, 1961–1971, doi:10.5194/acp-7-1961-2007, 2007.
Petters, M. D., Kreidenweis, S. M., Snider, J. R., Koehler, K. A., Wang, Q., Prenni, A. J., and Demott, P. J.: Cloud droplet acti-vation of polymerized organic aerosol, Tellus B, 58, 196–205, doi:10.1111/j.1600-0889.2006.00181.x, 2006.
Petters, M. D., Wex, H., Carrico, C. M., Hallbauer, E., Massling, A., McMeeking, G. R., Poulain, L., Wu, Z., Kreidenweis, S. M., and Stratmann, F.: Towards closing the gap between hygro-scopic growth and activation for secondary organic aerosol – Part 2: Theoretical approaches, Atmos. Chem. Phys., 9, 3999–4009, doi:10.5194/acp-9-3999-2009, 2009.
Pöschl, U., Martin, S. T., Sinha, B., Chen, Q., Gunthe, S. S., Huffman, J. A., Borrmann, S., Farmer, D. K., Garland, R. M., Helas, G., Jimenez, J. L., King, S. M., Manzi, A., Mikhailov, E., Pauliquevis, T., Petters, M. D., Prenni, A. J., Roldin, P., Rose, D., Schneider, J., Su, H., Zorn, S. R., Artaxo, P., and An-dreae, M. O.: Rainforest aerosols as biogenic nuclei of clouds and precipitation in the Amazon, Science, 329, 1513–1516, doi:10.1126/science.1191056, 2010.
Prenni, A. J., Petters, M. D., Kreidenweis, S. M., DeMott, P. J., and Ziemann, P. J.: Cloud droplet activation of
sec-ondary organic aerosol, J. Geophys. Res.-Atmos., 112, D10223, doi:10.1029/2006jd007963, 2007.
Prenni, A. J., Petters, M. D., Kreidenweis, S. M., Heald, C. L., Martin, S. T., Artaxo, P., Garland, R. M., Wollny, A. G., and Poschl, U.: Relative roles of biogenic emissions and Saharan dust as ice nuclei in the Amazon basin, Nat. Geosci., 2, 401–404, doi:10.1038/Ngeo517, 2009.
Raatikainen, T., Vaattovaara, P., Tiitta, P., Miettinen, P., Rautiainen, J., Ehn, M., Kulmala, M., Laaksonen, A., and Worsnop, D. R.: Physicochemical properties and origin of organic groups de-tected in boreal forest using an aerosol mass spectrometer, At-mos. Chem. Phys., 10, 2063–2077, doi:10.5194/acp-10-2063-2010, 2010.
Raymond, T. M. and Pandis, S. N.: Cloud activation of single-component organic aerosol particles, J. Geophys. Res.-Atmos., 107, 4787, doi:10.1029/2002jd002159, 2002.
Ruehl, C. R., Davies, J. F., and Wilson, K. R.: An interfacial mech-anism for cloud droplet formation on organic aerosols, Science, 351, 1447–1450, doi:10.1126/science.aad4889, 2016.
Saunders, S. M., Jenkin, M. E., Derwent, R. G., and Pilling, M. J.: Protocol for the development of the Master Chemical Mech-anism, MCM v3 (Part A): tropospheric degradation of non-aromatic volatile organic compounds, Atmos. Chem. Phys., 3, 161–180, doi:10.5194/acp-3-161-2003, 2003.
Senol, A.: Phase equilibria for ternary liquid systems of (water plus carboxylic acid or alcohol plus 1-hexanol) atT=293.15 K: modelling considerations, J. Chem. Thermodyn., 36, 1007–1014, doi:10.1016/j.jct.2004.07.016, 2004.
Shrestha, M., Zhang, Y., Ebben, C. J., Martin, S. T., and Geiger, F. M.: Vibrational sum frequency generation spectroscopy of secondary organic material produced by condensational growth from alpha-pinene ozonolysis, J. Phys. Chem. A, 117, 8427– 8436, doi:10.1021/Jp405065d, 2013.
Song, M., Marcolli, C., Krieger, U. K., Zuend, A., and Peter, T.: Liquid-liquid phase separation and morphology of internally mixed dicarboxylic acids/ammonium sulfate/water particles, At-mos. Chem. Phys., 12, 2691–2712, doi:10.5194/acp-12-2691-2012, 2012.
Song, M., Liu, P. F., Hanna, S. J., Li, Y. J., Martin, S. T., and Bertram, A. K.: Relative humidity-dependent viscosities of isoprene-derived secondary organic material and atmospheric implications for isoprene-dominant forests, Atmos. Chem. Phys., 15, 5145–5159, doi:10.5194/acp-15-5145-2015, 2015.
Stoicescu, C., Iulian, O., and Isopescu, R.: Liquid-Liquid phase equilibria of (1-propanol+water+n-alcohol) ternary systems at 294.15 K. II. 1-propanol+water+1-heptanol or 1-octanol or 1-nonanol or 1-decanol, Rev. Roum. Chim., 56, 553–560, 2011. Tiryaki, A., Guruz, G., and Orbey, H.: Liquid-Liquid Equilibria of
Ternary-Systems of Water Plus Acetone and 5-Alcohol and C-8-Alcohol at 298-K, 303-K and 308-K, Fluid. Phase. Equilibr., 94, 267–280, doi:10.1016/0378-3812(94)87061-6, 1994. Tuckermann, R. and Cammenga, H. K.: The surface
ten-sion of aqueous solutions of some atmospheric water-soluble organic compounds, Atmos Environ, 38, 6135-6138, doi:10.1016/j.atmosenv.2004.08.005, 2004.
an atmospheric HULIS sample, Geophys. Res. Lett., 34, L02818, doi:10.1029/2006GL028260, 2007.
Wex, H., Topping, D., McFiggans, G., and Stratmann, F.: The Kelvin versus the Raoult term in the Köhler equation, J. Atmos. Sci., 65, 4004–4016, doi:10.1175/2008JAS2720.1, 2008. You, Y., Smith, M. L., Song, M. J., Martin, S. T., and Bertram, A. K.:
Liquid-liquid phase separation in atmospherically relevant parti-cles consisting of organic species and inorganic salts, Int. Rev. Phys. Chem., 33, 43–77, doi:10.1080/0144235X.2014.890786, 2014.
Zhang, Q., Jimenez, J. L., Canagaratna, M. R., Allan, J. D., Coe, H., Ulbrich, I., Alfarra, M. R., Takami, A., Middlebrook, A. M., Sun, Y. L., Dzepina, K., Dunlea, E., Docherty, K., De-Carlo, P. F., Salcedo, D., Onasch, T., Jayne, J. T., Miyoshi, T., Shimono, A., Hatakeyama, S., Takegawa, N., Kondo, Y., Schneider, J., Drewnick, F., Borrmann, S., Weimer, S., Demer-jian, K., Williams, P., Bower, K., Bahreini, R., Cottrell, L., Griffin, R. J., Rautiainen, J., Sun, J. Y., Zhang, Y. M., and Worsnop, D. R.: Ubiquity and dominance of oxygenated species in organic aerosols in anthropogenically-influenced Northern Hemisphere midlatitudes, Geophys. Res. Lett., 34, L13801, doi:10.1029/2007gl029979, 2007.
Zuend, A. and Seinfeld, J. H.: Modeling the gas-particle parti-tioning of secondary organic aerosol: the importance of liquid-liquid phase separation, Atmos. Chem. Phys., 12, 3857–3882, doi:10.5194/acp-12-3857-2012, 2012.
Zuend, A. and Seinfeld, J. H.: A practical method for the calcu-lation of liquid–liquid equilibria in multicomponent organic– water–electrolyte systems using physicochemical constraints, Fluid Phase Equilibr., 337, 201–213, 2013.
Zuend, A., Marcolli, C., Luo, B. P., and Peter, T.: A thermodynamic model of mixed organic-inorganic aerosols to predict activity co-efficients, Atmos. Chem. Phys., 8, 4559–4593, doi:10.5194/acp-8-4559-2008, 2008.
Zuend, A., Marcolli, C., Peter, T., and Seinfeld, J. H.: Computa-tion of liquid-liquid equilibria and phase stabilities: implicaComputa-tions for RH-dependent gas/particle partitioning of organic-inorganic aerosols, Atmos. Chem. Phys., 10, 7795–7820, doi:10.5194/acp-10-7795-2010, 2010.