Factors affecting the adoption of supply chain
management practices: Evidence from the Brazilian
electro-electronic sector
Ana Beatriz Lopes de Sousa Jabbour
a,*
, Alceu Gomes Alves Filho
b,
Adriana Backx Noronha Viana
c, Charbel Jos
e Chiappetta Jabbour
aaUNESP/FEB
eS~ao Paulo State University, Faculty of Engineering at Bauru, Av. Eng. Luiz Edmundo C. Coube 14-01, Bauru,
S~ao Paulo, CEP 17033-360, Brazil bUFSCar
eFederal University of Sao Carlos, Campus S~ao Carlos, Rodovia Washington Luıs (SP-310), KM 235, S~ao Carlos,
S~ao Paulo, CEP 13565-905, Brazil cUSP/FEA
eUniversity of S~ao Paulo, Avenida Bandeirantes, 3900, Monte Alegre. Ribeir~ao Preto,
S~ao Paulo, CEP 14040-900, Brazil Available online 1 October 2011
KEYWORDS Supply chain
management practices; Competitive priorities; Contextual factors; Electro-electronic sector;
Brazil
Abstract This study on the factors affecting the adoption of supply chain management (SCM) practices develops four hypotheses based on a literature review, and tests them using survey data of Brazilian electro-electronic firms. The results reveal the big picture of the SCM practices in the sector and suggest that contextual factors such as size, position and bargaining power affect the adoption of SCM practices, which are also more customer oriented. Sector character-istics are very important in analysing SCM practices. Contrary to the findings of literature, the relationship between competitive priorities and SCM practices was not supported statistically.
ª2011 Indian Institute of Management Bangalore. All rights reserved.
Introduction
Supply chain management (SCM) represents a new form of managing business and relationships with other members of the supply chain (SC) (Lambert, Cooper, & Pagh, 1998; Lambert & Cooper, 2000; Lummus & Vokurka, 1999). However there is little consensus regarding its definition and understanding (Mentzer et al., 2001; Burgess et al., 2006; Stock & Boyer 2009; Stock, Boyer, & Harmon, 2010). Li, Rao, Ragu-Nathan, and Ragu-Nathan (2005)andLi, Ragu-Nathan, Ragu-Ragu-Nathan, and Rao (2006)define SCM practices as a set of activities carried out to promote efficient management of its SC.
The studies in SCM practices can be categorised into the following general themes: (a) identification of activities or actions related to SCM at manufacturing companies in different countries (Basnet, Corner, Wisner, & Tan, 2003;
* Corresponding author.
E-mail addresses:[email protected](A.B. Lopes de
Sousa Jabbour),[email protected](A.G. Alves Filho),backx@
usp.br(A.B. Noronha Viana), [email protected](C.J. Chiappetta Jabbour).
0970-3896ª 2011 Indian Institute of Management Bangalore. All
rights reserved. Peer-review under responsibility of Indian Institute of Management Bangalore.
doi:10.1016/j.iimb.2011.09.001
a v a i l a b l e a tw w w . s c i e n c e d i r e c t . c o m
Olhager & Selldin, 2004; Halley & Beaulieu, 2010); (b) categorisation and validation of constructs for SCM prac-tices (Tan, Lyman, & Wisner, 2002; Li et al., 2005); (c) verification that the adoption of SCM practices affect company performance (Tan et al., 2002; Li et al., 2006; Zhou & Benton, 2007; Koh, Demirbag, Bayraktar, Tatoglu, & Zaim, 2007; Chow et al., 2008; Robb, Xie, & Arthanari, 2008; Hsu, Tan, Kannan, & Leong, 2009) and (d) verifica-tion that the characteristics of the industrial sector can affect the adoption of SCM practices (Jharkharia & Shankar, 2006).
Some of the major findings related to factors influencing the adoption of SCM practices are: the role of contextual factors such as the company’s position in the chain, its field of operation (economic sector) and size (Li et al., 2005, 2006; Halley & Beaulieu, 2010); the industrial sector (Jharkharia & Shankar, 2006); and the relationship between SCM practices and elements of the operational capacity portfolio (Hsu et al., 2009), such as competitive priorities (Zhao & Lee, 2009). According to Zhao and Lee (2009), competitive priorities (CP) are an important factor influ-encing the adoption of SCM. They define CP of production (cost, quality, flexibility and delivery) as operational capabilities, which are the competence of the production function to achieve company strategy.
Studies related to CP in the manufacturing and auto-motive sector find a significant relationship between suppliers and manufacturers competitive priorities and practices (Salles, Vieira, Vaz, & Vanalle, 2010; Vachon, Halley, & Beaulieu, 2009). Competitive priorities (CP) choices (Maia, Cerra, & Alves Filho, 2005) and the com-pany’s focal strategy (Demeter, Gelei, & Jenei, 2006) are related to its SC configuration and practices.
The objectives of this paper are to identify the SCM practices being adopted in Brazil’s electro-electronic companies and the factors that affect their adoption. A survey of electro-electronic companies was conducted in Brazil to achieve the proposed objectives.
Brazil’s electro-electronic sector was chosen as the object of study due to several reasons. It is important to the country’s economy, contributing 4% of the GDP (Abinee, 2009). Its import dependence, lack of internal compe-tences for new projects and products and linkages with other industries and sectors of the economy were features affecting its choice of study.
The next section presents a discussion of the relevant literature on SCM practices, factors affecting SCM prac-tices, and characteristics of the Brazilian electro-electronic sector; the methodology adopted to conduct the survey in the third section; the major results of this research are presented in the fourth section; the discussion of these results in the fifth section; and the conclusions and limi-tations of this study in the last section.
Literature review
Supply chain management practices
Li et al. (2005, 2006) define SCM practices as a set of activities conducted by organisations to promote an effi-cient management of their supply chain. According toPires
(2004), SCM practices are related to initiatives for changing the management of business processes in the supply chain. And,Vaart and Donk (2008)state that supply chain prac-tices are considered tangible activities or technologies that play an important role in focal company collaboration with its suppliers and customers.
There are several studies on SCM practices:Tan et al. (2002) categorised six constructs of SCM practices and established their correlations with company performance. However, evidence on the relationship between SCM adoption and performance is mixed. The influence of contextual factors (size, position, extension of the chain) in adopting SCM practices are emphasised by Li et al. (2005, 2006); Halley and Beaulieu, 2010 additionally emphasise the company’s position on the SC and the field of operation. The influence of the industry specific factors have been emphasised by Jharkharia and Shankar (2006) who studied four different types of industry (auto, engi-neering, fast moving consumer goods, process) in India. The inter-relation between SCM practices, operational capabilities and performance have been emphasised by Hsu et al. (2009)and Robb et al. (2008). Country studies also reveal the impact of SCM adoption on performance (Olhager & Selldin, 2004; Zhou & Bento, 2007; Koh et al., 2007; Chow et al., 2008; Robb et al., 2008; Halley & Beaulieu, 2010). However,Basnet et al. (2003) identified the status of SCM practices at manufacturing companies in New Zealand and verified that the adoption is not well disseminated.
Table 1 systematically represents the classification of SCM practices with each classification emphasising a conceptual perspective.
The next section presents a brief discussion regarding factors that affect SCM practices.
Factors that affect supply chain management practices
In identifying the factors that affect SCM practices, the literature emphasises contextual factors such as size of the company, position in the supply chain, field of operation; the industrial sector; and operational capacities or competitive priorities (CP) particularly related to production.
Several studies (Li et al., 2005, 2006; Halley & Beaulieu, 2010) have drawn attention to the effect of contextual factorssuch as size, position and field of operation on the adoption of SCM practices.
Some research has already studied the relationship between thecompany sizeand SCM. The lack of comfort-able fit between small and medium size enterprises (SME) and SCM practices has been affirmed by several studies (Quayle, 2003; Arend & Wisner, 2005; Vaaland & Heide, 2007), unless they are adopted in conjunction with large customers (Quayle, 2003) or key partners (Arend & Wisner, 2005). Thakkar, Kanda, & Deshmukh (2008) also verified differences between large and small and medium enter-prises in terms of key SCM practices.
perception. Relationship with customers and quality of information exchanged are affected depending upon the location of the company on the SC and its proximity to the consumer.
Some studies have revealed the industrial sector as an important factor in the adoption of SCM practices.Wong, Arlbjorn, and Fohansen (2005), who conducted case studies with toy manufacturers in European countries, a sector marked by seasonality and unpredictability, ascertained the importance of mixing SCM strategies and initiatives to meet customers’ demands. Jharkharia and Shankar (2006) studied four different Indian companies and ascertained that the industry’s SC characteristics, such as leadership in operations management practices, bar-gaining power of the chain and configuration of the chain (number of small size suppliers and large size auto manu-facturers) can affect the adoption of SCM practices.
Studies over the past forty years or more have high-lighted the importance of competitive priorities (CP) in organisational and production strategy, structural deci-sions, operational capacities and the adoption of SC practices.
In a 1969 study,Skinner (1969)highlighted that the CPs are related to competitive performance criteria which the production function can adopt in keeping with the organi-sation’s business strategy. In general, these are: quality, costs, flexibility and delivery (Hayes & Wheelwright, 1984). The CPs represent one of the aspects of manufacturing strategy content (according toFine and Hax (1985), which includes a well-coordinated set of objectives and action programmes, aimed at ensuring a competitive advantage over its competitors, in the long term), along with structural and infrastructural decision areas (Leong, Snyder, & Ward, 1990). According to Hayes and Wheelwright (1984), struc-tural decisions refer to long term investments and physical installations, which are irreversible. Infrastructural deci-sions describe the systems, policies and practices that determine how structural aspects of organisations are managed. According toVoss (1995), the content of produc-tion strategy has a logical hierarchy of decisions. CP defini-tions act as guidelines for structural decisions and these guide the infrastructural decisions. Thus, there is an impor-tant dependence on CP format, because that determines the best way to specify and mix structural and infrastructural
Table 1 Systematisation of the major SCM practices.
Categories Associated practices Authors
Supply chain integration Promote the integration of activities in the SC. Tan (2002), Tan et al. (2002), Basnet et al. (2003), Hsu et al. (2009) Reduce response time in the SC. Tan (2002), Tan et al. (2002),
Chow et al. (2008), Hsu et al. (2009) Establish more frequent
contacts with SC members.
Tan (2002), Tan et al. (2002), Basnet et al. (2003)
Involve SC in plans of products/
services/marketing
Tan (2002), Tan et al. (2002), Olhager and Selldin (2004), Basnet et al. (2003) Develop collaboration of SC members with stock
demand/planning and production planning
Olhager and Selldin (2004)
Organise an SCM team that includes
members of other companies.
Basnet et al. (2003), Chow et al. (2008)
Information sharing Use of informal information sharing. Tan (2002), Tan et al. (2002),
Basnet et al. (2003), Chow et al. (2008) Use of formal information sharing. Tan (2002), Tan et al. (2002),
Basnet et al. (2003), Hsu et al. (2009) Critical and transactional information
sharing with other SC members.
Li et al. (2005)
Participation in the marketing
effort by customers
Tan (2002), Basnet et al. (2003)
Determine the customers’ future needs. Tan (2002), Tan et al. (2002),
Basnet et al. (2003), Chow et al. (2008)
Share future strategies with suppliers. Tan et al. (2002), Basnet et al. (2003), Chow et al. (2008), Hsu et al. (2009)
Customer service management
Get final customer feedback. Tan (2002), Tan et al. (2002), Basnet et al. (2003), Li et al. (2005)
Customer relationship Customers take part in the
decision of new products
Robb et al. (2008)
Customers take part
in the production program.
Robb et al. (2008), Pires (2004)
Supplier relationship Suppliers take part in the
decision on the production program
Robb et al. (2008)
Suppliers are asked about new products Robb et al. (2008)
Postponement Assemble the final product as near
the final customer as possible
production resources. (Other studies highlight the impor-tance of the relationship between SCM practices and oper-ational capacities (Hsu et al., 2009) particularly competitive priorities (CP) of production (Zhao & Lee, 2009)).
Thus, through the manufacturing strategy theory, one first identifies that the CPs affect the infrastructural deci-sion of ‘vertical integration’ (Rudberg & Olhager, 2003) and that it is related to the reconfiguration of the SC structure. In other words, the type of CP the company focuses on directs actions of greater or lesser relationship and coordination with suppliers and customers. Second, from the analysis of empirical studies conducted in Brazil and Spain (case studies in the automotive sector), and Canada (survey with manufacturing companies) (Maia et al., 2005; Salles et al., 2010; Vachon et al., 2009) it was ascertained that the CPs impact how the SC is structured and managed. And third, Demeter et al. (2006) verified that the company’s focal strategy is strongly related to SC configuration and the use of SCM practices. Thus, CPs can be considered to be related to the adoption of SCM practices.
From the discussion so far, we can see that the Brazilian electro-electronic sector has not been the subject of much prior study. Further, its importance to the country’s economy and its interface with other industries and sectors (production of capital goods, production of consumer goods, energy, etc.) deem it worthy of study. The results of this study could also subsidise an understanding of other economic sectors. The next section introduces character-istics of the Brazilian electro-electronic sector.
The Brazilian electro-electronic sector
The companies studied operate in the Brazilian electro-electronic sector and are affiliated to the Brazilian Elec-trical and Electronics Industry Association (ABINEE). This sector includes operations in different areas such as industrial automation, electronic trade, production of electric and electronic components, industrial equipment, generation, transmission, and distribution equipment, informatics and telecommunications.
This sector now accounts for 4% of the gross domestic product (GDP). It is divided into final goods generation and infrastructure goods. With the opening of Brazil’s market in the 1990s and the increase in the imports of electronic components (Nassif, 2002), this industry competes inter-nally with products from developing countries and it is also affected by the exchange rate issues and public policies (investments in public constructions). However, Brazilian electro-electronic products are also exported (Kronmeyer Filho, Fachinello, & Kliemann Neto, 2004) with the components being pre-engineered.
With regard to multinational subsidiary companies, Gavira (2008)opined that, in general, multinational prod-ucts and services should be adapted, customised, and nationalised for the local market. This was supported by Tan and Hwang’s (2002) study of the electro-electronic industry of Taiwan.
Hauser, Zen, Selao, and Garcia (2007) describing the dynamics of the telecommunication, informatics, and component segments in Brazil point out that the basic
productive process is limited to assembling these items using a set of imported components. The Brazilian electro-electronic industries reliance on imported components and its almost negligible indigenous component manufacturing capability impacts the competitiveness of the industry negatively, driving up costs and making innovation difficult. Mcivor and Humphreys (2004) highlight that the electro-electronic assembling companies restructure their products frequently aiming at reducing costs and improving function-ality and focussing on the suppliers support for this process.
The main destinations for Brazilian exports are Latin America (53%), United States (17%), European Union (12%) and Southeast Asia (6%). The main products are cell phone handsets, components for industrial equipment, watertight compressor motor, onboard electronics and engines and generators. The main products imported are semi-conductors, components for telecommunications and computers, and they mainly come from Southeast Asia (61%), the European Union (19%) and the United States (12.7%) (CNM & DIEESE, 2010).
Fig. 1 illustrates the relationship between SC tiers in Brazil’s electro-electronic sector. National suppliers are generally SMEs and 30% of the raw materials used by the auto manufacturers are imported (Abinee, 2010). The relationship maintained with first tier suppliers is long term with partnerships in the product development process (Jabbour, 2009). The customers are the strong tier of Bra-zilian electro-electronic chains (Jabbour, 2009) and the production of products is predominantly for the domestic market (93%) (Abinee, 2010). The relationship maintained with second tier customers is predominantly long term with some partnership actions in the product development process (Jabbour, 2009).
Next, the major procedures adopted to carry out this empirical study are discussed.
Methodology
From the theoretical elements described in the previous section, the hypotheses for the empirical study were formulated:
H1: There is a relationship between CP and SCM practices; H2: The company size variable influences the adoption of
SCM practices;
H3: The company position variable influences the adoption of SCM practices;
H4: The bargaining power variable influences the adoption of SCM practices.
Since the research studied a specific sector, the electro-electronic sector, hypothesis 4 relates to its characteristics, in particular, bargaining power in the respondent com-pany’s main chain.
Survey design
The characterisation section includes questions such as the size of the company, identification and position of the company in its main SC and who has the greatest bargaining power in the chain. The nominal scale was adopted in this section.
The second section of the questionnaire is based on 13 assertions regarding the four CPs of this study, and each one represents a variable of the CP construct. The question relevance was evaluated based on the relevance given to it by the company. Using an ordinal 5-point Likert scale, the tendency of the CPs in companies was analysed from 1 (extremely irrelevant) to 5 (extremely relevant).
The third section adopts the questions (affirmative propositions) presented in literature, shown in Table 1in the ‘associated practices’ column. There are a total of 22 questions that refer to the identified categories of SCM practices. Using an ordinal 5-point Likert scale, the implementation level of SCM practices in the companies is evaluated from 1 (non-implemented) to 5 (totally implemented).
This study uses a self-administered questionnaire to gather the data after pre-testing it. To identify the ques-tions that could lead to misunderstandings (Synodinos, 2003), the questionnaire was pre-tested among operation management area professors, production engineering students and managers of functional areas such as logistics and production planning and control (PPC), from companies that supply components for the automotive/white line sectors. The pre-test lasted 65 days and led to a modifica-tion of the quesmodifica-tionnaire. After making sure that the
questionnaire was adequate to measure the study’s vari-ables (based on good alpha values), the data was gathered. In gathering data, first a database of affiliated members was obtained from Abinee. A web interface to the questionnaire was designed to allow easy access. Personalised emails were sent to 522 companies regis-tered in the database and the replies were monitored. After a period of 44 days and 3 ‘waves’ of e-mail receiving periods, the rate of return was 20% (107 respondents), which is considered adequate according to Malhotra and Grover (1998).
Data analysis
In the first step, the principal component analysis was applied to all variables, to study the inter-relationships between variables based on data reduction, i.e., the way the variables are combined to form the constructs of SCM practices (SCM_P) and competitive priorities (COM_P). Thus, the principal component analysis divides the vari-ables into groups (factors), summarising their relationship pattern.
The principal component analysis resulted in a frame-work with four factors for SCM and three factors for competitive priorities. Then, each of these factors was analysed for quality measures. These quality measures were obtained using then Statistical Package for the Social Sciences (SPSS) and SmartPLS software packages. SPSS proved to be useful for verifying the measures, such as the
Domestic supplier
Domestic
supplier
International supplier
(30%) Supplier
Supplier
Supplier
Customer
Customer
Customer
Domestic customer
customer (7%)
Assembler
Long-term relationship with partnership in product
development
Predominantly long-term relationship with partnership in
product development Mature
Technology
Strong tier
International
adequacy of the sample. When applying principal compo-nent analysis (four limiting factors/constructs for SCM), we were able to obtain the measures of quality for the framework using the Partial Least Squares (PLS) statistical technique. Based on these analyses, it was verified that H1 should be accepted.
For analysing the influence of size, position and bar-gaining power variables in adopting SCM practices (H2, H3 and H4), analyses were conducted based on One-way ANOVA and KruskaleWallis tests.
Sample profile
The classification of the respondent companies according to size indicated the presence of more medium sized compa-nies (42%), followed by small sized compacompa-nies (32%), large sized companies (16%), and micro companies (10%).
The position of the company in its major SCs is divided as follows: 76% of companies are assemblers, 16% are component suppliers, 5% are distributors, 2% are retailers, and 1% is basic raw material suppliers.
The identification of the tier with the highest bargaining power in the SC of companies studied demonstrates that 81% of the respondents consider that their customers are orga-nisations that can coordinate or even impose certain actions on the other actors of the chain. Concerning the other positions in the chain, the respondent companies and their suppliers, represent only 10% each. This means that the electro-electronics sector chains are managed by the customers (Kronmeyer Filho et al., 2004).
Results
Adoption of SCM practices
Table 2shows the results obtained in the adoption of SCM practices in the Brazilian electro-electronics companies surveyed. In this table, the supply chain management practices are presented and ranked according to the most frequently adopted practices (last columnepercentagee of Table 2) and can be divided into two groups: (1) customer-driven; or (2) supplier-driven.
The results indicate that the current level of adoption of SCM practices is ‘somewhat implemented’ since the mean of medians was 3.05 (which corresponds to the ‘somewhat implemented’ stage according to the Likert scale).
Variables that show 25% of the highest values of percentage (analysing the quartiles) can be used as param-eters to represent the most frequently adopted practices. In arriving at the most frequently adopted practices, six vari-ables stand out (range between 0.63 and 0.75).
‘Obtaining customers feedback on services adequacy’ (V17SCM);
‘Determine customers future needs’ (V15SCM); ‘Integration of product development activities with
suppliers’ (V2SCM);
‘Collaboration of suppliers with demand forecasting’ (V5SCM);
‘Consult customers to support decisions about new products’ (V18SCM);
Table 2 Results obtained concerning the adoption of SCM practices in companies of the Brazilian electro-electronics sector.
Variable Mean Standard
deviation
Coefficient of variation
Median Percentage
Customer feedback (V17SCM) 3.77 1.112 0.294 4 0.75 Customer future needs (V15SCM) 3.30 1.191 0.361 4 0.66 Supplier integration (V2SCM) 3.32 1.364 0.411 4 0.66 Supplier collaboration demand forecasting (V5SCM) 3.24 1.338 0.413 4 0.65 Customer support new product decision (V18SCM) 3.27 1.263 0.386 4 0.65 Customer integration (V1SCM) 3.15 1.309 0.415 3 0.63 Supplier collaboration production planning (V9SCM) 3.09 1.438 0.465 3 0.62 Customer collaboration demand forecasting (V6SCM) 3.09 1.285 0.416 3 0.62 Supplier collaboration stock planning (V7SCM) 3.07 1.445 0.470 3 0.61 Customer collaboration stock planning (V8SCM) 3.03 1.397 0.461 3 0.61 Supplier support product development (V21SCM) 3.07 1.406 0.457 4 0.61 Costumer collaboration production planning (V10SCM) 2.97 1.404 0.473 3 0.59 Consult suppliers production programming (V20SCM) 2.92 1.487 0.510 3 0.58 Consult customer production programming (V19SCM) 2.87 1.530 0.533 3 0.57 Supplier involvement in the plans (V4SCM) 2.79 1.419 0.508 3 0.56 Customer involvement in the plans (V3SCM) 2.79 1.358 0.486 3 0.56 Supplier communication future strategy (V16SCM) 2.64 1.369 0.518 3 0.53 Information sharing product launching supplier (V13SCM) 2.61 1.323 0.506 3 0.52 Participation in customer marketing (V14SCM) 2.53 1.383 0.546 3 0.51 Assembly near customer (V22SCM) 2.38 1.527 0.641 2 0.48 Cost information sharing customer (V12SCM) 2.12 1.385 0.653 1 0.42 Creation of multifunctional teams (V11SCM) 2.05 1.334 0.650 1 0.41
‘Integration of product development activities with customer’ (V1SCM).
Among those, four are customer-driven and two are supplier-driven variables. The customer-driven variables are related to ‘SC integration’, ‘Customer relationship’, and ‘Customer services management’ categories (as in Table 1). In other words, all customer-driven categories related to SCM practices were represented by at least one practice (variable) (as inTable 1). With regard to supplier-driven SCM practices, only the ‘SC integration’ category is represented by the practices. There are more customer-driven practices being adopted than supplier-customer-driven prac-tices, and the kind of practice is more restricted in the case of the suppliers. This can be seen as evidence of the influence of the strong tier, i.e., the customers have power over companies upstream in the chain, which may suggest the need for more relationship efforts and support to customers (Mouritsen, Skjott-Larsen, & Kotzab, 2003).
The least frequently implemented practices (25% of the variables with the lowest percentage value) are: ‘Inform supplier of future strategies’ (V16SCM), ‘Participation in the customer marketing effort’ (V14SCM), ‘Assemble product near the customer’ (V22SCM), ‘Information sharing about production costs with customer’ (V12SCM), and ‘Creation of multifunctional teams’ (V11SCM). These vari-ables are related to strategic information sharing, produc-tion postponing, and intercompany integration of functional areas (referTable 1), which depend largely on the customers’ will to keep a reasonable level of integra-tion with assembly companies, or on the assembly compa-nies’ will to integrate with the suppliers; they also depend on the level of reliability between the involved parties.
Factors that affect the adoption of SCM practices
Competitive priorities
Initially, using the SPSS software, the quality of the proposed model by principal component analysis was ana-lysed (4 factors) by verifying: (a) the adequacy of the sample for each individual factor using the Kai-sereMeyereOlkin (KMO) test, (b) Cronbach’s alpha of each factor, (c) the eigenvalue of each factor, where factors with eigenvalues greater than 1 were extracted, and (d) an accumulated explained variance.
The data reduction of all variables, of the latent ‘Competitive priorities’ variable (COM_P) as well as the ‘Supply chain management’ (SCM_P) latent variable was performed using the principal component analysis method withvarimax. This procedure was conducted independently for ‘Competitive priorities’ (COM_P) and ‘Supply chain management’ (SCM_P) variables (refer toTable 3).
In relation to the ‘Competitive priorities’ latent vari-ables (COM_P), three factors were formed, explaining an accumulated variance of approximately 50%. The Kai-sereMeyereOlkin (KMO) test that verifies the adequacy of the sample was 0.682, and is considered adequate. In order to refine the results, the Principal component analysis only shows variable loadings higher than 0.6 and factors with eigenvalues higher than 1 and coefficients of the diagonal of the matrix anti-image higher than 0.6. We also checked
the commonalities for each variable, which should be greater than 0.5 (Hair, Babin, Money, & Samouel 2005). ‘Competitive priorities’ (COM_P) began to be formed by three factors:
‘Competitive priorities 1’ (COM_P_1), with the vari-ables ‘Product variety’ (V11CP), ‘New product’ (V3CP) and ‘Product range’ (V5CP);
‘Competitive priorities 2’ (COM_P_2), with the vari-ables ‘Follow technical requirement’ (V10CP) and ‘Prevent defect’ (V13CP); and
‘Competitive priorities 3’ (COM_P_3), with the ‘Production cost’ variables (V7CP) and ‘Production volume’ (V9CP).
The COM_P_1 factor combines competitive priorities variables of product-related flexibility; therefore it is called ‘Product flexibility’. The COM_P_2 factor combines competitive priorities variables of quality, as a result of the variable profile, and this factor is called ‘Standard of quality’. And the COM_P_3 factor combines a cost-related competitive priorities variable and a flexibility-related competitive priorities variable. Since production volume (V9CP) is related to production cost (V7CP) (the higher the volume the lower the production cost), the variable is labelled ‘Production volume’.
In relation to the supply chain management practices latent variable (SCM_P), four factors were formed, explaining an accumulated variance of approximately 65%. The KaisereMeyereOlkin (KMO) test was 0.879, considered adequate. Also for this analysis, the principal component analysis shows variable loadings higher than 0.6 and factors with eigenvalues higher than 1 and coefficients of the diagonal of the matrix anti-image higher than 0.6. We also checked the commonalities for each variable, which should be greater than 0.5 (Hair et al., 2005). As a consequence, ‘Supply chain management’ (SCM_P) began to be formed by four factors:
‘Supply chain management 1’ (SCM_P_1), with the variables ‘Collaboration in client planning production’ (V10SCM), ‘Collaboration in supplier forecast demand’ (V5SCM), ‘Collaboration in client forecast demand’ (V6SCM), ‘Collaboration in supplier planning stock’ (V7SCM), ‘Collaboration in client planning stock’ (V8SCM) and ‘Collaboration in supplier planning production’ (V9SCM);
‘Supply chain management 2’ (SCM_P_2), with the variables ‘Client feedback’ (V17SCM), ‘Support client in new product decision’ (V18SCM), ‘Consult client in production programming’ (V19SCM), ‘Consult supplier in production programming’ (V20SCM) and ‘Support supplier in product development’ (V21SCM);
‘Supply chain management 3’ (SCM_P_3), with the variables ‘Participation in client marketing manage-ment’ (V14SCM), ‘Future client need’ (V15SCM), ‘Involvement in client plans’ (V3SCM) and ‘Involvement in supplier plans’ (V4SCM); and
The ‘Supply chain management 1’ (SCM_P_1) factor is called ‘SC integration to support production planning and control activities (PPC)’ since it groups variables related to stock planning, production and demand forecast between customers and suppliers. The ‘Supply chain management 2’ (SCM_P_2) factor is labelled ‘Sharing of information to guide product and production decisions’, since it is comprised of variables that deal with support and consulting the customer and supplier about produc-tion scheduling and development of new products. The ‘Supply chain management 3’ (SCM_P_3) factor is called ‘Management of support for future plans of customers’, since it groups variables that deal with managing involvement with customers. And ‘Supply chain manage-ment 4’ (SCM_P_4) factor is called ‘Close relationship with the customer’, since it deals with the union of non-trivial variables, such as the open sharing of production costs with the customer.
Table 3shows the variables that integrate the structural model after purification of the model based on principal component analysis and the adopted quality indicators.
Table 4shows the variables that were not approved in the principal component analysis quality indicators, pre-senting justifications for the exclusion of each variable.
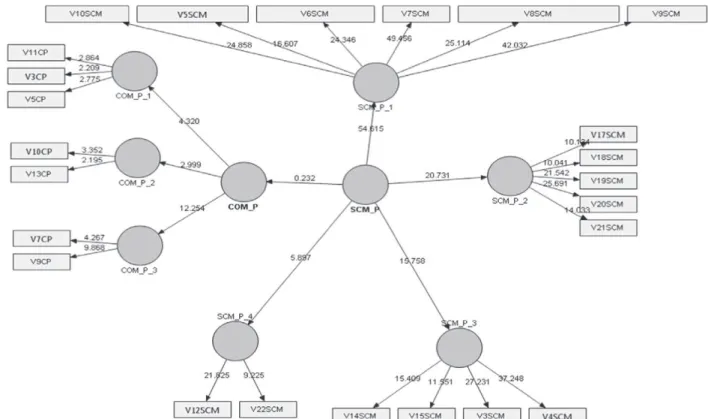
Next, the partial least squares (PLS) was used. Partial least squares (PLS) is a second-generation structural equation modelling technique and is especially useful when working with theory in early stages of development. A framework was created containing constructs obtained from the principal component analysis, as explained above. The aim of this procedure was to test the validity and reliability of the principal component analysis model. The analyses were conducted using SmartPLS 2.03 software (Sosik, Kahai & Piovoso, 2009).
In general, the proposed structural model is appropriate since the Goodness of fit criteria (GoF), which evaluates the
Table 4 Variables excluded after purification of the structural model and its justifications. Latent variables Variables excluded after
principal components analysis
Criteria (aZDiagonal
of anti-image matrix
<0.6; bZCommunality<0.5)
COMP_P V1CP b
V2CP a
V4CP b
V6CP b
Table 3 Variables that comprise the structural model after purification.
Latent variables Factors Label Variables
SCM_P SCM_P_1 Integration of SC to support PPC activity V10SCM V5SCM V6SCM V7SCM V8SCM V9SCM SCM_P_2 Sharing of information to guide product
and production decisions
V17SCM V18SCM V19SCM V20SCM V21SCM SCM_P_3 Management of support for future plans of customers V14SCM V15SCM V3SCM V4SCM SCM_P_4 Close relationship with the customer V12SCM
V22SCM
COMP_P COMP_P_1 Product flexibility V11CP
V3CP V5CP
COM_P_2 Standard of quality V10CP
V13CP
COM_P_3 Production volume V7CP
general quality of the model, was approximately 0.6, which is considered adequate (above 0.5).
Besides this Goodness of fit criteria (GoF), good quality indicators for the proposed framework (Fig. 2) have been achieved in terms of average variance extracted, composite reliability, Cronbach’s alpha and communality, for COM_P and ‘Supply chain management’ (SCM_P). To reach a satisfied reliability and validity, the composite reliability value should be higher than 0.7 while the average variance extracted (AVE) value should be higher than 0.5. Construct reliability was assessed using composite reli-ability. Convergent validity examined the average variance extracted (AVE) measure. Table 5 shows that all of the composite reliability values are higher than 0.7 and all of
the average variance extracted values are higher than 0.5 (Foltz, 2008). The Cronbach’s alpha and communality coefficients are also considered adequate.
InTable 6, the bold diagonal representing the square root of the average variance extracted exceeded the off-diagonal elements in the construct correlation matrix. Consistent results were obtained. A bootstrap of 1000 subsamples was used to estimate statistical significance of proposed rela-tionships between indicators and constructs (Fig. 3). All of the model’s relationships are statistically valid at a level of significance (p-value) less than or equal to 0.05, except the relationship between latent variables ‘Competitive priori-ties’ (COM_P) and ‘Supply chain management’ (SCM_P), which indicates that this relationship is not statistically valid.
Figure 2 Purified and measure structural model.
Table 5 Quality measures for the proposed framework. AVE Composite
reliability
Cronbach’s alpha
Communality
COM_P_1 0.518 0.762 0.537 0.518
COM_P_2 0.697 0.821 0.571 0.697
COM_P_3 0.683 0.810 0.551 0.683
SCM_P_1 0.769 0.952 0.940 0.769
SCM_P_2 0.585 0.875 0.822 0.585
SCM_P_3 0.641 0.877 0.812 0.641
Contextual factors
In order to identify the difference of averages between theoretical categories of supply chain management (SCM) practices (supply chain integration; information sharing; customer service management; customer relationship; supplier relationship; and postponement) in accordance with the contextual factors (size, position and bargaining power), the analysis of variance was conducted, more specifically, the One-way ANOVA. An analysis of variance aims at verifying the existence of a significant difference between the averages of the study variables (SCM prac-tices) in accordance with the division of groups (defined by size, position and bargaining power) or, to verify whether the groups exercise any influence on any dependent vari-able (varivari-ables of SCM practices).
Thus, for the study, the nonexistence of any difference between the averages or the nonexistence of any influence of contextual factors (size, position, or bargaining power)
in the score, given each of the variables considered in the study, was initially considered a null hypothesis.
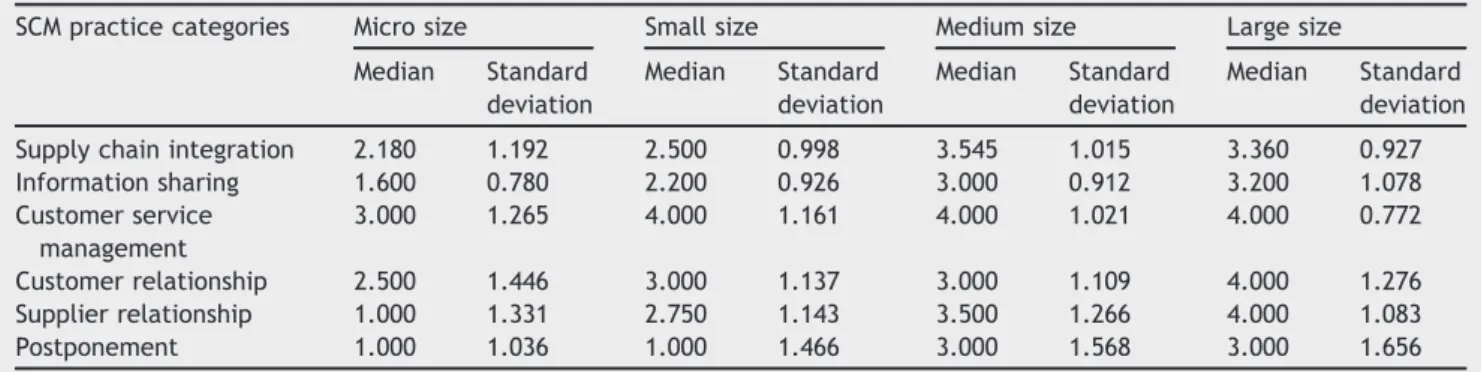
In the case of the contextual variable beingsize, using analysis of variance, it was observed that the null hypoth-esis cannot be rejected only for the postponement practice category. Thus, considering a significance level of 5% for all other categories, there is a significant difference between at least two sizes (Supply chain integration: p -value Z 0.001; Information sharing: p-value Z 0.001; Customer service management:p-valueZ0.005; Customer relationship: p-value Z 0.047; Supplier relationship: p-value Z 0.005). Using the Scheffe’s test (multiple comparisons) the values (scores) for the variables of SCM practices increase in conformity with the increase in size. That is, the larger the company, the greater the degree of SCM practices adoption. Size affects the adoption of SCM practices.Table 7illustrates the distribution of categories of SCM practices according to size.
Table 6 Construct correlation matrix.
COM_P_1 COM_P_2 COM_P_3 SCM_P_1 SCM_P_2 SCM_P_3 SCM_P_4 COM_P_1 0.720
COM_P_2 0.501 0.835
COM_P_3 0.784 0.303 0.826
SCM_P_1 0.015 0.053 0.003 0.877
SCM_P_2 0.012 0.090 0.060 0.814 0.765
SCM_P_3 0.001 0.013 0.049 0.815 0.629 0.801
SCM_P_4 0.126 0.038 0.121 0.508 0.342 0.394 0.845
For the contextual factor ofposition, it was observed that the basic presuppositions of analysis of variance (population following normal distribution and homogeneity of variance) were not valid. Furthermore, in the analysis of data, only those cases with a position equal to 1 (assem-bler), 3 (component supplier) and 4 (distributor) have sufficient respondents. Positions 2 (raw material supplier) and 5 (retail) do not have sufficient respondents. Thus, it was decided to apply a non-parametric test, analogous to the analysis of variance: the Kruskal Wallis test. The null hypothesis and alternative remain the same (Null hypoth-esis: the values obtained for the variables under study do not depend on position, that is, the averages are equal. Alternative hypothesis: the values obtained for each vari-able depend on the position, that is, there are at least two positions with different averages for each variable under study). Considering a significance level of 5%, a differ-ence was observed for two categories of SCM practices. Customer service management: position 3 (components supplier) has higher values, followed by position 1 (assem-bler) and then position 4 (distributor). Customer relation-ship: position 3 (components supplier) has higher values, followed by position 4 (distributor) and then position 1 (assembler). No significant differences were observed for the other categories. Therefore, the company’s position in its main SC affects the adoption of SCM practices. And in this case, the one in the components supplier position has a higher degree of adoption of SCM practices geared towards customers. Table 8 illustrates the distribution of categories of SCM practices according to position.
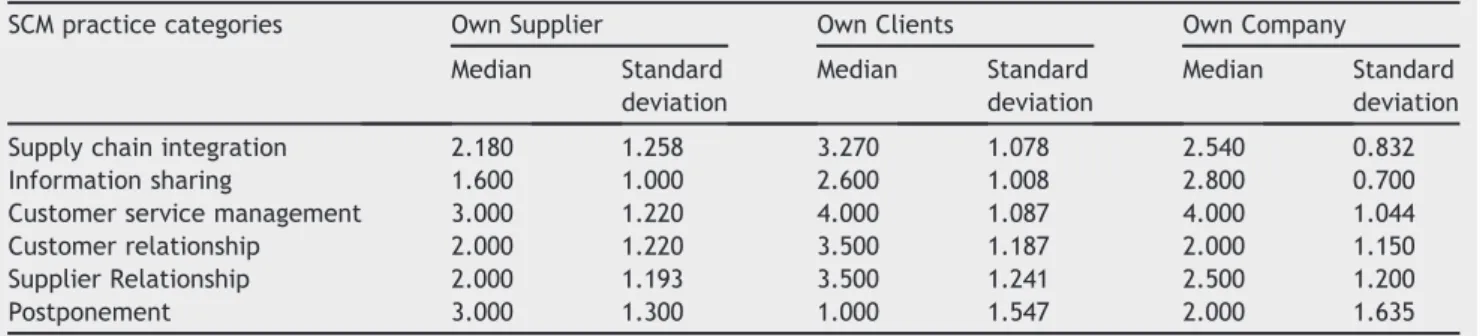
For the analysis according tobargaining power, consid-ering a significance level of 5%, the null hypothesis is rejected
for the following categories of SCM practices: Customer Relationship and Supplier Relationship. The averages between the groups defined by bargaining power are different and thus bargaining power influences the final value of Customer Relationship (p-value 0.049) and Supplier Rela-tionship (p-value: 0.024). Group 2 (customer has greater bargaining power) has a significantly higher average than groups 1 (supplier with more bargaining power) and 3 (the respondent company has greater bargaining power). Thus, bargaining power affects the adoption of SCM practices. And in the study, the one with the customer as the strongest tier in the SC tends to adopt more SCM practices related to customer and supplier relationships.Table 9illustrates the distribution of categories of SCM practices according to bargaining power.
Discussion
A literature review on SCM practices enabled us to identify a research opportunity: Which factors affect the adoption of SCM practices? Subsequently, four research hypotheses were drawn up: (1) there is a relationship between competitive priorities and the adoption of supply chain management practices, (2) the company size variable influences the adoption of SCM practices, (3) the company’s position variable influences the adoption of SCM practices and (4) the bargaining power variable influences the adoption of SCM practices.
Different statistical tests were employed to analyse these hypotheses. The results are shown inTable 10.
Hypothesis 1 was elaborated based on arguments by Rudberg and Olhager (2003), Maia et al. (2005), Demeter
Table 7 Distribution of categories of SCM practices in accordance with company size.
SCM practice categories Micro size Small size Medium size Large size Median Standard
deviation
Median Standard deviation
Median Standard deviation
Median Standard deviation Supply chain integration 2.180 1.192 2.500 0.998 3.545 1.015 3.360 0.927 Information sharing 1.600 0.780 2.200 0.926 3.000 0.912 3.200 1.078 Customer service
management
3.000 1.265 4.000 1.161 4.000 1.021 4.000 0.772
Customer relationship 2.500 1.446 3.000 1.137 3.000 1.109 4.000 1.276 Supplier relationship 1.000 1.331 2.750 1.143 3.500 1.266 4.000 1.083 Postponement 1.000 1.036 1.000 1.466 3.000 1.568 3.000 1.656
Table 8 Distribution of categories of SCM practices in accordance with company position in the supply chain. SCM practice categories Assembler Raw material supplier Component suppliers Distributor Retail
Median Standard deviation
Median Standard deviation
Median Standard deviation
Median Standard deviation
Median Standard deviation Supply chain integration 3.220 0.953 4.634 0.000 3.364 1.260 1.727 1.809 1.180 0.257 Information sharing 2.600 0.923 3.400 0.000 3.000 1.184 2.400 1.200 1.000 0.000 Customer service
management
4.000 1.016 5.000 0.000 5.000 1.334 4.000 0.894 1.500 0.707
et al. (2006), Vachon et al. (2009)andSalles et al. (2010), which indicated that in general the CPs impact the struc-ture of the SC and how it is managed. However, this hypothesis was not supported statistically. The reason is probably the fact that the respondent companies in the study are not focal in their main supply chain. Demeter et al. (2006) pointed this out after suggesting that the company’s focal strategy is strongly related to SC configu-ration and the use of SCM practices.
Hypothesis 2 was constructed from studies by Quayle (2003), Arend and Wisner (2005), Thakkar et al. (2008) and Vaaland and Heide (2007), who indicated that small and medium companies tend to have difficulties in adopting SCM practices alone, or they are not prepared for the SC environment. Hypothesis 2 was supported, since in the ANOVA tests, the larger the company, the greater the degree of adoption of SCM practices.
Hypothesis 3 was formulated from indications of prior studies such as those byHarland (1997)andLi et al. (2005, 2006), who affirmed the company’s position in its main chain differentiates it in terms of performance perception and the use of certain SCM practices. The hypothesis was supported and it was ascertained that the company’s position in its main SC affects the adoption of SCM prac-tices. And in this case, the one in the components supplier position has a higher degree of adoption of SCM practices geared towards customers.
Hypothesis 4 was proposed based on studies by Wong et al. (2005) and Jharkharia and Shankar (2006), who ascertained the conditions and characteristics of the industrial sector, such as bargaining power, affect the adoption of SCM practices. The hypothesis was supported since it was verified that the one with the customer as the
strongest tier in the SC tends to adopt more SCM practices related to customer and supplier relationships.
Therefore, the main results are: (a) contextual factors such as size, position and bargaining power affect the adoption of SCM practices; (b) the sector characteristics (the fact that the chain was managed by customers) explains why SCM practices geared towards customers had a greater adoption and that there was no significant rela-tionship between CP and SCM practices (respondents are not focal companies in their chains).
Conclusions
The main objectives of this paper were to identify the SCM practices being adopted by Brazilian electro-electronic companies and identify which factors affect the adoption of SCM practices. The international litera-ture on SCM practices were scanned and four hypotheses were generated and analysed statistically. The results indicate that three of the hypotheses are supported and that the adoption of SCM practices is more customer-driven.
The main contributions of this study are:
The SCM practices that have been implemented more frequently are: Obtaining customer feedback on services adequacy (V17SCM), determining customers’ future needs (V15SCM), integration of product devel-opment activities with suppliers (V2SCM), collaboration of suppliers with demand forecasting (V5SCM), consul-ting customer to support decisions about new products (V18SCM), and integration of product development activities with customer (V1SCM);
Table 10 Results of the statistical analysis of research hypotheses.
Hypothesis Conclusion Justification
H1eThere is a significant relationship between competitive
priorities (COM_P) and supply chain management practices (SCM_P)
Not Supported No statistically significance (p-value<0.05)
H2eThe company size variable influences the adoption
of supply chain management practices
Supported Reject the null hypothesis
H3eThe company position variable influences the adoption of supply chain management practices
Supported Reject the null hypothesis
H4eThe company bargaining power variable influences the adoption of supply chain management practices
Supported Reject the null hypothesis
Table 9 Distribution of categories of SCM practices in accordance with company bargaining power.
SCM practice categories Own Supplier Own Clients Own Company Median Standard
deviation
Median Standard deviation
The companies in the electro-electronic sector sample are currently in the stage of partial implementation of different SCM practices, except for strategic practices since customers are probably not open to integration, and/or there is a lack of trust between the pairs; More customer-driven practices are adopted than
supplier-driven;
The practices based on the customer include all prac-tice categories, whereas those based on the suppliers include the SC integration category alone;
Contextual factors such as size, position and bargaining power affect the adoption of SCM practice;
The relationship between CP and SCM practices is not statistically significant;
Sector characteristics help understand the behaviour of SCM practices.
There were major SCM practices (25% of the variables with higher percentage values) that were implemented with the customer’s tier due to the fact that downstream categories are more diverse (four categories) than upstream categories (only one category). This can be explained because the chain is managed by the customers. The position of the chain’s strong tier influences the prac-tices adoptedMouritsen et al. (2003). Additionally,Halley and Beaulieu (2010)also ascertained that the adoption of practices with customers is more intense than with suppliers.
This study answers research questions raised byLi et al. (2005, 2006)and confirmHalley and Beaulieu’s (2010)and Jharkharia and Shankar’s (2006) results, confirming that contextual factors affect the adoption of SCM practices. However, they do not confirm the results of Salles et al. (2010), Maia et al. (2005)and Vachon et al. (2009), who suggest that the CPs impact SC relationships and structure. A possible explanation is that the chains are managed by the customers. This can be verified by evaluating the low percentage values of retail companies in the survey, which is a tier that tends to be focal (tends to have higher bar-gaining power) in electro-electronic sector chains.
The Brazilian electro-electronic sector is governed by its customers, the majority domestic (93%) and it has a series of small and medium domestic suppliers, with 30% of raw materials being imported. Due to these character-istics, the study’s results indicate that: (a) size of the respondent company affects the adoption of SCM prac-tices, where the larger the company, the greater the degree of adoption of practices (the sector is very segmented and therefore has a great diversity of sizes), (b) the company’s position affects the adoption of SCM prac-tices (component suppliers are those that most adopt practices and they are related to support of customers. It is worth recalling that for the suppliers, assemblers are the customers, that is, the practices are directed towards supporting the respondent companies strong tier), and (c) company bargaining power affects the adoption of SCM practices so companies with customers as the strong tier adopt not only customer-oriented practices (customer relationships), but suppliers too (supplier relationships) because the relationship maintained with first tier suppliers is long term, with partnerships in the product development process (Jabbour, 2009).
Studying SCM practices helped generate empirical evidence on how SCM is considered by companies and thus contributes towards advances in the search for conver-gence for a theoretical understanding of this theme. This is more so because this study is aligned withVaart and Donk (2008), who affirm that the use of SCM practices plays an important role for focal companies, that is, the context of the SC is important to understand the dynamics between customer, the assembler and suppliers.
The findings of this study are useful for supporting managerial decisions since they point out the characteris-tics of the Brazilian electro-electronic sector, which is part of the global supply chain, and identify the profile of the SCM practices in this sector, which are focused on inte-grating and supporting product development activities with the customers.
Nevertheless, a limitation of this research is the return rate obtained, 107 respondents, but it proved adequate for the purpose of the statistical analyses performed.
It is advised that future studies should include the same survey conducted in the present study but with focal companies in their SC, in order to verify whether the lack of influence of CPs on the adoption of SCM practices is related to this condition. Another suggestion is to increase the survey sample size including foreign companies to conduct a comparative study.
References
Abinee, & Brazilian Electro-Electronic National Association.
(2009). Associac¸~ao Brasileira da Industria Nacional de Eletr-
ica Eletronica^ . Available. www.abinee.org.br Accessed May, 2009.
Abinee. (2010). Consolidac¸ao da pesquisa com as pequenas e~
medias empresas do setor eletroeletr^onico. Recuperado em:
23/11/2010b de. http://www.abinee.org.br/informac/
arquivos/pan2010.pdf.
Arend, R. J., & Wisner, J. D. (2005). Small business and supply
chain management: is there a fit? Journal of Business
Venturing, 20, 403e436.
Basnet, C., Corner, J., Wisner, J., & Tan, K. (2003). Benchmarking
supply chain management practice in New Zealand. Supply
Chain Management: An International Journal, 8, 57e64.
Burgess, K., Singh, P. J., & Koroglu, R. (2006). Supply chain management: a structured literature review and implications
for future research. International Journal of Operations &
Production Management, 26(7), 703e729.
Chow, W. S., Madu, C. N., Kuei, C., Lu, M. H., Lin, C., & Tseng, H. (2008). Supply chain management in the US and Taiwan: an
empirical study.Omega, 36, 665e679.
CNM/CUT (Confederac¸~ao Nacional dos Metalurgicos), & DIEESE
(Departamento Intersindical de Estatıstica e Estudos
Socio-econ^omicos). (2010).Setor eletroeletronico no Brasil^ etexto de
apoio com informac¸oes gerais~ . Recuperado em 21/11/2010 de.
http://www.imfmetal.org/files/10041915024410005/Dorival_ Jesus_do_Nacimento.pdf.
Demeter, K., Gelei, A., & Jenei, I. (2006). The effect of strategy on supply chain configuration and management practices on the basis of two supply chains in the Hungarian automotive industry.
International Journal of Production Economics, 104, 555e570.
Fine, C. H., & Hax, A. C. (1985). Manufacturing strategy: a
meth-odology and an illustration.Interfaces, 15(6), 28e46.
Foltz, C. B. (2008). Why users (fail to) read computer usage
Gavira, M. O. (2008). Gest~ao de inovac¸~oes em subsidiarias de multinacionais do setor eletroeletr^onico instaladas no Brasil. Doctorate Dissertation, Universidade Estadual de Campinas, Brazil, Sao Paulo, Campinas.
Hair, J. F., Jr., Babin, B., Money, A. H., & Samouel, P. (2005).
Fundamentos de metodos de pesquisa em administrac¸~ao. Bra-zil, Porto Alegre: Bookman.
Halley, A., & Beaulieu, M. (2010). A multidimensional analysis of
supply chain integration in Canadian manufacturing.Canadian
Journal of Administrative Sciences, 27, 174e187.
Harland, C. (1997). Supply chain operational performance roles.
Integrated Manufacturing Systems, 8, 70e98.
Hauser, G., Zen, A. C., Selao, D. C., & Garcia, P. L. (2007). A
industria eletr^onica no Brasil e na China: um estudo
com-parativo e a analise das pol ıticas publicas de est ımulo a
capac-idade tecnologica do setor.Journal of Technology Management
& Innovation, 2, 85e96.
Hayes, R. H., & Wheelwright, S. C. (1984).Restoring our
compet-itive edge e competing through manufacturing. USA: John
Wiley & Sons.
Hsu, C. C., Tan, K. C., Kannan, V. R., & Leong, K. G. (2009). Supply chain management practices as a mediator of the relationship between operations capability and firm
perfor-mance. International Journal of Production Research, 47,
835e855.
Jabbour, A. B. L. S. (2009).Prioridades competitivas da produc¸ao e~
praticas de gest~ao da cadeia de suprimentos: uma survey no setor eletroeletronico brasileiro^ . Doctoral Dissertation, Federal University of Sao Carlos, Brazil.
Jharkharia, S., & Shankar, R. (2006). Supply chain management: some sectoral dissimilarities in the India manufacturing
industry.Supply Chain Management: An International Journal,
11, 345e352.
Koh, S. S., Demirbag, M., Bayraktar, E., Tatoglu, E., & Zaim, S. (2007). The impact of supply chain management practices on
performance of SMES.Industrial Management & Data Systems,
107, 103e124.
Kronmeyer Filho, O. R., Fachinello, T., & Kliemann Neto, F. J.
(2004). O mapeamento da cadeia eletr^onica no RS: um estudo
inicial. InProceedings XXIV Encontro Nacional de Engenharia de
Produc¸ao (Enegep)~ , Brazil, Florianopolis.
Lambert, D. M., & Cooper, M. C. (2000). Issues in supply chain
management.Industrial Marketing Management, 29, 65e83.
Lambert, D. M., Cooper, M. C., & Pagh, J. D. (1998). Supply chain management: implementation issues and research
opportuni-ties. The International Journal of Logistics Management, 9,
1e19.
Leong, G. K., Snyder, D. L., & Ward, P. T. (1990). Research in the
process and content of manufacturing strategy.Omega, 18(2),
109e122.
Li, S., Ragu-Nathan, B., Ragu-Nathan, T. S., & Rao, S. S. (2006). The impact of supply chain management practices on competitive
advantage and organizational performance. Omega, 34,
107e124.
Li, S., Rao, S. S., Ragu-Nathan, T. S., & Ragu-Nathan, B. (2005). Development and validation of a measurement instrument for
studying supply chain management practices.Journal of
Oper-ations Management, 23, 618e641.
Lummus, R. R., & Vokurka, R. J. (1999). Defining supply chain management: a historical perspective and practical guidelines.
Industrial Management & Data Systems, 99, 11e17.
Maia, J. L., Cerra, A. L., & Alves Filho, A. G. (2005). Inter-relac¸~oes
entre estrategia de operac¸~oes e gest~ao da cadeia de
supri-mentos: estudos de caso no segmento de motores para
automoveis.Gest~ao & Produc¸~ao, 12(3), 377e391.
Malhotra, M. K., & Grover, V. (1998). An assessment of survey
research in POM: from constructs to theory.Journal of
Opera-tions Management, 16, 407e425.
Mcivor, R., & Humphreys, P. (2004). Early supplier involvement in the design process: lessons from the electronics industry.
Omega, 32, 179e199.
Mentzer, J. T., Dewitt, W., Keebler, J., Min, S., Nix, N., Smiith, C.,
et al. (2001). Defining supply chain management. Journal of
Business Logistics, 22, 1e25.
Mouritsen, J., Skjott-Larsen, T., & Kotzab, H. (2003). Exploring the
contours of supply chain management. Integrated
Manufacturing Systems, 14, 686e695.
Nassif, A. (2002).Complexo eletronico brasileiro. BNDES 50 anos:^
historias setoriais. Available.www.bndespar.com.br Accessed October, 2009.
Olhager, J., & Selldin, E. (2004). Supply chain management survey
of Swedish manufacturing firms. International Journal of
Production Economics, 89, 353e361.
Pires, S. R. I. (2004). Gest~ao da cadeia de suprimentos (supply
chain management)econceitos, estrategias, pr aticas e casos.
Brazil, Sao Paulo: Atlas.
Quayle, M. (2003). A study of supply chain management practice in
UK industrial SMEs.Supply Chain Management: An International
Journal, 8(1), 79e86.
Robb, D. J., Xie, B., & Arthanari, T. (2008). Supply chain and operations practice and performance in Chinese furniture manufacturing.
International Journal of Production Economics, 112, 683e699.
Rudberg, M., & Olhager, J. (2003). Manufacturing networks and supply
chains: an operations strategy perspective.Omega, 31, 29e39.
Salles, J. A. A., Vieira, M., Jr., Vaz, R. R., & Vanalle, R. M. (2010). Manufacturing strategies in the auto industry in Brazil and
Spain.International Conference on Industrial Engineering and
Engineering Management1661e1665, 5674592.
Skinner, W. (1969). Manufacturing-missing link in corporate
strategy.Harvard Business Review136e145, May/Jun.
Sosik, J. J., Kahai, S. S., & Piovoso, M. J. (2009). Silver bullet or voodoo statistics?: a primer for using least squares data analytic
technique in group and organization research.Group &
Orga-nization Management, 35(5), 5e36.
Stock, J. R., & Boyer, S. L. (2009). Developing a consensus
defini-tion of supply chain management: a qualitative study.
Inter-national Journal of Physical Distribution & Logistics Management, 39(8), 690e711.
Stock, J. R., Boyer, S. L., & Harmon, T. (2010). Research
oppor-tunities in supply chain management.Journal of the Academy
Marketing Science, 38, 32e41.
Synodinos, N. E. (2003). The “art” of questionnaire construction: some important considerations for manufacturing studies.
Integrated Manufacturing Systems, 14, 221e237.
Tan, K. C. (2002). Supply chain management: practices, concerns,
and performance issues.Journal of Supply Chain Management,
38, 42e53.
Tan, K. C., Lyman, S. B., & Wisner, J. D. (2002). Supply chain
management: a strategic perspective.International Journal of
Operations & Productions Management, 22, 614e631.
Tan, L., & Hwang, A. R. (2002). Imported technology and R & D in
the Taiwanese electronic industry. Review of Development
Economics, 6, 77e90.
Thakkar, J., Kanda, A., & Deshmukh, S. G. A. (2008). Conceptual role
interaction model for supply chain management in SMES.Journal
of Small Business and Enterprise Development, 15(1), 74e95.
Vaaland, T. I., & Heide, M. (2007). Can the SME survive the supply
chain challenges?Supply Chain Management: An International
Journal, 12(1), 20e31.
Vaart, T., & Donk, D. P. (2008). A critical review of survey-based
research in supply chain integration.International Journal of
Production Economics, 111, 42e55.
Vachon, S., Halley, A., & Beaulieu, M. (2009). Aligning competitive priorities in the supply chain: the role of interactions with
suppliers. International Journal of Operations & Production
Voss, C. A. (1995). Alternative paradigms for manufacturing
strategy. International Journal of Operations & Production
Management, 15(4), 5e16.
Wong, C. Y., Arlbjorn, F. S., & Fohansen, F. (2005). Supply chain
management practices in toy supply chains. Supply Chain
Management: An International Journal, 10, 367e378.
Zhao, X., & Lee, T. (2009). Developments and emerging research opportunities in operations strategy and supply chain
manage-ment.International Journal of Production Economics, 120, 1e4.
Zhou, H., & Benton, W. C., Jr. (2007). Supply chain practice and
information sharing. Journal of Operations Management, 25,