Income inequality in post-communist Central and
Eastern European countries
Sara ROSE
*, Crina VIJU
**Abstract
Income inequality has become an important issue in Central and Eastern European countries during their transition process. This study constructs a model incorporating different categories of factors that impact inequality and tests whether the wealth of a country makes a difference in these relationships. This article shows that different income categories of Central and Eastern European transition countries do experience different relationships between income inequality and its contributing factors: economic, demographic, political, and cultural and environmental. The resulting Random Effects models of the best fit incorporate economic and political factors and show differences in magnitude, direction, and in their significance. These findings add to the literature by taking a cross-country and cross-income view on the impact of various factors.
Keywords: Central and Eastern European countries, income inequality, transition economies
1. Introduction
Equality was one of the lofty goals of Communism in Central and Eastern Europe. It is a commendable aim but proved unrealistic, even though levels of income inequality in those countries were much lower during the Communist era than they are at present (Milanovic, 1998). Decreasing levels of inequality is an important issue but how should it be addressed in the context of
differentă countries?ă Doă differencesă ină countries’ă characteristicsă materially impact inequality? This paper will seek to show that, in terms of transition economies, countries with different levels of wealth experience different relationships between income inequality and its contributing factors. The goal of
*Sara Rose is PhD candidate at Wilfrid Laurier University, Waterloo, Canada; e-mail:
srose@balsilllieschool.ca.
**Crina Viju is assistant professor at Carleton University, Ottawa, Canada; e-mail:
this study is to firstly construct a model incorporating different categories of factors that impact inequality within a country and, secondly, to test whether or
notătheă‘incomeăcategory’ămakesăaădifferenceăinăincomeăinequality,ăwhereătheă
income category is the level ofăaăcountry’săincome,ăasădeterminedăbyătheăWorldă
Bank’să Atlasă Methodă usingă Grossă Natională Incomeă (GNI)ă peră capita,ă dividedă
into low-, middle-, and high-income categories. It will illustrate that there are different relationships between income inequality and its contributing factors dependent on the particular income category.
The paper is organized as follows. Sections 2 and 3 review contributions to income inequality in developing and transition economics literature, followed by a description of the data used in the analysis. Section 5 will present and describe the empirical methodology and results. Section 6 concludes.
2. Income inequality and economic development
TheărootăofămuchăofătheăstudyăonăincomeăinequalityăisăfoundăinăKuznets’ă (1955)ăpaper,ă“EconomicăGrowthăandăIncomeăInequality”.ăItăoffersăanăattemptăată
explaining income inequality by studying the effects of savings and the shift in focus from the agricultural to the industrial sector. It also compares income inequality in developed versus developing countries, providing a logical, speculative argument that income levels would be more unequal in underdeveloped countries due to the disproportionate income share of the highest income bracket. As this paper seeks to show and as found in various other studies, Kuznets recognizes that there are differences in income inequality across different stages of economic growth (Kuznets, 1955).
SubsequentăresearchăhasăbuiltăuponăKuznets’ăwork,ălookingăatăchangesă ină incomeă inequalityă ină termsă ofă aă country’să economic growth and various factors, economic, political or cultural, that have an impact on inequality. Some studies have found that there is not a strong link between inequality and growth, instead finding strong relationships between growth and poverty (Deininger and Squire, 1996). Studies focusing on impacting factors have found mixed results based on the country or group of countries selected. For example, when researching a potential relationship within OECD countries between inequality and imports of manufactured goods, a relationship was found when non-European countries were included, but the relationship did not exist if these countries were excluded from the sample (Gustafsson and Johansson, 1999).
be an inefficient allocation of assets as, for example, the rich own the majority of land (Todaro and Smith, 2009). Income inequality is also detrimental from social and political perspectives as it can increase socio-political instability (Park, 1996) and facilitate rent-seeking behaviour including cronyism (Samanta and Heyse, 2006), whereas others argue that high enough inequality can reduce growth (Ravallion, 1997). Ravallion, in the same 1997 study, also showed that countries with high levels of income inequality gain less from economic growth in terms of poverty alleviation as the impact on absolute poverty is reduced. The inverse relation, the impact of growth on income inequality, is also unclear. Empirical evidence has shown that changes in income distribution are generally not correlated with growth; inequality increases in roughly half of the cases and in the other half, it decreases (Bruno, Ravallion, and Squire, 1998).
Not only is it challenging to form solid conclusions about a relationship between income inequality and growth, it is also difficult to form general conclusions about income inequality in developing countries. Differences can come from different regions and time periods (Wood, 1997), the openness of the country to globalization (Rudra, 2004), and numerous other factors. This perspective is extended to this study, where differences in income categories across transition economies will be analyzed. Even within a country there can be differences, such as the impact of economic growth among various groups of the poor (Ravallion, 2001). These differences make broad cross-country analysis more difficult when searching for general conclusions; therefore, conclusions must often be more specific to particular situations.
3. Inequality and transition economies
The socialist system saw lower levels of income inequality in comparison to countries at similar levels of development but all transition countries registered an increase in inequality after the fall of Communism (Bandelj and Muhutga, 2010). The average Gini coefficient of disposable income in transition economies increased from 24 to 33 in just nine years and an increase in the dispersion of Gini coefficients could also be observed (Milanovic, 1998). At first, this increase in income inequality was tolerated by the people as it was seen as a sign of increased potential opportunities. Tolerance then decreased over time as the income distribution process was increasingly seen as unfair and people became dissatisfied with the economic situation within their countries (Grosfeld and Senik, 2010), and with good reason; economic reforms in transition economies have stagnated and convergence with the living standards of advanced economies has stalled (EBRD, 2013).
Porras, 2010). Certain policies had a negative impact on equality, including those which decreased social services (Ivanova, 2007) and fostered foreign investment over domestic investment (Bandelj and Mahutga, 2010). A lack of certain policies also negatively impacted equality, such as the lack of an educational policy to encourage adaptability to changing technology (Aghion and Commander, 1999). Beyond policy, some governments were more predisposed to combat rising inequality through higher rates of government effectiveness and more financial resources (Grimalda, Barlow, and Meschi, 2010). Further differences can be explained through the different styles of reform, such as their speed and sequence (Aristei and Perugini, 2012; Ivanova, 2007), initial conditions prior to the transition (Porras, 2010), and different models of capitalism implemented in transition economies (Izyumov and Calxon, 2009).
It is the importance of the issue of income inequality, the increasing dissatisfaction with income inequality, and the array of contributing factors that have led to this study. It is the scope of this study to analyze the different impacts of certain factors on income inequality within low-, middle-, and high-income Central and Eastern European transition economies. This study takes into account four main categories of contributing factors of income inequality: economic, demographic, political, and cultural and environmental. These four categories have
beenădirectlyăbasedăonăKaasa’să(2005)ăextensiveăwork on the subject.
The economic indicators have been divided into two sub-groups; wealth and macroeconomic factors. The wealth indicator in this study is Gross Domestic Product (GDP) per capita. Studies that focus specifically on GDP as a measure of economic wealth have provided ambiguous results. Ogwang (1994) provides a compelling empirical argument for a relationship between income inequality and GDP per capita, finding that both the conditional means and conditional variances of inequality measures follow an inverted U-shape, bolstering the work of Kuznets. Alternatively, Chowdhury (2003) suggests statistical independence between the GDP per capita growth rate and income inequality growth rate. The main conclusion drawn from past work is that more empirical study is necessary (Aghion, Caroli, and Garcia-Penalosa, 1999).
while others show no statistically significant relationship (Gustafsson and Johansson, 1999).
Demographică factorsă lookă ată theă characteristicsă ofă aă country’să
population. This study uses rural population, representing urbanization, and primary school completion rate, representing education. The effect of urbanization on income inequality is not entirely clear. Some studies yield no statistically significant relationship between income inequality and urbanization (Nomiya, 1992; Li, Squire, and Zou, 1998), while others have found a significant, positive relationship between these two variables (Ullman, 1996;
Nielsenă andă Alderson,ă 1997).ă Studiesă onă education,ă theă “powerfulă socială equalizer”ă (Chu, 2000, p. 39), show that the expansion of education is often found to decrease income inequality (Psacharopoulos and Steier, 1988; Chu, 2000). Further, the primary school completion rate itself is specifically shown to decrease income inequality (Dao, 2008). Interestingly, Sylwester (2002a) found that the negative effect of public education expenditures on income inequality is larger in higher income countries.
Politicală factorsă consideră theă government’să roleă ină incomeă inequality.ă
The first indicator is privatization, which is specifically a political factor for transition economies as it relates to the share of the government sector within a country. Empirical studies typically yield a significant positive association between inequality and privatization (Bandelj and Mahutga, 2010; Grimalda et al., 2010). The second political indicator in this study is the level of political rights. In terms of the impact of democratization on income inequality, some studies show a negative relationship (Beitz, 1982; Durham, 1999; Sylwester, 2002b) and others (Nielson and Alderson, 1997) show an insignificant relationship between the two. Within the context of former socialist countries, studies have shown that a Marxist-Leninist indicator has a negative effect on inequality (Nielson and Alderson, 1997), while democracy has a positive effect on inequality (Gradstein and Milanovic, 2004).
Finally, cultural and environmental factors cover characteristics inherent to the country itself. The indicator for this category is corruption, which is shown to be connected to cultural traditions (Kaasa, 2005) as, over time it could become entrenched within a culture to the point where it may be culturally
accepted.ă Itsă prevalenceă ină transitionă economiesă reachedă “endemică levels”ă
4. Data
This study considers thirteen Central and Eastern European transition countries: Belarus, Bulgaria, Czech Republic, Estonia, Hungary, Latvia, Lithuania, Moldova, Poland, Romania, Russia, Slovakia, and Ukraine. The countries are divided into three categories to analyze whether differences in income categories cause differences in the relationship between income inequality and the factors that contribute to income inequality. The categories are low-income (LI), middle-income (MI), and high-income (HI). These
categoriesă areă consistentă withă theă Worldă Bank’să categoriesă ofă lower -middle-income, upper-middle--middle-income, and high -middle-income, respectively, and are based on GNI per capita (World Bank, 2011e). The division of the thirteen countries is outlined in Table 1, listed alphabetically.
Table 1. Division of countries into groups, based on GNI per capita, 2010
Low Income (LI)
$1,006-$3,975 GNI per capita
Middle Income (MI) $3,976-$12, 275 GNI per capita
High Income (HI)
$12,275 GNI per capita or more
Moldova Belarus Czech Republic
Ukraine Bulgaria Estonia
Latvia Hungary
Lithuania Poland Romania Slovakia Russia
Source: World Bank (2011a)
Although the countries are not divided equally between the three categories,ăusingătheăWorldăBank’săcategorizationăsystemăwillăallowătheăresultsă of this study to be placed within a global framework of levels of development. All data is yearly and spans from 1990 to 2006, approximating the first fifteen years of transition. Data prior to 1990 are from the socialist era and thus they may not necessarily be representative of the true economic situation.
The Gini coefficient is used to represent income inequality. A greater value of Gini signifies a higher level of inequality. It is advantageous to use the Gini coefficient as it is frequently used and would allow for this study to be compared with other studies and fit into the larger body of work on the subject. One potential limitation of the Gini coefficients from the World Income Inequality Database is that they are compiled from different sources. The GDP per capita data has been retrieved from the World Bank and uses the midyear population. It is measured in terms of US dollars, as of 2011.
The first demographic factor is rural population as a percentage of the
totalăpopulation,ăwhereă‘ruralăarea’ăisădefinedăbyătheănationalăstatisticalăofficesăofă
“theă differenceă betweenă totală populationă andă urbană population”ă (Worldă Bank,ă
2011h). The second demographic factor is the primary completion rate as a
percentageă ofă theă relevantă ageă groupă fromă theă Worldă Bank’să dataset.ă Ită isă
calculated by dividing the number of students completing the last grade of primary school, minus repeaters, by the total number of children in the country
ofă“officialăgraduationăage”ă(WorldăBank,ă2011g).ă
The private sector share of GDP data represents privatization, one of the political variables in the model. This data has been obtained through the Transition Reports published by the European Bank for Reconstruction and Development (EBRD, 2011). It is important to note that it includes income generated from both formal and informal activities. The Political Rights index created by Freedom
House,ăwhichărunsăonăaăscaleăfromă1ătoă7,ăwithă1ărepresentingă‘mostăfree’,ăisătheă
other political factor in the model. The index is based on survey data that evaluates
threeă categories:ă “electorală process,ă politicală pluralismă andă participation,ă andă
functioningăofăgovernment”ă(FreedomăHouse,ă2011,ăp.ă30).ă
The Control of Corruption index, representing cultural and environmental factors, was created by the World Bank as part of their
WorldwideăGovernanceăIndicator’săproject.ăItăisăanăindicatorăonăaăscale of -2.5 to
2.5ă andă ită representsă “perceptionsă ofă theă extentă toă whichă publică poweră isă
exercised for private gain, including both petty and grand forms of corruption, as
wellă asă ‘capture’ă ofă theă stateă byă elitesă andă privateă interests”ă (Worldă Bank,ă
2011j).
The FDI net inflow, as obtained from World Bank data, is measured in US dollars as of 2011 (World Bank, 2011b). Finally, the inflation is obtained from the World Bank and it is measured as the growth rate of the GDP deflator,
showingă “theă rateă ofă priceă changeă ină theă economyă asă aă whole”ă (Worldă Bank,ă
2011f).
The main potential issue posed by this data set is that, for several of the variables, there are missing data points.
5. Empirical Methodology and Results
5.1. Models
process yielded the following general model that best fits the data, based on a Random Effects model:
Giniit=ăβ1+ăβ2GDPpcit+ăβ3PrivSecit+ăβ4Inflait+ăβ5LIit+ăβ6MIit + uit (1)
where,
Gini = Gini coefficient GDPpc = GDP per capita
PrivSec = private sector share of GDP Infla = inflation, GDP deflator LI = Low Income dummy variable MI = Middle Income dummy variable i = Country
t = Year
As shown, not every category is represented in this model.1 The results are presented in Table 2.
Table 2. General (random effects) model results
Dependent variable: Inequality
Constant 20.69265**
GDPpc – 0.0003401*
PrivSec 0.1561426**
Infla 0.0030872**
LI 11.21757**
MI 6.33274*
Source:author’săestimation
Note: * p < 0.05, ** p < 0.01
5.2. Results
Due to the significance of the dummy variables in the REM, it can be discerned that the income category to which a country belongs does have an impact on income inequality within a country.
On average, holding all independent variables at zero, the Gini coefficient across time and between countries is 20.69265. It is particularly related to the average level of income inequality within HI countries. On its own,
this is a fairly low level of inequality, as the Gini coefficient ranges from most equal to least equal on a scale from 0 to 100 percent.
All else equal, an increase in GDP per capita by one unit across time and between countries results in a decrease in the Gini coefficient by 0.03401 percent. This may seem like a small amount but one must note the size of the GDP per capita in this data set, which ranges from $321.0269725 for Moldova in 1999 to $13,887.30239 for the Czech Republic in 2006.
The results from previous studies regarding the relationship between income inequality and GDP per capita are ambiguous in terms of the effect the latter has on the former, so there were no firm expectations before the regressions were run. This study finds that there is a statistically significant relationship, bolstering the results found by Kuznets (1955) and Ogwang (1994). The difference is that Kuznets and Ogwang looked at non-linear functions, resulting in an inverted-U shaped relationship, while this study found significance in a linear relationship. Further investigation into potential non-linear relationships would be beneficial in the future study of GDP and income inequality, sharing the view of Aghion et al. (1999).
The next independent variable in the model is the private sector share of
GDP,ă measuringă privatizationă asă partă ofă theă ‘politicală factors’ă category.ă Theă
model indicates that increased privatization increases the level of income inequality. This can cause a significant impact on inequality as the private sector share of GDP reached 70 to 80 percent during the 2000s for the majority of the countries in the dataset. An increase in the private sector share of GDP would thus make quite a difference in the level of inequality in a country, especially compared to the very low levels of privatization seen during Communism and at the start of the transition process.
The positive relationship found in this model reinforces the positive relationship between privatization and income inequality found by Bandelj and Mahutga (2010) as well as Grimalda et al. (2010). This positive relationship is found using different variables to represent privatization; Bandelj and Mahutga (2010) considered the size of the private sector while Grimalda et al. (2010) used the Private Share of Value Added. This strengthens the evidence of a positive relationship between privatization and income inequality as it is found across differing variables. A significant relationship between the two is of particular importance as privatization was not a feature of the socialist system (Kaasa, 2005). Its inclusion in the analysis shows the effects of the transition process and specifically the introduction of the market economy system in these countries.
it makes a large difference in the Gini coefficient during years of hyperinflation, such as in Ukraine in 1993 when the growth rate of the GDP deflator reached an annual percentage of 3334.798345 (World Bank, 2011f).
Results from the work of Bulir (2001) and Parker (1996) provide the expectation of a positive relationship between inflation and income inequality, as
shownăinăthisăstudy.ăBulir’sămodelăshowedăaănon-linear relationship between the two, in that a reduction in a high rate of inflation had a larger impact on income inequality than the reduction in a low rate of inflation, while the model in this study yields a linear relationship for this dataset. Herein lies another similarity
betweenă theă interpretationă ofă theă GDPă peră capita’să coefficientă andă inflation’să
coefficient as further study is recommended to analyze different functional forms of relationships between inflation and income inequality. While some past studies, for example Gustafsson and Johansson (1999), show an insignificant relationship for both the fixed effects and the random effects estimates, this study yields a statistically significant relationship in both models.
The final independent variables in this model are the dummy variables: LI and MI. For LI countries, the constant term becomes 31.91022. For MI countries, the constant term is 27.02539. Thus, on average, LI and MI countries have higher levels of income inequality than HI countries, with LI countries more unequal than MI countries. Both of the dummy variables for LI and MI are statistically significant at the 5 percent level, indicating that the income level of
aăcountry,ăbasedăonătheăcategoriesăcreatedăunderătheăWorldăBank’săAtlasăMethod
(World Bank, 2011i),ă doesă haveă ană effectă onă theă country’să levelă ofă incomeă inequality as represented by the Gini coefficient. This finding agrees with the hypothesized result.
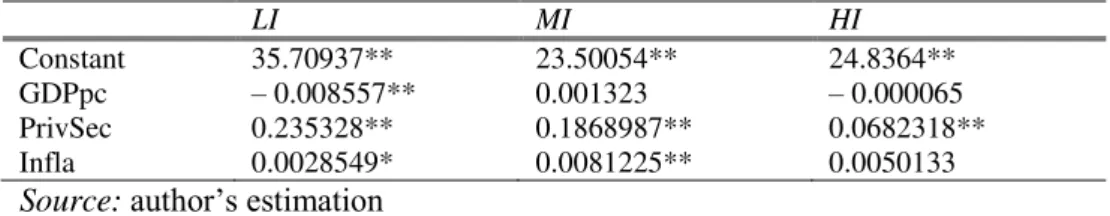
As the results have shown a relationship between the income category and income inequality, the next part of the hypothesis can be tested; different income categories yield different relationships between income inequality and the factors that affect income inequality. This hypothesis was tested by running the same REM model for each income category and analyzing the coefficients in the model. The models show differences in magnitude, the direction of the relationships, and in their significance.
Table 3. Effect on low-income, middle-income, and high-income countries
LI MI HI
Constant 35.70937** 23.50054** 24.8364** GDPpc – 0.008557** 0.001323 – 0.000065 PrivSec 0.235328** 0.1868987** 0.0682318** Infla 0.0028549* 0.0081225** 0.0050133 Source:author’săestimation
It is important to take into account the fact that the number of observations is small, especially for the LI regression as only two countries are included in this group. Thus, the results must be interpreted with caution. Further research would be necessary when data for a larger number of countries or a longer period of time can be included.
The LI model is overall statistically significant at a 5 percent significance level and each coefficient is significant at a 5 percent level as well. All of the signs of the coefficients are the same as in the original model. The coefficient for GDP per capita is larger, so it plays a bigger role for LI countries than for all transition countries studied as a group. The coefficient for the private sector share of GDP is roughly 50 percent larger than the one found in the original model, so privatization plays a bigger role than the average as well. The coefficient for inflation is smaller than in the original model, but only slightly. It is interesting to note that while the LI group only consists of two countries, it is the closest to the original REM in sign and significance levels.
The MI model is also statistically significant at the 5 percent level, as is every coefficient except for the GDP per capita. GDP per capita shows a positive relationship, as opposed to a negative one, but it has an insignificant coefficient. The coefficient for the private sector is similar to the original one, while the effect of inflation is shown to be greater.
Lastly, the HI model is also statistically significant at the 5 percent level, however, neither GDP per capita nor inflation are significant. The effect of the private sector is less than half as large as in the original model, so privatization does not have a strong relationship with income inequality in the HI countries. The results from the HI and MI models show that further research must be done to determine which variables are of significance in terms of influencing income inequality for these two income categories. These differences between income groups show interesting policy implications, in that lower income countries must take different factors into account when attempting to increase equality levels relative to higher income countries.
6. Conclusions
Income inequality in Central and Eastern European transition countries has increased after 1990 when the countries started their economic transition from a centrally planned to a market economy, and political transition from an authoritarian system to a democratic one. The level of income inequality differs across country income categories, as do the relationships between the contributing factors of income inequality and income inequality itself. The importance of this result is that it implies transition economies at different levels of wealth should be analyzed separately when making policy decisions related to income inequality, as the relationships between income inequality and the variables in this study were shown to differ across income categories so policies to decrease the disparity should differ across these categories as well. Policies to decrease inflation would benefit countries in the LI and MI categories, although they would have to take into account relationships between inflation and other variables such as, for example, unemployment. Policies related to privatization would impact inequality for all three income categories and governments would want to search for policies that could support privatization yet mitigate the effect of high levels of privatization on income inequality.
Given the damaging effects of income inequality on a country, including economic inefficiencies and socio-political instability as discussed in Section 2, this study has aimed to provide insights into the factors that impact income inequality so as to better understand the relationships that matter in transition economies. This study has found relationships using a broad range of factors, as opposed to a significant portion of the literature which focuses on only one factor at a time. Future studies would benefit from utilizing different representative variables, different functional forms, and new data as it becomes available. Further research is needed in the field to improve the economic, political, and social situations within transition economies through finding the best policy responses that would result in decreased income inequality.
References
Aghion, P. and Commander, S.J. (1999), On the Dynamics of Inequality in the Transition, Economics of Transition, No. 7, pp. 275-298.
Aghion, P., Caroli, E. and Garcia-Penalosa, C. (1999), Inequality and Economic Growth: The Perspective of the New Growth Theories, Journal of Economic Literature, No. 37, pp. 1615-1660.
Alderson, A. and Nielsen, F. (1999), Income Inequality, Development, and Dependence: A Reconsideration, American Sociological Review, No. 64, pp. 606-631.
Aristei, D. and Perugini, C. (2012), Inequality and Reforms in Transition Countries,
Bandelj, N. and Mahutga, M.C. (2010), How Socio-Economic Changes Shape Income Inequality in Post-Socialist Europe, Social Forces, No. 88, pp. 2133-2161. Beitz, C.R. (1982), Democracy in developing societies, in: Gastil, R. G. (ed.), Freedom
in the World: Political Rights and Civil Liberties, New York: Greenwood Press. Bruno, M., Ravallion, M. and Squire, L. (1998), Equity and Growth in Developing
Countries: Old and New Perspectives on the Policy Issues, in: Tanzi, V. and Chu, K. (eds.), Income Distribution and High-QualityGrowth, Cambridge: MIT Press. Bulir, A. (2001), Income Inequality: Does Inflation Matter?, IMF Staff Papers, No. 48,
pp. 139-159.
Chowdhury, K. (2003), Empirics for World Income Distribution: What does the World Bank Data Reveal?, The Journal of Developing Areas, No. 36, pp. 59-83.
Chu, H. (2000), The Impacts of Educational Expansion and Schooling Inequality on Income Distribution, Quarterly Journal of Business and Economics, No. 39, pp. 39-49.
Dao, M. (2008), Human Capital, Poverty, and Income Distribution in Developing Countries, Journal of Economic Studies, No. 35, pp. 294-303.
Deininger, K. and Squire, L. (1996), A New Data Set Measuring Income Inequality,
World Bank Economic Review, No. 10, pp. 565-591.
Durham, J. (1999), Econometrics of Income Distribution: Toward more Comprehensive Specification of Institutional Correlates, Comparative Economic Studies, No. 41, pp. 43-74.
European Bank for Reconstruction and Development (2011), Transition Report, London. European Bank for Reconstruction and Development (2013), Transition Report, London. Freedom House (2011), Freedom in the World 2011, Washington D.C.
Gradstein, M. and Milanovic, B. (2004), Does Liberté=Egalité? A Survey of the Empirical Links between Democracy and Inequality with Some Evidence on the Transition Economies, Journal of EconomicSurveys, No. 18, pp. 515-537. Grimalda, G., Barlow, D. and Meschi, E. (2010), Varieties of Capitalisms and Varieties
of Performances: Accounting for Inequality in Post-Soviet Union Transition Economies, International Review of AppliedEconomics, No. 24, pp. 379-403. Grosfeld, I. and Senik, C. (2010), The Emerging Aversion to Inequality, Economics of
Transition, No. 18, pp. 1-26.
Gupta, S., Davoodi, H. and Alonso-Terme, R. (2002), Does Corruption Affect Income Inequality and Poverty?, Economics of Governance, No. 3, pp. 23-45.
Gustafsson, B. and Johansson, M. (1999), In Search of Smoking Guns: What Makes Income Inequality Vary over Time in Different Countries?, American SociologicalReview, No. 63, pp. 585-605.
Ivanova, M. (2007), Inequality and Government Policies in Central and Eastern Europe,
East European Quarterly, No. 41, pp. 167-204.
Izyumov, A. and Claxon, T. (2009), Models of Capitalism and Income Distribution in Transition Economies: A Comparative Perspective, Journal of Economic Issues, No. 43, pp. 733-758.
Kaufmann, D. and Siegelbaum, P. (1997), Privatization and Corruption in Transition Economies, Journal of International Affairs, No. 50, pp. 419-458.
Kuznets, S. (1955), Economic Growth and Income Inequality, The American Economic Review, No. 45, pp. 1-28.
Li, H., Squire, L., and Zou, H. (1998), Explaining International and Intertemporal Variations in Income Inequality, Economic Journal, No. 108, pp. 26-43.
Li, H., Xu, L., and Zou, H. (2000), Corruption, Income Distribution, and Growth,
Economics and Politics, No.12, pp. 155-182.
Milanovic, B. (1998), Income, Inequality, and Poverty during the Transition from Planned to Market Economy, Washington: The World Bank Group.
Nielsen, F. and Alderson, A. (1995), Income Inequality, Development, and Dualism: Results from an Unbalanced Cross-National Panel, American Sociological Review, No. 60, pp. 674-701.
Nielsen, F. and Alderson, A. (1997), The Kuznets Curve and the Great U-Turn: Income Inequality in U.S. Counties,ă1970ătoă1990’,ăAmerican Sociological Review, No. 62, pp. 12-33.
Nomiya, D. (1992), On the effects of urbanization on income inequality: A cross national study, Shakaigaku Hyoron/Japanese Sociological Review, No. 43, pp. 16-29.
Ogwang, T. (1994), Economic Development and Income Inequality: A Nonparametric Investigation of Kuznets' U-Curve Hypothesis, Journal of Quantitative Economics, No. 10, pp. 139-153.
Park, K.H. (1996), Income Inequality and Economic Progress: An Empirical Test of the Institutionalist Approach, The American Journal of Economics and Sociology, No. 55, pp. 87- 97.
Parker, S. (1998), Income Inequality and the Business Cycle: A Survey of the Evidence and some New Results, Journal of Post Keynesian Economics, No. 21, pp. 201-225.
Porras, L. (2010), Income Inequality in the Post-Socialist Transition: An Institutional Approach to the Czech, Hungarian and Russian Cases, Revue d'Etudes ComparativesEst-Ouest, No. 41, pp. 69-109.
Psacharopoulos, G. and Steier, F. (1988), Education and the Labor Market in Venezuela, 1975–1984, Economics of Education Review, No. 7, pp. 321-332.
Ravallion, M. (1997), Can High-Inequality Developing Countries Escape Absolute Poverty?, Economics Letters, No. 56, pp. 51-57.
Ravallion, M. (2001), Growth, Inequality and Poverty: Looking beyond Averages,
World Development, No. 29, pp. 1803-1815.
Rudra, N. (2004), Openness, Welfare Spending, and Inequality in the Developing World,
International Studies Quarterly, No. 48, pp. 683-709.
Samanta, S.K. and Heyse, A. (2006), Income Inequality and Economic Growth in Developing Countries: An Empirical Analysis, Indian Journal of Economics and Business, No. 5, pp. 243-254.
Sylwester, K. (2002a), Can Education Expenditures Reduce Income Inequality,
Economics of Education Review, No. 21, pp. 43-52.
Todaro, M.P. and Smith, S.C. (2009), Economic Development, Boston: Pearson Addison Wesley.
Ullman, M. (1996), Urbanization and Income Inequality: Case Study within Brazil, American Sociological Association.
Wood, A. (1997), Openness and Wage Inequality in Developing Countries: The Latin American Challenge to East Asian Conventional Wisdom, The World Bank Economic Review, No. 11, pp. 33-57.
World Bank (2011a), Country and Lending Groups, retrieved from: http://data.worldbank.org/about/countryclassifications/country-and-lending-groups.
World Bank (2011b), Foreign Direct Investment, Net Inflows (BoP, current US$),
retrieved from: http://data.worldbank.org/ indicator/BX.KLT.DINV.CD.WD. World Bank (2011c), GDP per Capita (current US$), retrieved from:
http://data.worldbank.org/ indicator/NY.GDP.PCAP.CD.
World Bank (2011d), GNI per capita, Atlas Method (current US$), retrieved from: http://data. worldbank.org/indicator/NY.GNP.PCAP.CD.
World Bank (2011e), How We Classify Countries, retrieved from: http://data.worldbank.org/ about/country-classifications.
World Bank (2011f), Inflation, GDP Deflator (Annual %), retrieved from: http://data.worldbank.org/ indicator/NY.GDP.DEFL.KD.ZG.
World Bank (2011g), Primary Completion Rate, Total (% of relevant age group), retrieved from: http://data.worldbank.org/indicator/SE.PRM.CMPT.ZS.
World Bank (2011h), Rural Population (% of Total Population), retrieved from: http://data.worldbank.org/indicator/SP.RUR.TOTL.ZS.
World Bank (2011i), World Bank Atlas Method, retrieved from: http://data.worldbank.org/about/ country-classifications/world-bank-atlas-method World Bank (2011j), The Worldwide Governance Indicators (WGI) Project, retrieved