GMDD
4, 419–443, 2011Evaluation of ice and snow content
S. Eikenberg et al.
Title Page
Abstract Introduction
Conclusions References
Tables Figures
◭ ◮
◭ ◮
Back Close
Full Screen / Esc
Printer-friendly Version Interactive Discussion
Discussion
P
a
per
|
Dis
cussion
P
a
per
|
Discussion
P
a
per
|
Discussio
n
P
a
per
Geosci. Model Dev. Discuss., 4, 419–443, 2011 www.geosci-model-dev-discuss.net/4/419/2011/ doi:10.5194/gmdd-4-419-2011
© Author(s) 2011. CC Attribution 3.0 License.
Geoscientific Model Development Discussions
This discussion paper is/has been under review for the journal Geoscientific Model Development (GMD). Please refer to the corresponding final paper in GMD if available.
Evaluation of ice and snow content
in the global numerical weather prediction
model GME with CloudSat
S. Eikenberg1, K. Fr ¨ohlich2, A. Seifert2, S. Crewell1, and M. Mech1
1
Institute of Geophysics and Meteorology, University of Cologne, Cologne, Germany
2
Deutscher Wetterdienst, Offenbach, Germany
Received: 21 January 2011 – Accepted: 2 February 2011 – Published: 25 February 2011 Correspondence to: S. Eikenberg ([email protected])
GMDD
4, 419–443, 2011Evaluation of ice and snow content
S. Eikenberg et al.
Title Page
Abstract Introduction
Conclusions References
Tables Figures
◭ ◮
◭ ◮
Back Close
Full Screen / Esc
Printer-friendly Version Interactive Discussion
Discussion
P
a
per
|
Dis
cussion
P
a
per
|
Discussion
P
a
per
|
Discussio
n
P
a
per
|
Abstract
The present study evaluates the global numerical weather prediction model GME with respect to frozen particles, both ice and snow, focusing on the performance of a di-agnostic versus a prognostic precipitation scheme. As a reference, CloudSat Cloud Profiling Radar observations are utilized – the so far only near-globally available data
5
set which vertically resolves clouds. Both the observation-to-model and the model-to-observation approach are applied and compared to each other. For the latter, the radar simulator QuickBeam is utilized. Criteria are applied to further improve the com-parability between model and observations. The two model versions are statistically evaluated for a four-month period.
10
The comparison reveals that the prognostic scheme reproduces the shape of the CloudSat frequency distributions for both ice water content (IWC) and reflectivity factor well, while the diagnostic scheme produces no large IWCs or reflectivity factors be-cause snow falls out instantaneously. However, the prognostic scheme overestimates the occurrence of high ice water paths (IWP), especially in the mid-latitudes.
Sensi-15
tivity tests show that an increased fall speed of snow successfully reduces IWP. Both approaches capture the general features, but for details, the two together deliver the largest informational content. In case of limited resources, the model-to-observation approach is preferred. Finally, the results indicate that the lack of IWC in most global circulation models might be attributed to the use of diagnostic precipitation schemes,
20
i.e., the lack of snow aloft.
Based on its good performance the prognostic scheme went into operational mode in February 2010. The adjusted snow fall speed went operational in December 2010. However, continual improvements of the ice microphysics are necessary, which can be assessed by the proposed evaluation technique.
GMDD
4, 419–443, 2011Evaluation of ice and snow content
S. Eikenberg et al.
Title Page
Abstract Introduction
Conclusions References
Tables Figures
◭ ◮
◭ ◮
Back Close
Full Screen / Esc
Printer-friendly Version Interactive Discussion
Discussion
P
a
per
|
Dis
cussion
P
a
per
|
Discussion
P
a
per
|
Discussio
n
P
a
per
1 Introduction
Ice clouds have a large impact on the Earth’s climate system due to their effects on the global radiation budget. A good description of ice clouds is therefore a major challenge for both climate and numerical weather prediction (NWP) models. The CloudSat Cloud Profiling Radar (CPR) (Stephens et al., 2002) offers the so far unique opportunity to
5
vertically resolve ice clouds from space – in contrast to the numerous passive satellite-based sensors. Due to its high resolution and the near-global coverage (compared to ground-based radars) it is predestined for the evaluation of global models because it is able to penetrate clouds and to assess the occurrence of multi-level clouds (Mace et al., 2009). CloudSat also has its limitations since it does not determine ice water
con-10
tent (IWC) directly and the observed radar reflectivity factor is weighted towards larger particles. Though smaller ice particles can be detected well by the Cloud Aerosol Lidar and Infrared Pathfinder Satellite Observation (CALIPSO) Cloud-Aerosol Lidar with Or-thogonal Polarization (CALIOP) which flies in formation with CloudSat (Winker et al., 2007), the use of these data is deliberately avoided because of the limitation to
opti-15
cally thin clouds and complications relating the observed backscatter coefficient to IWC. In particular, new aircraft measurements (McFarquhar et al., 2007) indicate that past measurements overestimate small ice particle concentrations by a factor of 2, result-ing in questionable particle size distributions on which all observations, the radar-lidar retrieval included, are based.
20
As shown by Waliser et al. (2009), climate models today vary in annual mean ice water path (IWP) by up to two orders of magnitude and most climate models under-estimate IWP in comparison to CloudSat. A likely explanation for the underestimation is that while CloudSat can not distinguish between cloud ice and snow, precipitating ice is diagnostic in many climate models and therefore does not contribute to IWP.
25
GMDD
4, 419–443, 2011Evaluation of ice and snow content
S. Eikenberg et al.
Title Page
Abstract Introduction
Conclusions References
Tables Figures
◭ ◮
◭ ◮
Back Close
Full Screen / Esc
Printer-friendly Version Interactive Discussion
Discussion
P
a
per
|
Dis
cussion
P
a
per
|
Discussion
P
a
per
|
Discussio
n
P
a
per
|
snow with retrieved total ice (observation-to-model approach) still has limitations due to assumptions in the retrieval, e.g., particle size distribution. For this reason the model-to-observation approach can be used to perform model evaluations in the observation space. With this approach it is also possible to take the detection limit of CloudSat into account, as pointed out by Marchand et al. (2009), who use the QuickBeam
sim-5
ulator to investigate global hydrometeor occurrence as represented by the Multiscale Modeling Framework. Validations of operational global NWP models with CloudSat are rare; Bodas-Salcedo et al. (2008), for example, evaluate the Met Office Unified Model (MetUM) global forecast model at 40 km horizontal resolution using a radar operator. As a result, they identify an inconsistency in the parameterization of ice cloud fraction.
10
In order to support ongoing model development, the present study aims at evaluating the global NWP model of the German Weather Service (Deutscher Wetterdienst, DWD) GME (Majewski et al., 2002), with special focus on the performance of a diagnostic versus a prognostic precipitation scheme. The representation of ice in the two model versions is evaluated with CloudSat CPR data and the individual contributions of cloud
15
ice and snow to the total frozen phase are analysed. The overall goal is to develop a technique with which continuous model evaluation is enabled. For this, the two possible approaches – observation-to-model and model-to-observation – are undertaken and compared.
The structure of the paper is as follows: the GME model and its parameterizations
20
are described in detail in Sect. 2, followed by an overview on the CloudSat data in Sect. 3. In Sect. 4, the methodology applied in this paper is introduced, and the results are discussed in Sect. 5. Finally, summary and conclusions are presented in Sect. 6.
2 GME model
The global NWP model of DWD, GME (Majewski et al., 2002), is a hydrostatic model
25
GMDD
4, 419–443, 2011Evaluation of ice and snow content
S. Eikenberg et al.
Title Page
Abstract Introduction
Conclusions References
Tables Figures
◭ ◮
◭ ◮
Back Close
Full Screen / Esc
Printer-friendly Version Interactive Discussion
Discussion
P
a
per
|
Dis
cussion
P
a
per
|
Discussion
P
a
per
|
Discussio
n
P
a
per
40 hybrid levels in the vertical. Level thickness ranges approximately from 20 m at the Earth’s surface, 500 m in 5 km height, to 750 m in 10 km height. Forecasts are available in hourly resolution, starting at 00:00, 06:00, 12:00, and 18:00 UTC. Operationally, the model is initialized using a three-dimensional variational data assimilation system. Four hydrometeor classes are implemented in the model: cloud ice and water, snow, and
5
rain.
In the operational version of the GME, cloud ice and cloud water are prognostic variables, whereas snow and rain are diagnostic variables.
GME, being the first part of the model chain at DWD, delivers the boundary condi-tions for the regional scale models COSMO-EU (∆x=7 km) and COSMO-DE (∆x= 10
2.8 km). Therefore, efforts are in progress to adjust the parameterizations of GME to those of COSMO-EU. As an experiment (GME1007), a prognostic precipitation scheme, but still without the advection of precipitation, was implemented and run for a four-month period from 1 July 2009 to 31 October 2009. This scheme follows Rut-ledge and Hobbs (1983), Lin et al. (1983), and Doms and Sch ¨attler (2004). It applies
15
a non-equilibrium treatment of the depositional growth of cloud ice and snow (i.e., al-lows supersaturation with respect to ice). For cloud ice a monodisperse size distri-bution is assumed for hexagonal plates with a mass-diameter relation of m=130D3
(withD in m, m in kg) and ice nucleation is parameterized by a simple temperature-dependent diagnostic relation. Snowflakes are aggregates with a mass-diameter
rela-20
tion ofm=0.069D2and a terminal fall velocity ofv=15D0.5(withv in m s−1). Based on measurements by Field et al. (2005), a parameterization of the intercept parameter
N0,s of the exponential snow size distributionf(D)=N0,sexp(−λD) is used, with slope parameterλ. The intercept parameterN0,sis proportional to the number concentration of snow flakes and is described as a function of temperatureT and snow mixing ratio
25
qs:
N0,s=27
2 a(3,T)
−3 qs
0.069
4−3b(3,T)
GMDD
4, 419–443, 2011Evaluation of ice and snow content
S. Eikenberg et al.
Title Page
Abstract Introduction
Conclusions References
Tables Figures
◭ ◮
◭ ◮
Back Close
Full Screen / Esc
Printer-friendly Version Interactive Discussion
Discussion
P
a
per
|
Dis
cussion
P
a
per
|
Discussion
P
a
per
|
Discussio
n
P
a
per
|
The functions a(3,T) and b(3,T) are given in Table 2 of Field et al. (2005). For the autoconversion of cloud ice and the aggregation of cloud ice by snow a temperature dependent sticking efficiency is assumed similar to Lin et al. (1983):
ei(T)=max 0.2,min exp
0.09(T−T0)
,1.0 (2)
with T0=273.15 K. The warm rain part of the scheme applies the
autoconver-5
sion/accretion scheme of Seifert and Beheng (2001) with a constant cloud droplet number concentration ofNc=5×10⁸m−3and a constant shape parameter ν=2. For
details on the scheme see Doms and Sch ¨attler (2004).
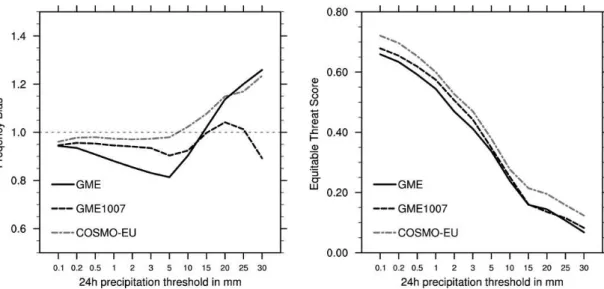
As a first step, routine precipitation verification at the mid-latitudes, where most pre-cipitation is generated via the ice phase, is undertaken. Figure 1 shows an
improve-10
ment in frequency bias (FBI, Eq. 3) for GME1007 relative to GME. For lower thresholds GME1007 is very close to the results of the regional COSMO-EU, which shares the same microphysical scheme. Also in terms of equitable threat score (ETS, Eq. 4), GME1007 shows a clear improvement compared to GME for precipitation events up to 5 mm in 24 h and almost reaches the skill of COSMO-EU. Whether this improvement
15
in terms of surface precipitation is connected with improved representation of ice is investigated in this paper.
FBI=(a+b)·(a+c)−1 (3)
ETS=(a−ar)·(a+b+c−ar)− 1
(4) with hitsa, false alarms b, missesc, and hits expected by chancear=(a+b)·(a+c)· 20
(a+b+c+d)−1
.
3 CloudSat CPR observations
GMDD
4, 419–443, 2011Evaluation of ice and snow content
S. Eikenberg et al.
Title Page
Abstract Introduction
Conclusions References
Tables Figures
◭ ◮
◭ ◮
Back Close
Full Screen / Esc
Printer-friendly Version Interactive Discussion
Discussion
P
a
per
|
Dis
cussion
P
a
per
|
Discussion
P
a
per
|
Discussio
n
P
a
per
the CPR – is a nadir-looking 94 GHz (3.2 mm) radar measuring the backscattering signal of the Earth’s surface and of particles in the atmospheric column as a function of distance. The backscattering signal is calibrated to give the equivalent radar reflectivity factor using the dielectric factor for liquid water and assuming Rayleigh scattering. The equivalent radar reflectivity factorze is then converted to the radar reflectivity factorz 5
to account for solid phase. The CloudSat CPR features a detection limit of −27 dBz
with a dynamic range up to+29 dBz.
Due to the motion of the CloudSat CPR relative to the Earth’s surface, its footprint is approximately 1.4 km (across-track)×1.8 km (along track) (Tanelli et al., 2008). The
data are averaged every 0.16 s along track which corresponds to a horizontal resolution
10
of approximately 1.1 km. Vertically, the CPR’s pulses sample a volume of 480 m and the data are digitized into 125 bins, each of approximately 240 m height.
The determination of ice water content (IWC) fromze is not trivial as it depends on hydrometeor size, shape, and density distribution, with the largest particles being dom-inant. In the present study data from the version 5.1 IWC retrieval (contained in release
15
R04 of the level 2B products) are utilized, which is based on the optimal estimation ap-proach by Rodgers (1976) and assumes a lognormal size distribution. A priori profiles of temperature (provided by European Centre for Medium-Range Weather Forecasts, ECMWF) and reflectivity are used as initial values and help constrain the retrieval. The minimum detectable IWC is estimated to be approximately 0.001 g m−3. Since the
20
radar is not able to determine the cloud phase in a radar profile, both a liquid and an ice retrieval are run, assuming liquid-only and ice-only conditions. Finally, the two profiles are combined, with a linear scaling between−20 and 0◦C. For details on the retrieval
see Austin et al. (2009).
The quality of the radar reflectivity factor measured by the CloudSat CPR and the
25
GMDD
4, 419–443, 2011Evaluation of ice and snow content
S. Eikenberg et al.
Title Page
Abstract Introduction
Conclusions References
Tables Figures
◭ ◮
◭ ◮
Back Close
Full Screen / Esc
Printer-friendly Version Interactive Discussion
Discussion
P
a
per
|
Dis
cussion
P
a
per
|
Discussion
P
a
per
|
Discussio
n
P
a
per
|
2009). Austin et al. (2009) find IWCs above 1 g m−3 not to be trustworthy, however, suitable reference data for IWC validation are still lacking.
Since the CloudSat CPR is not able to distinguish between snow and cloud ice, we apply the following naming convention from now on: ice water content (IWC, referring to the sum of cloud ice and snow), snow water content (SWC), cloud ice water content
5
(CIWC), and analogously for IWP, SWP, and CIWP.
4 Methodology
4.1 Matching
Model output sampling is essential when comparing model with satellite data. Tem-porally, for each CloudSat orbit the model output (of the 00:00 UTC run) closest to the
10
mean time of the CloudSat orbit is chosen. Thus, forecast age varies between 1 and 24 h. Since model resolution is hourly and the duration of a CloudSat orbit is approxi-mately 1.5 h, the maximum time mismatch between model and satellite profile is 1.25 h. To match the spatial domain of model and observation the GME data are horizontally interpolated onto the CloudSat orbital track with the nearest neighbour technique.
Ver-15
tically, as an intermediate choice, both data sets are linearly interpolated onto regular bins with 500 m height each. IWC, SWC, and CIWC are vertically redistributed onto the new bins, with regard to the conservation of IWP. Additionally, a moving average is applied onto the CloudSat CPR data to take the coarser horizontal model resolution into consideration. To account for instrument and retrieval algorithm sensitivities, only
20
data which are firstly within the CloudSat CPR sensitivity range and secondly deemed trustworthy are included in the investigations, i.e.,−26dBz< Z <+29 dBz (no
reflecti-vity factors below−26 dBz due to increased influence of noise) and 0.001 g m−3<IWC
GMDD
4, 419–443, 2011Evaluation of ice and snow content
S. Eikenberg et al.
Title Page
Abstract Introduction
Conclusions References
Tables Figures
◭ ◮
◭ ◮
Back Close
Full Screen / Esc
Printer-friendly Version Interactive Discussion
Discussion
P
a
per
|
Dis
cussion
P
a
per
|
Discussion
P
a
per
|
Discussio
n
P
a
per
4.2 Model-to-observation versus observation-to-model
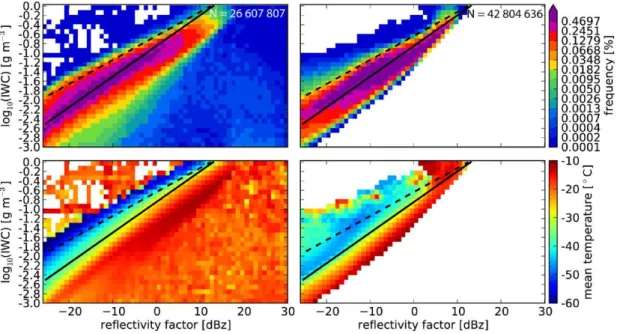
Since the radar reflectivity factor is not a direct model parameter, two principal ap-proaches are undertaken to validate the GME: observation-to-model and model-to-observation. For the first approach the version 5.1 IWC retrieval (cf. Sect. 3) is utilized. For the second approach the radar simulator QuickBeam v1.1a developed by Haynes
5
et al. (2007) is applied, into which a temperature-dependent exponential hydrometeor distribution shape is implemented to match the snow distribution of GME1007. This version of QuickBeam neither accounts for multiple scattering effects, nor does it simu-late the bright band. However, gaseous and hydrometeor attenuation is accounted for and both Rayleigh and Mie scattering are simulated. The fuzziness of the Z-IWC
rela-10
tionships resulting from the two approaches becomes clear in Fig. 2. As a reference, the Z-IWC relationship from Hogan et al. (2006) is included for two temperatures. The slope of the two approaches match well. However, the model relationship is expectedly tighter than the observational relationship, because it contains no noise. With increas-ing temperature (Fig. 2, bottom row) the Z-IWC relationship is shifted towards higher
15
reflectivity factors. Note firstly that the mean bin-temperature of the two Z-IWC relation-ships differs in the region of largest IWC and reflectivity factor values, and secondly that no mean bin-temperatures below –50◦C occur in the model. For CloudSat, the –50◦C Z-IWC relationship of Hogan et al. (2006) lies in a comparable mean bin-temperature range, whereas the –20◦C Z-IWC relationship of Hogan et al. (2006) lies in a colder
20
CloudSat temperature range.
The two approaches have advantages and disadvantages and are therefore both applied in the present study. The observation-to-model approach has the advantage of its easy computation, and the actual model parameters are compared. However, the retrieval can introduce additional uncertainties; three parameters are retrieved out
25
GMDD
4, 419–443, 2011Evaluation of ice and snow content
S. Eikenberg et al.
Title Page
Abstract Introduction
Conclusions References
Tables Figures
◭ ◮
◭ ◮
Back Close
Full Screen / Esc
Printer-friendly Version Interactive Discussion
Discussion
P
a
per
|
Dis
cussion
P
a
per
|
Discussion
P
a
per
|
Discussio
n
P
a
per
|
a false estimation of IWC. The model-to-observation approach to some extent avoids the problem of retrieval uncertainties and is closer to the actual physics by simulating the reflectivity factor the radar would have measured in the presence of a given amount of hydrometeors. However, ice crystals are modelled as soft spheres (Haynes et al., 2007) which Liu (2004) finds to be a questionable approximation for the actual particle
5
habit, in this case of the model. 4.3 Criteria
To improve the comparability of model and observations four criteria are applied for each matching pixel: (1) only temperatures lower than –10◦C to avoid liquid and mixed phase, (2) top of convection below 1 km height to reduce subgrid and mixed phase
ef-10
fects, (3) cloud cover larger than 50% to ensure homogeneous conditions, and (4) total column attenuation not larger than 3 dBz to avoid large particles and the large attenua-tion associated with these. The last criterion is only applied in the model-to-observaattenua-tion approach which offers a better control. Criteria (2) and (3), though diagnosed from model output, are assumed to be true for CloudSat. Depending on the investigated
15
parameter, these four criteria reduce the number of included pixels to approximately 20–25%. Especially concerning the warmer temperature regime, these criteria improve the comparability of model and satellite data distinctly.
5 Results
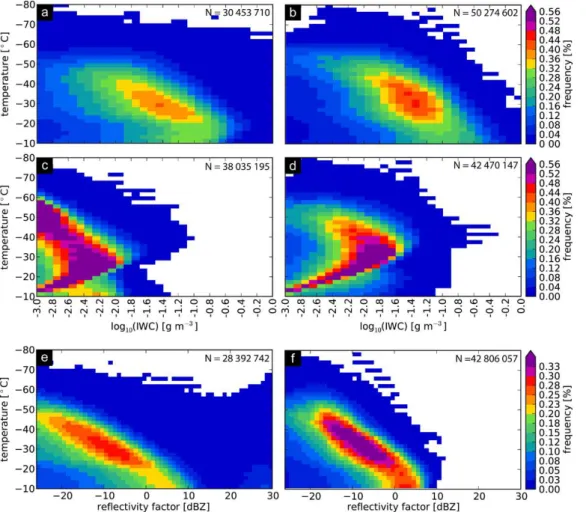
In a first evaluation step global frequency distributions are investigated (Fig. 3). For
20
both CloudSat (Fig. 3a) and GME1007 (Fig. 3b) the occurring IWCs cover the full range of values up to the upper sensitivity threshold of the CloudSat CPR. Contrary, the largest IWCs for GME (Fig. 3c) are merely 0.06 g m−3(−1.2 in log10(IWC)). This is primarily due to the missing snow which – being diagnosed – falls out instantaneously after generation. Note, the diagnostic scheme of GME does assume an equilibrium
GMDD
4, 419–443, 2011Evaluation of ice and snow content
S. Eikenberg et al.
Title Page
Abstract Introduction
Conclusions References
Tables Figures
◭ ◮
◭ ◮
Back Close
Full Screen / Esc
Printer-friendly Version Interactive Discussion
Discussion
P
a
per
|
Dis
cussion
P
a
per
|
Discussion
P
a
per
|
Discussio
n
P
a
per
precipitation profile, enabling the estimation of SWC for that profile. Though this might be the most consistent evaluation of the diagnostic scheme, this route is not pursued because the hydrological cycle of the model can not store mass in this profile. When considering GME1007 CIWC (Fig. 2d) a similiar shape of the frequency distribution as for GME IWC (Fig. 3c), but with a shift towards larger values, is notable. In general,
5
GME1007 (Fig. 3b) captures the enhanced occurrence of smaller IWCs with decreas-ing temperatures which CloudSat (Fig. 3a) features well. However, the observation-to-model approach also reveals a distinct difference between CloudSat and GME1007: the GME1007 maximum of the frequency of occurrence reaches up to lower tempera-ture regimes than for CloudSat, most likely because CloudSat underestimates (misses)
10
thin cirrus which consist of small particles.
The model-to-observation approach (Fig. 3e and f), too, shows how well GME1007 reproduces the frequency distribution of CloudSat. Here, another difference between CloudSat and GME1007 is revealed: The frequency distribution is more narrow for GME1007 than for CloudSat; it spans a smaller reflectivity factor range at a given
15
temperature level, indicating a tighter temperature-reflectivity factor relationship (and therewith tighter temperature-IWC relationship) in the model parameterizations. Also, the slope of the maximum is steeper for GME1007. Contrary to GME1007, GME hardly shows any reflectivity factors above−26 dBz (not shown).
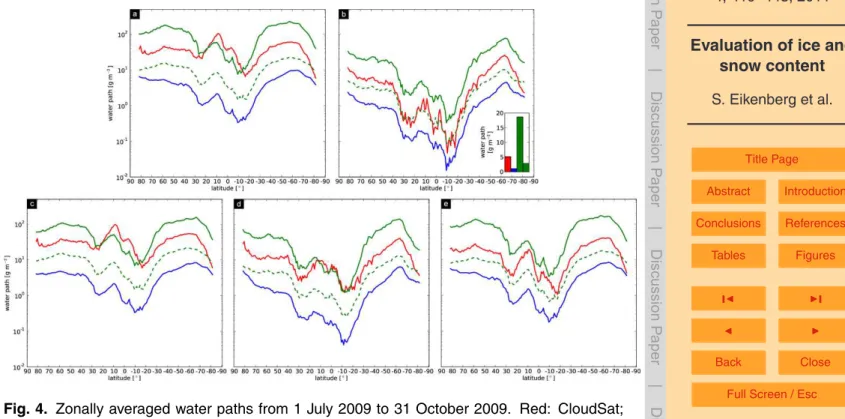
In a next step, analyses are refined to resolve meridional variation in IWP (Fig. 4). At
20
this point it is fit to demonstrate the individual influence of the applied criteria on IWP. The temperature criterion (1) alone (Fig. 4c) slightly reduces the IWP of all data sets at all latitudes, but does not change the general meridional variation in comparison to without any criteria (Fig. 4a). The convection criterion (2) alone (Fig. 4d) reduces IWP distinctly in the tropics, underlining the importance of convectively induced IWC in this
25
GMDD
4, 419–443, 2011Evaluation of ice and snow content
S. Eikenberg et al.
Title Page
Abstract Introduction
Conclusions References
Tables Figures
◭ ◮
◭ ◮
Back Close
Full Screen / Esc
Printer-friendly Version Interactive Discussion
Discussion
P
a
per
|
Dis
cussion
P
a
per
|
Discussion
P
a
per
|
Discussio
n
P
a
per
|
due to the model’s resolution; Subgrid-scale processes are not represented in the hy-drometeor output. When applying all criteria (Fig. 4b), GME1007 realizes the zonally averaged IWP pattern of CloudSat rather well. CIWP in GME1007 is small in compar-ison to its IWP, underlining again the importance of SWP as a contribution to IWP, yet it remains distinctly larger than GME IWP, as shown above. However, GME1007
con-5
sequently overestimates IWP and considerably overestimates mid-latitudinal IWP by a factor of 4. This strong overestimation is not discernible in the frequency distributions shown above, because they are normalized for each data set separately to the number of included pixels. Checks with mass distributions instead of frequency distributions (not shown) confirm the overestimation of IWP in GME1007 as revealed by Fig. 4b.
10
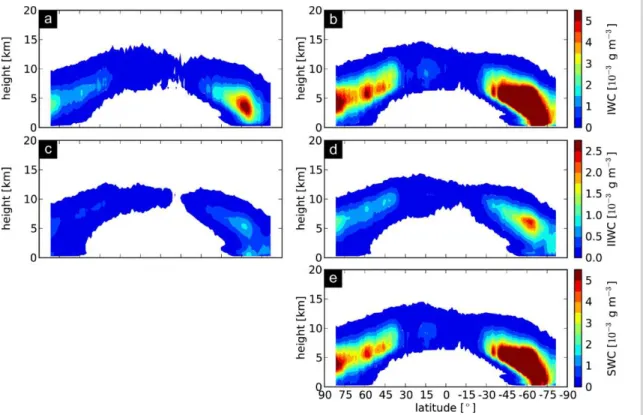
The zonally averaged IWC (Fig. 5) shows that the meridional position of the IWC peaks of CloudSat is captured well by GME1007 (Fig. 5b), though these peaks are positioned at smaller heights in GME1007 than in CloudSat (Fig. 5a). GME IWC and GME1007 CWIC are positioned at exactly the same heights, but the peaks are larger in GME1007 than in GME, which fits to the global frequency distributions in Fig. 3.
15
Further refinement – separation into three temperature regimes for three zonal re-gions – is accomplished to specify the differences in zonally averaged IWP between GME1007 and CloudSat. Contrary to the frequency distributions above, the histograms in Fig. 6 do reflect the above mentioned over-/underestimation of IWC, because they are normalized to the total number of pixels, whether cloudy or not. GME consequently
20
underestimates the higher IWC values, as discussed above. In general, GME1007 reproduces the shape of the distribution of CloudSat very well, especially in the mid-latitudes and polar regions. Also, the peak of maximum frequency of occurrence is located at roughly the same IWC. Yet, the peak is highly overestimated; in the warmest temperature regime by a factor of 3 in the tropics, by a factor of 1.5 in the mid-latitudes,
25
GMDD
4, 419–443, 2011Evaluation of ice and snow content
S. Eikenberg et al.
Title Page
Abstract Introduction
Conclusions References
Tables Figures
◭ ◮
◭ ◮
Back Close
Full Screen / Esc
Printer-friendly Version Interactive Discussion
Discussion
P
a
per
|
Dis
cussion
P
a
per
|
Discussion
P
a
per
|
Discussio
n
P
a
per
not reproduced (or underrepresented) in the tropics in GME1007, partly compensat-ing the overestimation of IWP in this region (Fig. 4). This might be attributed to the fact that deep convective events which produce the largest particles in the tropics are not resolved by the model. Finally, small IWCs are underrepresented in GME1007 in comparison to CloudSat, which might be due to several reasons, e.g., a too fast
5
depositional growth or the missing homogeneous nucleation of aerosols.
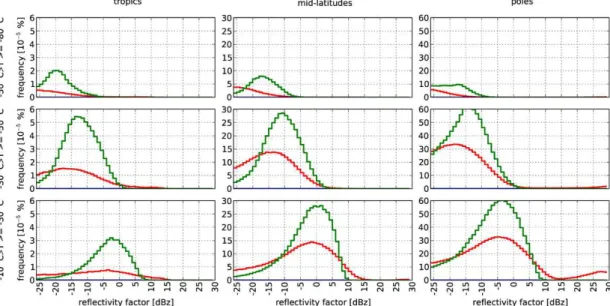
These features are robust, also in reflectivity factor (Fig. 7). Additionally, two further features are discernible. First, with decreasing temperature, the peak of maximum frequency of occurrence of GME1007 shifts more and more to higher reflectivity factors than for CloudSat. Second, the frequency distribution is more narrow for GME1007
10
than for CloudSat. These findings agree with the steeper and more narrow global frequency distribution for GME1007 seen above in Fig. 3. As in Fig. 3, GME produces small reflectivity factors which are outside the displayed range and therewith outside the detection limit of CloudSat. The same applies for GME1007 reflectivity factors calculated from CIWC only.
15
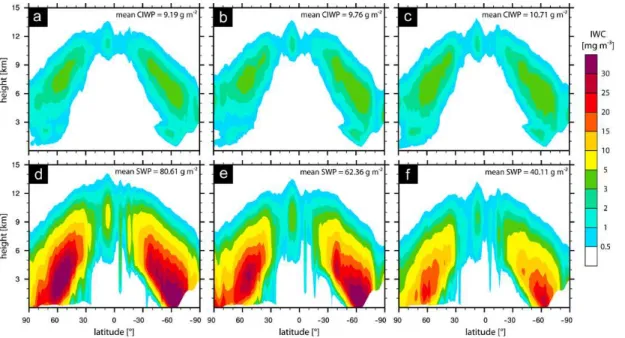
In order to test the hypothesis of a too small fall speed of snow being responsible for the IWC/IWP overestimation, a sensitivity study is conducted (Fig. 8): the same configuration as GME1007 is run as control simulation Exp1. Exp2 takes into account the density correction of the fall speed of precipitating hydrometeors, and Exp3 ad-ditionally applies an increased and more realistic fall speed of snow, compared to a
20
reference fall speed based on Khvorostyanov and Curry (2005), withv=25D0.5. For each experiment a 30-day simulation is performed, and only the last 25 days are ana-lysed to exclude effects of model spin-up. As expected, the faster falling snow leads to a reduction of SWC (Fig. 8) while large-scale surface precipitation is only marginally affected (not shown). Globally averaged, this amounts to a reduction of mean SWP
25
GMDD
4, 419–443, 2011Evaluation of ice and snow content
S. Eikenberg et al.
Title Page
Abstract Introduction
Conclusions References
Tables Figures
◭ ◮
◭ ◮
Back Close
Full Screen / Esc
Printer-friendly Version Interactive Discussion
Discussion
P
a
per
|
Dis
cussion
P
a
per
|
Discussion
P
a
per
|
Discussio
n
P
a
per
|
To explain the remaining IWC bias, we note that a further increase of snow fall speeds might occur in regions of heavy riming or graupel formation, however, both is currently not taken into account for grid-scale clouds in GME. Furthermore, other model errors than cloud microphysics might also contribute to the remaining unexplained IWC bias.
5
6 Summary and conclusions
This study evaluates the global NWP model GME with respect to frozen particles, and in doing so focuses on the performance of a prognostic versus a diagnostic precipitation scheme. As a reference, CloudSat CPR observations are utilized, which offer the so far unique opportunity of vertically resolving clouds at a near-global scale.
10
The prognostic scheme is found to capture the shape and magnitude of the Cloud-Sat CPR frequency distributions of IWC and reflectivity factor well. In contrast, the diagnostic scheme considerably underestimates the larger IWC and reflectivity factor values, a result of the fact that snow falls out instantaneously. As a consequence of the improved overall performance, the prognostic scheme presented here went operational
15
on 2 February 2010.
Furthermore, the height-resolving CloudSat CPR enables the continuous assess-ment of processes within clouds. It is shown that the prognostic scheme still requires improvements, especially concerning the overestimation of IWP. One source of error, the too small fall speed of snow, is identified: With the introduction of a – currently
20
neglected – density-dependency the fall speed increases with height, thereby reduc-ing IWP. Due to this further improvement in performance, the microphysical choices of Exp2 went operational on 1 December 2010.
The presented multi-parameter validation enables the comparison of the two ap-proaches: The general features are robust and captured by both approaches.
How-25
GMDD
4, 419–443, 2011Evaluation of ice and snow content
S. Eikenberg et al.
Title Page
Abstract Introduction
Conclusions References
Tables Figures
◭ ◮
◭ ◮
Back Close
Full Screen / Esc
Printer-friendly Version Interactive Discussion
Discussion
P
a
per
|
Dis
cussion
P
a
per
|
Discussion
P
a
per
|
Discussio
n
P
a
per
approach only, the choice would be the model-to-observation approach, since its un-certainties are easier to assess and it ensures a better control over the comparison, notably through the attenuation criterion. The developed criteria successfully filter out situations the model is not able to capture (e.g., subgrid-scale processes contribut-ing to IWC) and thereby improve the comparability between model and observations
5
distinctly.
Finally, the present evaluation shows that snow is the dominant contributor to IWC and IWP. This finding agrees well with the aircraft measurements of Field et al. (2005), which revealed that snow (aggregates) contributes up to 90% to IWC in frontal clouds. This might help to explain why most climate models, which do not resolve snow and
10
rain explicitly, tend to underestimate IWC (Waliser et al., 2009).
Acknowledgements. The work was funded by the Deutsche Forschungsgemeinschaft under
DFG grant QUEST CR 111/5-3. The authors thank DWD for providing the GME data and the NASA CloudSat project for providing the CloudSat CPR data. The QuickBeam package can be downloaded from http://cloudsat.atmos.colostate.edu/radarsim. The authors thank Helmut
15
Frank and Kerstin Ebell for their contributions and helpful suggestions.
References
Austin, R. T., Heymsfield, A. J., and Stephens, G. L.: Retrieval of ice cloud microphysical parameters using the CloudSat millimeter-wave radar and temperature, J. Geophys. Res., 114, D00A23, doi:10.1029/2008JD010049, 2009. 425, 426, 427
20
Bodas-Salcedo, A., Webb, M. J., Brooks, M. E., Ringer, M. A., Williams, K. D., Mil-ton, S. F., and Wilson, D. R.: Evaluating cloud systems in the MetOffice global fore-cast model using simulated CloudSat radar reflectivities, J. Geophys. Res., 113, D00A13, doi:10.1029/2007JD009620, 2008. 422
Doms, G. and Sch ¨attler, U.: A Description of the Nonhydrostatic Regional Model LM, Part II:
25
Physical Parameterization, Deutscher Wetterdienst, Offenbach, Germany, 2004. 423, 424 Field, P., Hogan, R., Brown, P., Illingworth, A., Choularton, T., and Cotton, R.: Parameterization
GMDD
4, 419–443, 2011Evaluation of ice and snow content
S. Eikenberg et al.
Title Page
Abstract Introduction
Conclusions References
Tables Figures
◭ ◮
◭ ◮
Back Close
Full Screen / Esc
Printer-friendly Version Interactive Discussion
Discussion
P
a
per
|
Dis
cussion
P
a
per
|
Discussion
P
a
per
|
Discussio
n
P
a
per
|
Haynes, J. M., Marchand, R. T., Luo, Z., Bodas-Salcedo, A., and Stephens, G. L.: A Mulitipur-pose Radar Simulator Package: QuickBeam, B. Am. Meteorol. Soc., 88(11), 1723–1727, doi:10.1175/BAMS-88-11-1723, 2007. 427, 428
Hogan, R. J., Mittermaier, M. P., and Illingworth, A. J.: The Retrieval of Ice Water Content from Radar Reflectivity Factor and Temperature and Its Use in Evaluating a Mesoscale Model, J.
5
Appl. Meteorol. Clim., 45, 301–317, 2006. 427, 437
Inoue, T., Satoh, M., Hagihara, Y., Miura, H., and Schmetz, J.: Comparison of high-level clouds represented in a global cloud system-resolving model with CALIPSO/CloudSat and geosta-tionary satellite observations, J. Geophys. Res., 115, D00H22, doi:10.1029/2009JD012371, 2010. 421
10
Khvorostyanov, V. I. and Curry, J. A.: Fall Velocities of Hydrometeors in the Atmosphere: Re-finement to a Continuous Analtytical Power Law, J. Atmos. Sci., 62, 4343–4357, 2005. 431 Lin, Y.-L., Farley, R. D., and Orville, H. D.: Bulk parameterization of the snow field in a cloud
model, J. Clim. Appl. Meteorol., 22, 1065–1092, 1983. 423, 424
Liu, G.: Approximation of Single Scattering Propertis of Ice and Snow Particles for High
Mi-15
crowave Frequencies, J. Atmos. Sci., 61, 2441–2456, 2004. 428
Mace, G. G., Zhang, Q., Vaughan, M., Marchand, R., Stephens, G. L., Trepte, C., and Winker, D.: A description of hydrometeor layer occurencs statistics derived from the first year of merged CloudSat and CALIPSO data, J. Geophys. Res., 114, D00A26, doi:10.1029/2007JD009755, 2009. 421
20
Majewski, D., Liermann, D., Prohl, P., Ritter, B., Buchhold, M., Hanisch, T., Paul, G., Wergen, W., and Baumgardner, J.: The Operational Global Icosahedral-Hexagonal Gridpoint Model GME: Description and High-Resolution Tests, J. Atmos. Sci., 139, 319–338, 2002. 422 Marchand, R., Haynes, J., Mace, G. G., Ackerman, T., and Stephens, G. L.: A
compar-ison of simulated cloud radar output from the multiscale modeling framework global
cli-25
mate model with CloudSat cloud radar observations, J. Geophys. Res., 114, D00A20, doi:10.1029/2008JD009790, 2009. 422
McFarquhar, G. M., Zhang, G., Poellot, M. R., Kok, G. L., McCoy, R., Tooman, T., Friedland, A., and Heymsfield, A. J.: Ice properties of single-layer stratocumuls during the Mixed-Phase Arctic Cloud Experiment, J. Geophys. Res., 112, D24201, doi:10.1029/2007JD008633,
30
GMDD
4, 419–443, 2011Evaluation of ice and snow content
S. Eikenberg et al.
Title Page
Abstract Introduction
Conclusions References
Tables Figures
◭ ◮
◭ ◮
Back Close
Full Screen / Esc
Printer-friendly Version Interactive Discussion
Discussion
P
a
per
|
Dis
cussion
P
a
per
|
Discussion
P
a
per
|
Discussio
n
P
a
per
Protat, A., Bouniol, D., Delano ¨e, J., May, P. T., Plana-Fattori, A., Hasson, A., O’Connor, E., G ¨orsdorf, U., and Heymsfield, A. J.: Assessment of CloudSat Reflectivity Measurements and Ice Cloud Properties Using Ground-Based and Airborne Cloud Radar Observations, J. Atmos. Ocean. Tech., 26, 1717–1741, doi:10.1175/2009JTECHA1246.1, 2009. 425 Rodgers, C. D.: Retrieval of atmospheric temperature and composition from remote
measure-5
ments of thermal radiation, Rev. Geophys., 14, 609–624, doi:10.1029/RG014i004p00609, 1976. 425
Rutledge, S. and Hobbs, P.: The Mesoscale and Microscale Structure and Organization of Clouds and Precipitation in Midlatitude Cyclones. VIII: A. Model for the “Seeder-Feeder” Process in Warm-Frontal Rainbands, J. Atmos. Sci., 40, 1185–1206, 1983. 423
10
Seifert, A. and Beheng, K. D.: A double-moment parameterization for simulating autocon-version, accretion and selfcollection, Atmos. Res., 59–60, 265–281, doi:10.1016/S0169-8095(01)00126-0, 2001. 424
Stephens, G. L., Vane, D. G., Boain, R. J., Mace, G. G., Sassen, K., Wang, Z., Illingworth, A. J., O’Connor, E. J., Rossow, W. B., Durden, S. L., Miller, S. D., Austin, R. T., Benedetti,
15
A., Mitrescu, C., and the CloudSat Science Team: The CloudSat Mission and the A-Train, B. Am. Meteorol. Soc., 83(12), 1771–1790, doi:10.1175/BAMS-83-12-1771, 2002. 421, 424 Tanelli, S., Durden, S. L., Pak, K. S., Reinke, D. G., Partain, P., Haynes, J. M., and Marchand, R. T.: CloudSat’s Cloud Profiling Radar after Two Years in Orbit: Per-formance, Calibration, and Processing, IEEE T. Geosci. Remote, 46(11), 3560–3573,
20
doi:10.1109/TGRS.2008.2002030, 2008. 425
Waliser, D. E., Li, J.-L. F., Woods, C. P., Austin, R. T., Bacmeister, J., Chem, J., Genio, A. D., Jiang, J. H., Kuang, Z., Meng, H., Minnis, P., Platnick, S., Rossow, W. B., Stephens, G. L., Sun-Mack, S., Tompkins, W.-K. T. A. M., Vane, D. G., Walker, C., and Wu, D.: Cloud ice: A climate model challenge with signs and expectations of progress, J. Geophys. Res., 114,
25
D00A21, doi:10.1029/2008JD010015, 2009. 421, 433
GMDD
4, 419–443, 2011Evaluation of ice and snow content
S. Eikenberg et al.
Title Page
Abstract Introduction
Conclusions References
Tables Figures
◭ ◮
◭ ◮
Back Close
Full Screen / Esc
Printer-friendly Version Interactive Discussion
Discussion
P
a
per
|
Dis
cussion
P
a
per
|
Discussion
P
a
per
|
Discussio
n
P
a
per
|
GMDD
4, 419–443, 2011Evaluation of ice and snow content
S. Eikenberg et al.
Title Page
Abstract Introduction
Conclusions References
Tables Figures
◭ ◮
◭ ◮
Back Close
Full Screen / Esc
Printer-friendly Version Interactive Discussion
Discussion
P
a
per
|
Dis
cussion
P
a
per
|
Discussion
P
a
per
|
Discussio
n
P
a
per
Fig. 2.Z-IWC relation for CloudSat (left) and GME1007 (right) from 1 July 2009 to 31 October 2009. Top row: frequency distribution; bottom row: mean bin-temperatures. Frequency distri-butions normalized with number N of included pixels. Black lines: Z-IWC relation from Hogan et al. (2006) forT=−20◦C (solid) andT
GMDD
4, 419–443, 2011Evaluation of ice and snow content
S. Eikenberg et al.
Title Page
Abstract Introduction
Conclusions References
Tables Figures
◭ ◮
◭ ◮
Back Close
Full Screen / Esc
Printer-friendly Version Interactive Discussion
Discussion
P
a
per
|
Dis
cussion
P
a
per
|
Discussion
P
a
per
|
Discussio
n
P
a
per
|
Fig. 3. Frequency distributions from 1 July 2009 to 31 October 2009. (a) CloudSat IWC,
(b)GME1007 IWC, (c) GME IWC,(d) GME1007 CIWC,(e) CloudSat reflectivity factor, and
GMDD
4, 419–443, 2011Evaluation of ice and snow content
S. Eikenberg et al.
Title Page
Abstract Introduction
Conclusions References
Tables Figures
◭ ◮
◭ ◮
Back Close
Full Screen / Esc
Printer-friendly Version Interactive Discussion
Discussion
P
a
per
|
Dis
cussion
P
a
per
|
Discussion
P
a
per
|
Discussio
n
P
a
per
Fig. 4. Zonally averaged water paths from 1 July 2009 to 31 October 2009. Red: CloudSat; blue: GME; green: GME1007. Solid: IWP; dashed: CIWP. (a) No criteria, (b) all criteria,
GMDD
4, 419–443, 2011Evaluation of ice and snow content
S. Eikenberg et al.
Title Page
Abstract Introduction
Conclusions References
Tables Figures
◭ ◮
◭ ◮
Back Close
Full Screen / Esc
Printer-friendly Version Interactive Discussion
Discussion
P
a
per
|
Dis
cussion
P
a
per
|
Discussion
P
a
per
|
Discussio
n
P
a
per
|
GMDD
4, 419–443, 2011Evaluation of ice and snow content
S. Eikenberg et al.
Title Page
Abstract Introduction
Conclusions References
Tables Figures
◭ ◮
◭ ◮
Back Close
Full Screen / Esc
Printer-friendly Version Interactive Discussion
Discussion
P
a
per
|
Dis
cussion
P
a
per
|
Discussion
P
a
per
|
Discussio
n
P
a
per
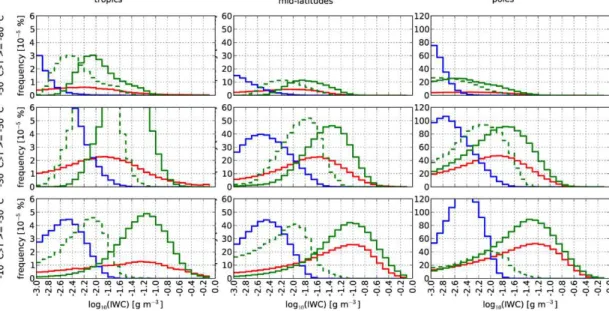
Fig. 6. Histograms of frequency distributions of IWC from 1 July 2009 to 31 October 2009 for three temperature (bottom: from –10 to –30◦C, middle: from –30 to –50◦C, top: from –50 to
–80◦C) and three latitudinal (left: tropics, middle: mid-latitudes, right: polar regions) regimes.
GMDD
4, 419–443, 2011Evaluation of ice and snow content
S. Eikenberg et al.
Title Page
Abstract Introduction
Conclusions References
Tables Figures
◭ ◮
◭ ◮
Back Close
Full Screen / Esc
Printer-friendly Version Interactive Discussion
Discussion
P
a
per
|
Dis
cussion
P
a
per
|
Discussion
P
a
per
|
Discussio
n
P
a
per
|
GMDD
4, 419–443, 2011Evaluation of ice and snow content
S. Eikenberg et al.
Title Page
Abstract Introduction
Conclusions References
Tables Figures
◭ ◮
◭ ◮
Back Close
Full Screen / Esc
Printer-friendly Version Interactive Discussion
Discussion
P
a
per
|
Dis
cussion
P
a
per
|
Discussion
P
a
per
|
Discussio
n
P
a
per