www.atmos-meas-tech.net/10/221/2017/ doi:10.5194/amt-10-221-2017
© Author(s) 2017. CC Attribution 3.0 License.
Observing relationships between lightning and cloud profiles
by means of a satellite-borne cloud radar
Martina Buiat1, Federico Porcù2, and Stefano Dietrich3
1University of Ferrara, Dept. of Physics and Earth Sciences, Ferrara, Italy 2University of Bologna, Dept. of Physics and Astronomy, Bologna, Italy
3Institute of Atmospheric Sciences and Climate (ISAC), National Research Council of Italy (CNR), Rome, Italy
Correspondence to:Federico Porcù (federico.porcu@unibo.it)
Received: 20 April 2016 – Published in Atmos. Meas. Tech. Discuss.: 28 April 2016 Revised: 9 November 2016 – Accepted: 22 December 2016 – Published: 18 January 2017
Abstract.Cloud electrification and related lightning activity in thunderstorms have their origin in the charge separation and resulting distribution of charged iced particles within the cloud. So far, the ice distribution within convective clouds has been investigated mainly by means of ground-based me-teorological radars. In this paper we show how the prod-ucts from Cloud Profiling Radar (CPR) on board CloudSat, a polar satellite of NASA’s Earth System Science Pathfinder (ESSP), can be used to obtain information from space on the vertical distribution of ice particles and ice content and relate them to the lightning activity. The analysis has been carried out, focusing on 12 convective events over Italy that crossed CloudSat overpasses during significant lightning ac-tivity. The CPR products considered here are the vertical profiles of cloud ice water content (IWC) and the effective radius (ER) of ice particles, which are compared with the number of strokes as measured by a ground lightning net-work (LINET). Results show a strong correlation between the number of strokes and the vertical distribution of ice par-ticles as depicted by the 94 GHz CPR products: in particular, cloud upper and middle levels, high IWC content and rela-tively high ER seem to be favourable contributory causes for CG (cloud to ground) stroke occurrence.
1 Introduction
Lightning is an effect of cloud electrification, but there is no consensus in the scientific community on the relative impor-tance of the different mechanisms that cause the charge sep-aration in clouds (MacGorman and Rust, 1998; Sherwood et
al., 2006). However, the importance of cloud microphysical structure, in particular the ice water content, in this process is generally accepted and is confirmed by experimental stud-ies and numerical modelling. Considering the various mech-anisms, the non-inductive ice–ice interaction is the most effi-cient process for cloud electrification (Mansell et al., 2005). This mechanism requires the presence of large ice hydrome-teors (i.e. graupel or hail pellets) that collide with ice crystals in a suspension of supercooled water droplets (Reynolds et al., 1957; Takahashi, 1978; Berdeklis and List, 2001; Adamo et al., 2007). Laboratory studies by Takahashi (1978) and Ja-yaratne et al. (1983) also showed that the charge sign is pos-itive or negative as a function of the cloud temperature and liquid water content (LWC). Further laboratory studies have investigated the impact of cloud conditions on electrification (see Saunders et al., 2006), which also underline the impor-tance of mixing solid and liquid hydrometeors. Observational studies indicate that positive cloud-to-ground (+CG)
gener-ally occur when the wind regimes increase in the storm evo-lution (MacGorman and Burgess, 1994), while the hail por-tion of a storm (Liu et al., 2009) and the tornado sightings in tornadic storms (Carey and Rutledge, 1998) are a couple of examples in which the intensification of the event is coupled with the shift from−CG to+CG (MacGorman and Burgess, 1994).
so-called charging zone, namely the region in which the charge transfer takes place. After collisions between rimed particles and smaller ice particles, the larger particles take one charge while the smaller ice crystals take the opposite charge. Larger particles such as hail and graupel remain suspended in the up-draught and fall out when their terminal velocity exceeds the updraught, while the lighter ice particles are lifted to the up-per regions of the cloud, establishing an electric field within the cloud. This generates the in-cloud electric field distri-bution that initiates lightning when the field exceeds values of 100–250 kV m−1 (Marshall et al., 1995a, b). This is the foundation for numerical models like the 1-D Explicit Mi-crophysics Thunderstorm Model (Solomon and Baker, 1996; Solomon et al., 2005) used to study the relationships be-tween lightning activity and cloud microphysical structure (Formenton et al., 2013).
Since the relationship between lightning and microphysi-cal cloud structure is widely accepted, meteorologimicrophysi-cal radar has frequently been used to investigate thunderclouds. Much research (since Kinzer, 1974) has been devoted to the ob-servation of radar reflectivity and lightning considering the horizontal structure of the thundercloud. Rutledge and Pe-tersen (1994) confirmed with their observations the bipolar model described by Orville et al. (1988): the majority of the negative CG flashes are located in the region of higher radar reflectivity while the positive ones are found in areas of weaker reflectivity, in coincidence with the stratiform rainfall region. Moreover, the number of cloud-to-ground flashes is highly correlated with the vertical radar profile, showing the contribution of the mixed-phase region to the non-inductive charging mechanism. Zipser and Lutz (1994) analysed the vertical profiles of radar reflectivity and the known differ-ences in lightning frequencies for three different regimes (oceanic, monsoon and continental), confirming the relation-ship between the ice water content (IWC) and the effective-ness of charge separation.
More recently, Katsanos et al. (2007) observed the cor-relation between reflectivity and lightning, finding a verti-cal profile with values greater than 53 dBZ in the low lev-els, of≈45 dBZ at 5 km and 40 dBZ at 7 km associated with
an 80 % probability of lightning occurrence. Deierling and Petersen (2008) and Deierling et al. (2008) used a Doppler and dual-polarimetric radar as a source of information of ice distribution and updraughts in clouds, in conjunction with lightning data collected in northern Alabama and Col-orado/Kansas during two field campaigns. They found sig-nificant relationships between the total lightning activity and precipitating and non-precipitating ice mass and estimated fluxes, as well as with updraught volume in the charging zone (i.e. for temperatures colder than−5◦C), and found that
these relationships are relatively invariant between different climate conditions. Roberto et al. (2016) found a marked re-lationship between cloud graupel content by using C-band radar.
Radar reflectivity gradient is also a good indicator for strong updraughts (Zipser and Lutz, 1994; Hondl and Eilts, 1994), which contribute to the creation of opposite charge regions. Some clues in the same direction came also from satellite measurements. Petersen et al. (2005) pointed out that a solid relationship can be found between lightning and cloud ice content. In their study, they used the ice water path (IWP) integrated from cloud top to the−10◦C level, as
ob-tained from the Precipitation Radar (PR) on board the Trop-ical Rainfall Measuring Mission (TRMM) spacecraft (2A25 PR product) to find global relationships between ice water content and lightning activity as observed by the LIS instru-ment on board the TRMM. They found that on a global scale the relationship between columnar precipitation ice mass and lightning flash density is invariant between land, ocean and coastal regimes (in contrast to rainfall).
However, PR uses a frequency (13.8 GHz) that is not op-timal for taking into account the contribution to the IWC due to small ice crystals in the upper cloud portion, which is due to its relatively high sensitivity threshold (17 dBz). This information can instead be provided by the so-called cloud radars, which are active sensors at higher frequency, with much higher sensitivity. Ground-based cloud radars gener-ally provide a limited amount of information about the ice in convective clouds due to the signal attenuation caused by the underlying liquid particles and rain layers. On the con-trary, satellite-based cloud radars like the 94 GHz Cloud Pro-filing Radar (CPR) on CloudSat, and planned on upcoming EarthCARE, have demonstrated their full potential in profil-ing IWC and ER in the upper cloud layers, where attenuation due to small, solid hydrometeors can be assumed negligible (Stephens et al., 2008; Austin et al., 2009).
In this work, we propose a novel approach for studying the relationship between lightning and the vertical distribution of IWC and ER, characterizing the charged cloud regions. We report and discuss the results obtained by selecting 12 con-vective events over Italy. Section 2 describes the CPR prod-ucts used in this study and the LINET sensor data, while in Sect. 3 one storm, optimally observed by CPR, is analysed in detail to extract the cloud structure characteristics favourable to lightning production and to better focus the statistical anal-ysis of the 12 events, described in Sect. 4. In Sect. 5 we sum-marize and discuss the results.
2 Instruments and data 2.1 CloudSat CPR
dif-ferent aspects of the atmosphere. In particular, the objective of CloudSat is to measure, for the first time, the vertical struc-ture of the clouds in order to improve their characterization in global models. The CloudSat instrument is the 94 GHz nadir-pointing CPR, which measures the power backscattered by targets as a function of distance from the radar. The CPR provides 2-D atmospheric slices with a vertical resolution of 240 m, a 1.7×1.4 km footprint, and a sensitivity around −28 dB. The 3 mm wavelength provides sensitivity to light
precipitation and both solid and liquid cloud particles, usu-ally not detected by ground-based low-frequency weather radars (Stephens et al., 2008).
For this study, we used two 2B-level CloudSat products: the cloud geometrical profile (2B-GEOPROF) and the radar-only version of the cloud ice and liquid water content (2B-CWC-RO). The 2B-GEOPROF contains the measured re-flectivity of the vertical column, after a screening performed with the MODIS cloud mask to filter out non-cloudy profiles and a correction for gaseous absorption. The 2B-CWC-RO provides vertical profiles of IWC, LWC and cloud particle effective radius: the retrieval algorithms work on profiles al-ready classified as cloudy and assume log-normal cloud par-ticles size distribution, also using the vertical temperature profile as estimated by ECMWF analysis (Stephens et al., 2008). Other CloudSat products (i.e. 2B-CWC-RVOD and 2C-ICE) use synergies with other space-borne instruments to provide more accurate IWC and ER estimates, but their avail-ability is limited to the 2006–2011 time frame, due to space-craft orbit modifications. We preferred to use nominally less accurate products, but considered a longer time record.
Radiation at 94 GHz is strongly attenuated by the in-teraction with hydrometeors, especially large ice and liq-uid/melting particles. Experimental data reported average two-way attenuation rates of 4.8 dB km−1 for precipitation layers. In low-IWC ice clouds (with Ze< 20 dBZ), the two-way attenuation rate decreases to 0.38 dB km−1, while large ice particles, such as the ones found in the inner layers of convective clouds, are expected to have higher attenuation rates (Li et al., 2001). Other uncertainties originate from multiple scattering (Battaglia et al., 2007) and gaseous ab-sorption (from H2O and O2), and are expected to be signifi-cant below 8 km a.s.l. These sources of uncertainties make it difficult to compare the retrieved microphysical parameters with data from other instruments/algorithms and the defini-tion of the accuracy of the products. Intercomparison studies show discrepancies among parameters retrieved from differ-ent sources, depending on the cloud structure (de Boer et al., 2008; Austin et al., 2009; Protat et al., 2010). The CPR is the preferred instrument to obtain quantitative retrieval of micro-physical parameters in low-IWC clouds, but is also able to provide information on thicker clouds, with expected lower accuracy.
Figure 1.The 10.8 µm METEOSAT SEVIRI image at 01:27 UTC on 13 August 2010 centred on the analysed cloud system. Dashed line indicates the track of CloudSat orbit, A and B indicate the be-ginning and the end of the vertical cross section detailed in Fig. 2.
2.2 Lightning location system data
Lightning strokes acquired by LINET (Betz et al., 2007, 2009) have been used in the study. LINET is a lightning detection network developed at the University of Munich in 2006 and consists of about 130 sensors ensuring a 200– 250 km baseline in 17 European countries (Betz and Meneux, 2014).
Figure 2.Vertical cross section of the CPR reflectivity along the path shown in Fig. 1. In the bottom panel, the number of CG strokes recorded by LINET for each CPR profile are reported.
study of lightning induced chemical processes (Tuck, 1976), and it guarantees an input for the improvement of models which describe convective processes. The algorithm analy-ses a window of 512 µs; i.e. no more than one event can be detected within this time period. Signals of technical origin are discriminated through a fast Fourier analysis (Betz et al., 2007).
3 Method description – the case study occurred on 12–13 August 2010
In this Section we present one of the 12 case studies as an example, to make the reader acquainted with the informa-tion that the instruments and data described in the previ-ous section can provide if optimally observed by CPR. For this purpose, we selected one mesoscale-organized, long-lasting convective system that occurred in northern Italy on the night between 12 and 13 August 2010. The convec-tive episode started in the late afternoon (LT) of 12 August above the western Po Valley and moved eastward in the fol-lowing hours, reaching the maximum development around 23:30 UTC the same day. This event produced a long time record in terms of the number of strokes in northern Italy.
Figure 1 shows the METOSAT-9 10.8 µm image at 01:27 UTC in colour shades, with superimposed (in black) pixels where lightning activity was registered by the LINET network within a 10 min interval centred on the image ac-quisition time. The dashed black line indicates the track of the CloudSat orbit that overpasses the area of interest at 01:29 UTC. The portion of the CloudSat orbit from A to B provided the CPR profiles included in the data set for this case. The case was selected because the orbit is very close to the electrically active portion of the cloud, and because when sampling the anvil region, no strokes were detected by LINET during the specific 10 min interval.
In Fig. 2, the CPR reflectivity is plotted in colour shades along the path shown in Fig. 1, while the bars below indicate
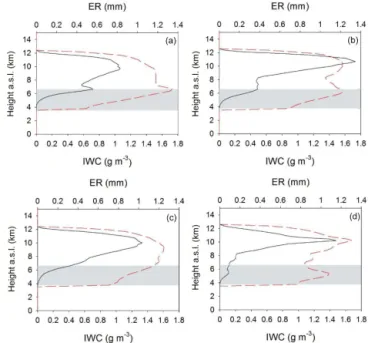
Figure 3.Vertical profiles of IWC (black line, bottom axis) and ER (red line, top axis) for four CPR profiles, namely(a)no. 96 (13 strokes), (b) no. 118 (12 strokes), (c) no. 106, and (d) no. 124 (zero strokes). The grey band indicates the mixed-phase layer, where−20◦<T< 0◦.
the number of CG strokes registered by LINET for each cor-responding CPR profile. For each cloud profile, a neighbour-hood of 1.5 km radius is searched for strokes in the LINET database, within an interval of±5 min around the time of the satellite overpass. The structure of the cloud shows a well-developed anvil stretching to the north and the convective activity to the south. A thick, highly reflective cloud ice layer is present: the top of the cloud reaches 12 km a.s.l., while high ice water content (above 0.8 g m−3, not shown) columns reach 5 km a.s.l. It has to be remarked that the CPR signal could be strongly attenuated by large hydrometeors and thus CPR profiles are expected to not properly describe the lower cloud layers and rain structures.
Lightning activity occurs only on the convective part of the cloud, while no strokes are detected on the anvil or in the growing convective cell at around profile no. 30 along the track. However, there is a relatively large region (be-tween profile no. 98 and profile no. 110) where no strokes are recorded despite the CPR reflectivity showing a thick cloud layer. This suggests that not only is the high ice content a key factor in developing strokes, but also that the vertical dis-tribution of IWC has an impact. Out of the total number of strokes detected (82), only three are positive, and they are de-tected in the area of weakest reflectivity, which corresponds to the stratiform rainfall region, confirming the model de-scribed by Orville (Orville et al., 1988).
Figure 4. (a)IWC vertical profiles with CG strokes;(b)same quan-tity without CG strokes;(c)ER vertical profiles with CG strokes; (d)same quantity without CG strokes.
and without lightning and in the convective part of the cloud. In Fig. 3, the vertical profiles of CPR products IWC and ER are presented in case of lightning detected (top panel) and no lightning detected (bottom panel) within the pro-files. Figure 3a shows the profile no. 96 from the start of the cross section reported in Fig. 2, where the LINET reg-istered 13 strokes, while 12 strokes are reported for the pro-file no. 118, shown in Fig. 3b. For Fig. 3c (propro-file no. 106) and 3d (profile no. 124), still in the active part of the cloud, no strokes are reported. The cloud structures in these four profiles present some similarities: a thick ice layer between 5 and 11 km above the ground with peak concentration larger than 1 g m−3at about 10 km above the ground. The vertical distribution of ice content seems to be more related to the cloud capability of producing strokes: for no lightning cases the ice content decreases monotonically below the concentra-tion peak until it vanishes, reaching the melting layer (esti-mated around 3.7 km a.s.l.). In case of strokes, the IWC struc-ture presents a secondary concentration peak at about 6.5– 7 km a.s.l., at the same height where a peak of ER is present, just above the mixed-phase layer, indicated by the grey band in Fig. 3, suggesting the possible presence of graupel.
For this case, the presence of lightning is favoured by a dense ice layer at the cloud top, where relatively smaller ice particles are present, coupled with a second layer of high IWC, characterized by larger hydrometeors that, given the known structure of thunderstorm, can be identified as large graupel. This structure is coherent with the graupel–crystal charging mechanism.
Figure 5. (a)Fraction of profiles with at least one stroke as a func-tion of the mean IWC of the profile;(b)same quantity distributed according to the maximum value of the IWC along the profile; frac-tion of profiles with at least one stroke(c), and without strokes (d)divided by the total number of profiles according the height of the maximum IWC.
4 Statistical relationship between cloud structure and lightning over Italy
Lucky CloudSat overpasses over storms, like the one de-scribed in the previous section, are not common. This is mainly due to the narrow observation of CPR, coupled with the low Earth-orbiting satellite sampling. However, we at-tempt to extend the statistics by collecting other significant storms over Italy and sufficiently sampled by at least one CloudSat overpass in their core convective structure. We lim-ited our research to five convective seasons starting from 2009, when the LINET sensors network reached the base-line necessary for optimal lightning detection, also in Italy. In this way we found 12 case studies in this period with the necessary characteristics. Each of them was analysed in de-tail, similarly to what shown in the previous section. In the 12 cases, we counted a total of 301 CG strokes assigned to 97 profiles, out of a total of 1701 cloud profiles collected by CPR. We consider this resulting data set quite represen-tative of the variety of profiles that occurred during the Ital-ian storms in the convective season. Given the limitations of the CPR-retrieved quantities discussed in Sect. 2.1, we will present our results with a caution to only consider the numer-ical values valid within a CloudSat analysis, performed with the 2B-CWC-RO data product.
fo-cusing on vertical structures. A clear difference between the classes is evident. Not only is the IWC larger, especially in the upper levels (about 10 km) where lightning is detected, but ER profiles also evidence an overall increase, especially around 5–6 km.
More hints on the profiles statistical properties are illus-trated in Fig. 5. To provide a rough assessment of the proba-bility distribution for the quantities of our interest we adopted the histograms, in which the frequencies of observations oc-curring in certain ranges of values are shown. In Fig. 5a the histogram of mean IWC for cloud profiles with at least one CG stroke is shown (the histograms of profiles without lightning are simply the complement). A vertical mean IWC value of 0.75 g m−3represents a significant threshold to in-crease the probability of CG strokes. However, strokes may also occur for very low mean IWC (below 0.2 g m−3), while, looking at this histogram, the probability of having strokes is 100 % for profiles with mean IWC > 0.85 g m−3, keeping in mind that the significance of the mean value along the pro-file is quantitatively questionable due to the mentioned non-quantifiable effect of attenuation. At some extent, the maxi-mum value of IWC along the profile can be regarded as less affected by attenuation, since the layers above the one with the maximum have lower IWC amounts. The histogram in Fig. 5b shows the statistics of maximum value of the IWC measured along the profiles: a maximum IWC of 1 g m−3 represents the threshold value where the probability of hav-ing CG strokes increases. However, there are profiles with very high maximum IWC, around 2 g m−3without strokes. This is a first signal that the mean and maximum IWC by themselves are not enough to relate the IWC profile to the lightning occurrence. As a matter of fact, the height at which the maximum occur represents an important additional piece of information that we can extract from the data set, exploit-ing the potential of the CPR’s observations. As far as this parameter is concerned, it makes sense to separately plot the histograms describing the statistics of profiles with lightning (5c) and the ones without lightning (5d). Observing those his-tograms, we can recognize two regions in the vertical struc-ture of the storms. The first one can be referred to as the charging zone; it ranges from about 0 to−20◦C, which in
our convective season data set over Italy are the bars at about 5–7.5 km. The other one is located in the upper cloud layers. This latter zone, depending on the specific profile, can be interested by deep convection, hosting large-sized particles or have large IWC contents due to small and light charged ice crystals. Comparing these two histograms, 5c evidences the existence of the two regions better than 5d. Furthermore, the peak values of maximum IWC in the upper cloud re-gion are more frequent (longer bars) in 5c. Overall, the dis-tribution shows that the CG strokes occurrence is favoured in profiles with IWC peak located in the upper cloud layers (68 %). Hence, high IWC values in the upper cloud layers are an important feature of convective profiles and undoubtedly CPR provides information, not easily obtainable from other
Figure 6. (a)Fraction of profiles with at least one stroke as a func-tion of the mean ER of the profile;(b)same fraction as a function of the maximum effective radius in the profile; fraction of profiles with at least one stroke(c), and without strokes(d)divided by the total number of profiles according the height of the maximum ER.
ground or satellite measurements, to recognize the presence of this feature.
The second CloudSat product we analysed in order to char-acterize the cloud profiles is the ER of the ice particles, de-fined as the ratio between third- and second-order moments of the particle size distribution, i.e. the area-weighted mean of the particle radius (Hansen and Travis, 1974). It is worth noting that, when non-spherical ice particles are involved, the particle radius means the radius of the equivalent mass ice sphere. Similarly to what has already been done for IWC, in Fig. 6a and b we show the histograms of mean ER and maximum ER for profiles with at least one CG stroke. A rel-atively high mean value of ER (greater than 0.85 mm) or a high maximum (greater than 1.1 mm) seems to be a neces-sary condition for CG strokes. CPR is not designed to clas-sify hydrometeor types, but large mean or maximum values of ER are compatible with the presence of large ice parti-cles (probably graupel) in a significant part of the cloud pro-file. Histograms 6c and 6d illustrate where the ER maxima are vertically located. As expected, the region in convective storms where we can generally find the maximum of ER is the charging zone, where the charge separation occurs. How-ever, a significant number of profiles, in this case without a clear statistical preference between profile with and without lightning, have their ER maximum in the upper cloud lay-ers, clue of strong updraught in the profiles that makes the presence of suspended large particles possible.
To further investigate the outcomes of Figs. 5 and 6, for each profile we computed the average values of IWC and ER values along the two vertical regions evidenced, hereafter re-ferred to as the “charging zone” (CZ) 0 to−20◦C and
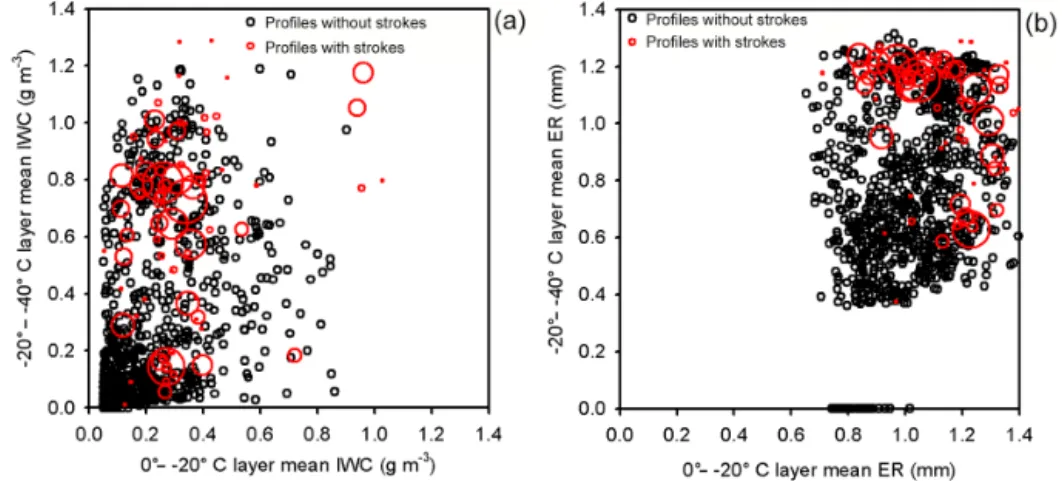
Figure 7.Distribution of profiles with strokes (red circles, with radius proportional to the number of strokes) and without strokes (black circles), with respect to(a)mean IWC in the 0 to−20 and−20 to−40◦C cloud layers, and(b)mean ER in the 0 to−20 and−20 to−40◦C cloud layers.
Figure 8. Distribution of profiles with strokes (red circles, with radius proportional to the number of strokes) and without strokes (black circles), with respect to mean IWC in the−20–40◦C cloud layers (above 9 km) and mean ER in the 0–20◦C. In this case we assume that the profile is entirely composed by ice. The blue line fits the distribution of profiles with strokes.
are the scatter plots of different couples of variables charac-terizing the profiles. Black circles represent profiles without strokes, while profiles with strokes are red circles with the ra-dius proportional to the number of strokes. Lightning is cer-tainly favoured by high IWC in the UC and relatively high IWC in the CZ level, but a number of profiles with lightning are found also in cases of much lower UC IWC, provided that CZ average IWC is above 0.2 g m−3. Very few points with strokes have very high CZ IWC, corresponding to low IWC in UC.
As for the effective radius, it seems that lightning occurs for any value of UC mean ER in the range 0.4–1.2 mm, while
a relatively high value (ER > 0.9 mm) of CZ ER is needed to have lightning.
To fully understand the meaning of the numerical values reported (especially of IWC), it has to be clarified how IWC is computed by 2B-CWC-RO within the melting layer, in-cluding in the CZ layers in our scheme. The IWC is com-puted assuming the entire profile is ice and its value is set to zero in the portion of the profile with temperatures lower than the freezing level, as estimated by ECMWF analysis. Then, in the region between−20 and 0◦, the IWC (where it
is assumed a mixture of ice and liquid) is linearly scaled with temperature, from its value at the levelT = −20◦to zero at
T =0◦. The ER is computed as if the entire profile is ice and
set to zero for the cloud layers belowT =0.
5 Conclusions
12 storms over Italy since 2009. The statistical analysis show that a high mean and maximum IWC content is required to have strokes, possibly with peaks at around 7 km (Katsanos et al., 2007) or 10 km, while large values of profile-averaged ER also favour stroke production, as well as large ice parti-cles just above the mixed-phase cloud layers (ER > 0.9 mm). Despite the difficulties in picking out CloudSat overpasses intersecting active convective cells over Italy, the combined use of CG lightning data and the profiles of IWC and ER pro-vided by the CPR for the data set has substantially confirmed the case study findings concerning the vertical distribution of IWC and ER necessary for lightning. We can resume as follows:
1. Statistically, the IWC UC has demonstrated its impor-tance for describing lightning occurrences. High IWC values can be caused by strong on-going updraughts or the results of long-lasting cumulative effects of small charged ice particles, resulting from collisions that oc-curred in the charging zone and were transported up-ward to build up a usually positive charged layer. In both cases they favour the presence of CG lightning. 2. A well-known necessary condition for CG lightning
oc-currence is the presence of a sensible amount (middle to high IWC) of large particles (high ER values) in the CZ. They form the usually negative CZ layer and their effect on the electric field can be further strengthened for induction by the presence of the UC layer.
3. When the two layers are clearly separated (see Fig. 3b and d), showing two relative maxima, the in-cloud elec-tric field can reach and exceed the high values of 100– 250 kV m−1(Marshall et al., 1995a, b) necessary to gen-erate lightning.
The combined effect of the two layers is evident in Fig. 8, where we chose to connect the UC IWC and the CZ ER in one scatter plot. Apart from a few outliers, the profiles with lightning are distributed around the blue tendency line.
However, the position of the upper cloud layer of charged ice particles with respect to the CZ is also deeply influenced by high-altitude wind regimes, storm rotation, etc. (Stolzen-burg et al., 1998). The CPR observation is composed by ver-tical narrow beams having the effect of slicing the storm. Hence, each beam captures information related only with the microphysics and the electric structure of a part of the whole storm. This is one of the reasons for the observed spreading in the obtained statistics.
Anyway, the best exploitation of CPR data is the single-case analysis. When, like in Sect. 3, one storm has been sam-pled enough in its core convective part, we can more easily recognize the different regions of the storm, make a specific interpretation of the signature of the eventual presence of the double layer and verify the presence of corresponding light-ning activity.
6 Data availability
The CloudSat Standard Data Products used in this work are provided by the CloudSat Data Processing Center and are available after free registration at http://www.cloudsat.cira. colostate.edu/data-products.
LINET data are available from Nowcast GmhB (https: //www.nowcast.de/) after an agreement with the Nowcast GmhB management.
Acknowledgement. CloudSat Standard Data Products are dis-tributed by the CloudSat Data Processing Center, located at the Cooperative Institute for Research in the Atmosphere at Colorado State University in Fort Collins, within the NASA CloudSat Project. LINET data have been provided by Nowcast GmhB (https://www. nowcast.de/) within a scientific agreement between H.-D. Betz and the Satellite Meteorological Group of CNR-ISAC in Rome.
The comments of two anonymous reviewers greatly increased the quality and significance of the paper.
Edited by: G. Vulpiani
Reviewed by: two anonymous referees
References
Adamo, C., Solomon, R., Medaglia, C. M., Dietrich, S., and Mug-nai, A.: Cloud Microphysical Properties from the Remote Sens-ing of LightnSens-ing within the Mediterranean, edited by:: Levizzani, V., Bauer, P., and Turk, J.: Measuring precipitation from space: EURAINSAT and the future, 127–134, Springer, 2007. Austin, R. T., Heymsfield, A. J., and Stephens, G. L.: Retrieval
of ice cloud microphysical parameters using the Cloudsat mm-wave radar and temperature, J. Geophys. Res., 114, D00A23, doi:10.1029/2008JD010049, 2009.
Battaglia, A., Ajewole, M. O., and Simmer, C.: Evaluation of radar multiple scattering effects in Cloudsat configuration, At-mos. Chem. Phys., 7, 1719–1730, doi:10.5194/acp-7-1719-2007, 2007.
Berdeklis, P. and List, R.: The ice crystal-graupel collision charging mechanism of thunderstorm electrification, J. At-mos. Sci.,58, 2751–2770, doi:10.1175/1520-0469(2001)058< 2751:TICGCC”2.0.CO;2, 2001.
Betz, H. D. and Meneux, B.: LINET systems – 10 years experi-ence, Proc. of International Conference on Lightning Protection (ICLP), 1553–1557, doi:10.1109/ICLP.2014.6973377, 2014. Betz, H.-D., Schmidt, K., Fuchs, B., Oettinger, W. P., and Holler,
H.: Cloud lightning: Detection and utilization for total-lightning measured in the VLF/LF regime, J. Lightning Res., 2, 1–17, 2007.
Betz, H.-D., Marshall, T. C., Stolzenburg, M., Schmidt, K., Oet-tinger, W. P., Defer, E., Konarski, J., Laroche P., and Dombai, F.: Detection of in-cloud lightning with VLF/LF and VHF networks for studies of the initial discharge phase, Geophys. Res. Lett., 35, L23802, doi:10.1029/2008GL035820, 2008.
inter-national lightning detection network in Europe, Atmos. Res., 91, 564–573, doi:10.1016/j.atmosres.2008.06.012, 2009.
Carey, L. D. S. and Rutledge, A.: Electrical and multiparameter radar observations of a severe hailstorm, J. Geophys. Res., 103, 13979–14000, doi:10.1029/97JD02626, 1998.
Casella, D., Dietrich, S., Di Paola, F., Formenton, M., Mugnai, A., Porcù, F., and Sanò, P.: PM-GCD – a combined IR-MW satellite technique for frequent retrieval of heavy precipitation, Nat. Haz-ards Earth Syst. Sci., 12, 231–240, doi:10.5194/nhess-12-231-2012, 2012.
de Boer, G., Tripoli, G. J., and Eloranta, E. W.: Preliminary compar-ison of CloudSAT-derived microphysical quantities with ground-based measurements for mixed-phase cloud research in the Arc-tic, J. Geophys. Res., 113, D00A06, doi:10.1029/2008JD010029, 2008.
Deierling, W. and Petersen, W. A.: Total lightning activity as an in-dicator of updraft characteristics, J. Geophys. Res., 113, D16210, doi:10.1029/2007JD009598, 2008.
Deierling, W., Petersen, W. A., Latham, J., Ellis, S., and Chris-tian, H.: The relationship between lightning activity and ice fluxes in thunderstorms, J. Geophys. Res., 113, D15210, doi:10.1029/2007JD009700, 2007.
Formenton, M., Panegrossi, G., Casella, D., Dietrich, S., Mugnai, A., Sanò, P., Di Paola, F., Betz, H.-D., Price, C., and Yair, Y.: Using a cloud electrification model to study relationships be-tween lightning activity and cloud microphysical structure, Nat. Hazards Earth Syst. Sci., 13, 1085–1104, doi:10.5194/nhess-13-1085-2013, 2013.
Hansen, J. E and Travis, L. D.: Light scattering in plan-etary atmospheres, Space Sci. Rev., 16, 527–610, doi:10.1007/BF00168069, 1974.
Hondl, K. D. and Eilts, M. D.: Doppler radar signatures of devel-oping thunderstorms and their potential to indicate the onset of cloud-to-ground lightning, Mon. Weather Rev., 122, 1818–1836, doi:10.1175/1520-0493(1994)122< 1818:DRSODT> 2.0.CO;2, 1994.
Jayaratne, E. R., Saunders, C. P. R., and Hallett, J.: Labora-tory studies of the charging of soft hail during ice crys-tal interactions, Q. J. Roy. Meteorol. Soc., 109, 609–630, doi:10.1002/qj.49710946111, 1983.
Katsanos, D. K., Lagouvardos, K., Kotroni, V., and Argiriou, A. A.: The relationship of lightning activity with microwave bright-ness temperature and spaceborne radar reflectivity profiles in the central and eastern Mediterranean, J. Appl. Meteorol. Clim., 46, 1901–1912, doi:10.1175/2007JAMC1454.1, 2007.
Kinzer, G. D.: Cloud-to-ground lightning versus radar reflectiv-ity in Oklahoma thunderstorms, J. Atmos. Sci., 31, 787–799, doi:10.1175/1520-0469(1974)031< 0787:CTGLVR> 2.0.CO;2, 1974.
Lagouvardos, K., Kotroni, V., Betz, H.-D., and Schmidt, K.: A com-parison of lightning data provided by ZEUS and LINET net-works over Western Europe, Nat. Hazards Earth Syst. Sci., 9, 1713–1717, doi:10.5194/nhess-9-1713-2009, 2009.
Li, L., Sekelski, S. M., Reising, S. C., Swift, C. T., Durden S. L., Sadowy, G. A., Dinardo, S. J., Li, F. K., Huffmann, A., Stephens, G., Babb, D. B., and Rosenberger, H. W.: Retrieval of Atmo-spheric Attenuation Using Combined Ground-Based and Air-borne 95-GHz Cloud Radar Measurements, J. Atmos. Ocean. Tech., 18, 1345–1353, 2001.
Liu, D., Feng, G., and Wu, S.: The characteristics of cloud-to-ground lightning activity in hailstorms over northern China, Atmos. Res., 91, 459–465, doi:10.1016/j.atmosres.2008.06.016, 2009.
Loboda, M., Betz, H.-D., Baransky, P., Wiszniowski, J., and Dziewit, Z.: New Lightning Detection Networks in Poland – LINET and LLDN, Atmos. Sci. J., 3, 29–38, 2009.
MacGorman, D. R. and Burgess, D. W.: Positive cloud-to-ground lightning in tornadic storms and hailstorms, Mon. Weather Rev., 122, 1671–1697, doi:10.1175/1520-0493(1994)122< 1671:PCT-GLI> 2.0.CO;2, 1994.
MacGorman, D. R. and Rust, W. D.: The electrical nature of storms, Oxford University Press, 1998.
Mansell, E. R., MacGorman, D. R., Ziegler, C. L., and Straka, J. M.: Charge structure and lightning sensitivity in a simu-lated multicell thunderstorm, J. Geophys. Res., 110, D12101, doi:10.1029/2004JD005287, 2005.
Marshall, T. C., McCarthy, M., and Rust, W. D.: Electric field mag-nitudes and lightning initiation in thunderstorms, J. Geophys. Res., 100, 7097–7103, doi:10.1029/95JD00020, 1995a. Marshall, T. C., Rust, W. D., and Stolzenburg, M.:
Elec-tric structure and updraft speeds in thunderstorms over the Southern Great Plains, J. Geophys. Res., 100, 1001–1015, doi:10.1029/94JD02607, 1995b.
Nag, A. and Rakov, V. A.: Pulse trains that are characteristic of preliminary breakdown in cloud-to-ground lightning but are not followed by return stroke pulses, J. Geophys. Res., 113, D01102, doi:10.1029/2007JD008489, 2007.
Orville, R. E., Henderson, R. W., and Bosart, L. F.: Bipole patterns revealed by lightning locations in mesoscale storm systems, Geo-phys. Res. Lett., 15, 129–132, doi:10.1029/GL015i002p00129, 1988.
Petersen, W. A., Christian, H. J., and Rutledge, S. A.: TRMM observations of the global relationship between ice water content and lightning, Geophys. Res. Lett., 32, L14819, doi:10.1029/2005GL023236, 2005.
Protat, A., Delanoë, J., O’Connor, E. J., and L’Ecuyer, T. S.: The Evaluation of CloudSat and CALIPSO Ice Microphysical Prod-ucts Using Ground-Based Cloud Radar and Lidar Observations, J. Atmos. Ocean. Tech., 27, 793–810, 2010.
Reynolds, S. E., Brook, M., and Gourley, M. F.: Thunderstorm charge separation, J. Meteorol., 14, 426–436, 1957.
Roberto, N., Adirosi, E., Baldini, L., Casella, D., Dietrich, S., Gatlin, P., Panegrossi, G., Petracca, M., Sanò, P., and Tokay, A.: Multi-sensor analysis of convective activity in central Italy during the HyMeX SOP 1.1, Atmos. Meas. Tech., 9, 535–552, doi:10.5194/amt-9-535-2016, 2016.
Rutledge, S. A. and Petersen, W. A.: Vertical radar reflectivity struc-ture and cloud-to-ground lightning in the stratiform region of MCS’s: Further evidence for in-situ charging in the stratiform region, Mon. Weather Rev., 122, 1760–1776, doi:10.1175/1520-0493(1994)122< 1760:VRRSAC> 2.0.CO;2, 1994.
Sherwood, S. C., Phillips, V. T. J., and Wettlaufer, J. S.: Small ice crystals and the climatology of lightning, Geophys. Res. Lett., 33, L05804, doi:10.1029/2005GL025242, 2006.
Solomon, R. and Baker, M.: A one-dimensional lightning parameterization, J. Geophys. Res., 101, 14983–14990, doi:10.1029/96JD00941, 1996.
Solomon, R., Medaglia, C. M., Adamo, C., Dietrich, S., Mugnai, A., and Biader, U.: An Explicit Microphysics Thunderstorm Model, Int. J. Modell. Simul., 25, 112–118, 2005.
Stephens, G. L., Vane, D. G., Boain, R. J., Mace, G. G., Sassen, K., Wang, Z., Illingworth, A. J., O’Connor, E. J., Rosasaow, W. B., Durden, S. L., Miller, S. D., Austin, R. T., Benedetti, A., and Mitrescu, C.: The Cloudsat mission and the A-Train. A new di-mension of space-based observation of clouds and precipitation, B. Am. Meteorol. Soc., 1771–1790, doi:10.1175/BAMS-83-12-1771, 2002.
Stephens, G. L.,Vane, D. G., Tanelli, S., Im, E., Durden, S., Rokey, M., Reinke, D., Partain, P., Mace, G. G., Austin, R., L’Ecuyer, T., Haynes, J., Lebsock, M., Suzuki, K., Waliser, D., Wu, D., Kay, J., Gettelman, A., Wang, Z., and Marchand, R.: CloudSat mission: Performance and early science after the first year of operation, J. Geophys. Res., 113, D00A18, doi:10.1029/2008JD009982, 2008.
Stolzenburg, M., Rust, W. D., and Marshall, T. C.: Electrical struc-ture in thunderstorm convective regions, J. Geophys. Res, 104, 14097–14108, doi:10.1029/97JD03547, 1998.
Takahashi, T.: Riming electrification as a charge generation mechanism in thunderstorms, J. Atmos. Sci., 35, 1536–1548, doi:10.1175/1520-0469(1978)035< 1536:REAACG> 2.0.CO;2, 1978.
Tuck, A. F.: Production of nitrogen oxides by lightning discharges, Q. J. Roy. Meteorol. Soc., 102, 749–755, doi:10.1002/qj.49710243404, 1976.