This content has been downloaded from IOPscience. Please scroll down to see the full text.
Download details:
IP Address: 186.217.236.157
This content was downloaded on 08/04/2015 at 20:33
Please note that terms and conditions apply.
View the table of contents for this issue, or go to the journal homepage for more
Automatic classification of prostate stromal tissue in
histological images using Haralick descriptors and
Local Binary Patterns
D L L Oliveira1
, M Z Nascimento2
, L A Neves3
, V R Batista1
, M F
Godoy4, R S Jacomini5, Y A S Duarte1, P F F Arruda6 and D S
Neto7
1
Mathematics, Computer Science and Cognition Centre, Federal University of ABC (UFABC), Santo Andr´e, SP, Brazil.
2
Faculty of Computer Science (FACOM), Federal University of Uberlˆandia (UFU), Uberlˆandia, MG, Brazil.
3
Institute of Biosciences, Literature and Exact Sciences, Department of Computer Science and Statistics, S˜ao Paulo State University (UNESP), S˜ao Jos´e do Rio Preto, SP, Brazil. 4
Interdisciplinary Center for the Study of Chaos and Complexity (NUTTECC), Faculty of Medicine of S˜ao Jos´e do Rio Preto (FAMERP), S˜ao Jos´e do Rio Preto, SP, Brazil.
5
Faculdade de Tecnologia Termomecnica, Centro Educacional Funda¸c˜ao Salvador Arena, S˜ao Bernardo, SP, Brazil.
6
Surgery Department of Renal Transplantation, Regional Medical Faculty Foundation (FUNFARME), S˜ao Jos´e do Rio Preto, SP, Brazil.
7
Department of Pathology of Base Hospital, Regional Medical Faculty Foundation (FUNFARME), S˜ao Jos´e do Rio Preto, SP, Brazil.
E-mail: [email protected]
Abstract. In this paper we presente a classification system that uses a combination of texture features from stromal regions: Haralick features and Local Binary Patterns (LBP) in wavelet domain. The system has five steps for classification of the tissues. First, the stromal regions were detected and extracted using segmentation techniques based on thresholding and RGB colour space. Second, the Wavelet decomposition was applied in the extracted regions to obtain the Wavelet coefficients. Third, the Haralick and LBP features were extracted from the coefficients. Fourth, relevant features were selected using the ANOVA statistical method. The classication (fifth step) was performed with Radial Basis Function (RBF) networks. The system was tested in 105 prostate images, which were divided into three groups of 35 images: normal, hyperplastic and cancerous. The system performance was evaluated using the area under the ROC curve and resulted in 0.98 for normal versus cancer, 0.95 for hyperplasia versus cancer and 0.96 for normal versus hyperplasia. Our results suggest that texture features can be used as discriminators for stromal tissues prostate images. Furthermore, the system was effective to classify prostate images, specially the hyperplastic class which is the most difficult type in diagnosis and prognosis.
1. Introduction
Computer-aided diagnosis (CAD) has been developed and can produce consistent results for the detection of diseases. Several CAD systems have been proposed for the analysis of prostate histological images [1, 2]. However, none of these methods used stromal tissue regions in their analysis, and they only considered two classes of tissue: cancerous and normal.
In contrast with these approaches, in this paper we propose a classification method of prostate images using regions of interest (ROI) of the stromal tissue. The method was based on Wavelet decomposition [3], combinations of Haralick descriptors [4], Local Binary Patterns (LBP) [5], ANOVA statistical method and Radial Basis Function (RBF). The method has been evaluated considering histological images of cancer, hyperplastic and normal classes.
2. Materials and methods
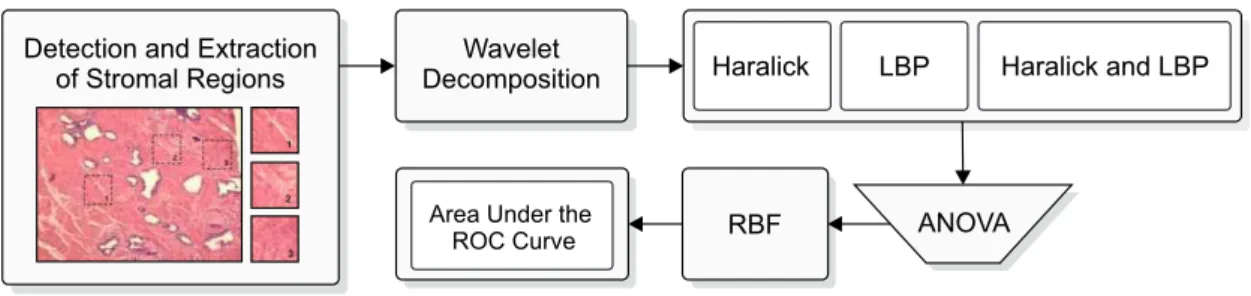
The method was organized in five steps: (1) detection and definition of stromal regions, (2) calculation of Wavelet coefficients, (3) extraction of Haralick and LBP features, (4) aplication of ANOVA statistical method and (5) classification of images using Radial Basis Function (RBF) networks. Fig. 1 shows the flowchart of the method.
Detection and Extraction of Stromal Regions
Wavelet
Decomposition Haralick LBP Haralick and LBP
ANOVA RBF
Area Under the ROC Curve
Figure 1: Flowchart of the proposed classification system.
2.1. Image bank
The image bank used in our study consists of histological slides from the prostates of 35 patients from 50 to 75 years old (mean age: 64.4 ±5.9 years). The patients were treated at the Urology Service of the Base Hospital in S˜ao Jos´e do Rio Preto, state of S˜ao Paulo, Brazil, between 2007 and 2008. This study was approved by the Human Research Ethics Committee of the S˜ao Jos´e do Rio Preto School of Medicine (Brazil). The sample consists of 105 images, which were divided into three groups of 35 images: normal, hyperplastic and cancerous.
2.2. Detection and extraction of stromal regions
Stromal regions were segmented by removing cuboidal cells and glandular lumens areas in the image. These regions were segmented using methods described by Oliveira et al. [6] and [7], which render two binary images Incc and Ilg. The stromal regions were segmented by the
equationIest(x, y) =¬(Incc(x, y)|Ilg(x, y)), where the value of each pixel in the imageIestin the
coordinates x and y was computed by logic operations using the binary images Incc and Ilg.
2.3. Calculation of wavelet coefficients
A multiscale approach allows image data analysis considering different resolutions. One of the techniques used to achieve the multiresolution representation is the Wavelet Transform (WT). In this technique the spatial domain is transformed into frequency and time domains by the formula
W f(a, b) =
∞
Z
−∞
f(t)ψa,b(t)dt. (1)
In Eq. 1W f(a, b) is the the inner product of a signalf(t) with a Wavelet function ψ scaled and translated in the time axis. Namely,ais the scale (dilation) andbis the translation (shift in time) of the Wavelet ψa,b(t) =
1
√aψ(x−ab). The process of obtaining the wavelet coefficients was
performed by Wavelet Daubechies 8 with 3 levels of decomposition. The application generated 4 sub-images of wavelet coefficients at each level.
2.4. Extraction of Haralick and LBP features
Haralick descriptors [4] are second-order statistical measures obtained by calculating the co-occurrence matrices. The matrices are constructed for each sub-image with N Wavelets coefficients. The corresponding descriptors were extracted with angles θ (0◦, 45◦, 90◦ and
135◦) and distance d = 1. The Local Binary Patterns (LBP) operator proved to be robust
at extracting image textures [5]. The operator assigned a label to each pixel of an image by thresholding the 3×3 neighbourhood of each pixel with the centre pixel value and giving the result as a binary number. LBP encode the gray-scale pattern of N neighbouring pixels.
2.5. Dimensionality reduction and classification
To increase the performance of the classifier, the ANOVA statistical method was applied to reduce the vector of features [8]. Afterwards, the RBF classifier was applied. This classifier consists of a multilayer neural model that is able to learn complex pattern and solve non-linearly separable problems. The cross-validation technique was used in the training and validation steps.
3. Results and discussion
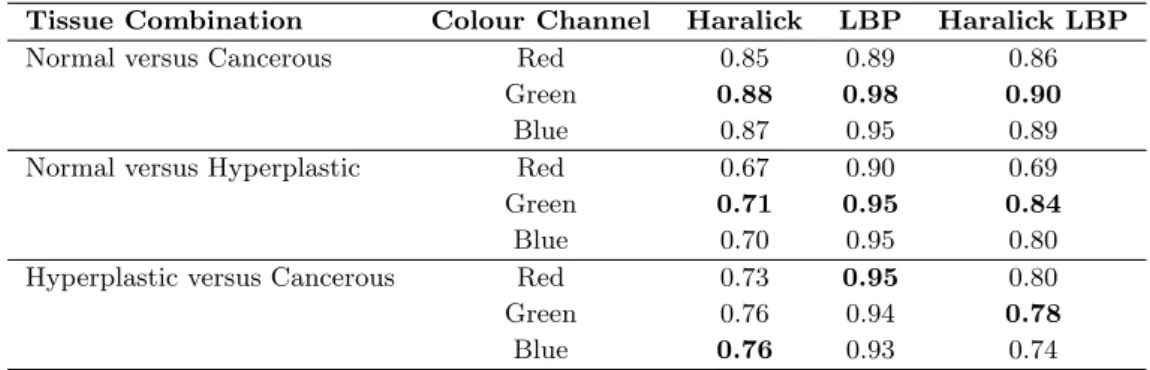
The AUC results for the vectors constructed with Haralick, Haralick LBP and LBP are presented in Table 1, considering each combination of tissue class and RGB colour hues.
Table 1: AUC results for tissue combinations and colour channels using Haralick, LBP and Haralick LBP.
Tissue Combination Colour Channel Haralick LBP Haralick LBP
Normal versus Cancerous Red 0.85 0.89 0.86
Green 0.88 0.98 0.90
Blue 0.87 0.95 0.89
Normal versus Hyperplastic Red 0.67 0.90 0.69
Green 0.71 0.95 0.84
Blue 0.70 0.95 0.80
Hyperplastic versus Cancerous Red 0.73 0.95 0.80
Green 0.76 0.94 0.78
Blue 0.76 0.93 0.74
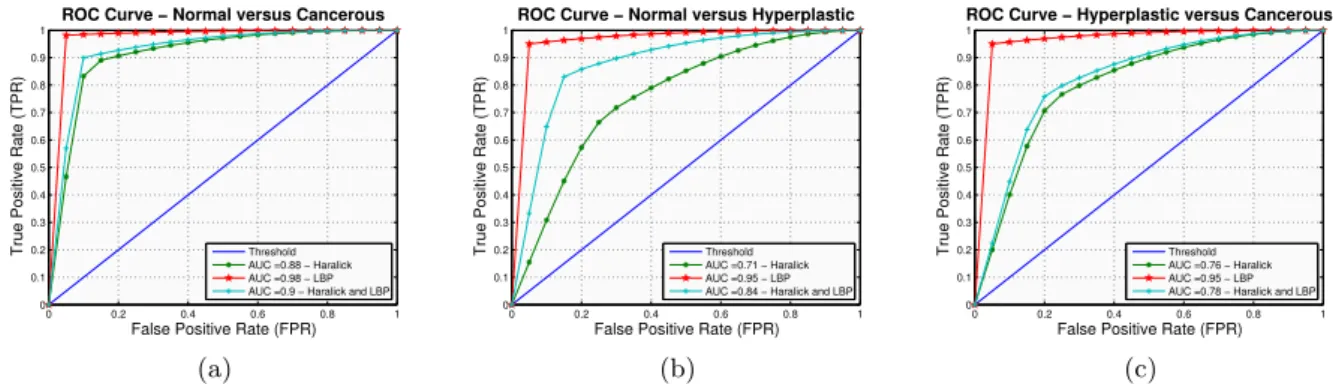
The ROC curves of the best AUC results for the combinations of classes Normal versus Cancerous, Normal versus Hyperplastic and Hyperplastic versus Cancerous are shown in Fig. 2 (a), Fig. 2 (b) and Fig. 2 (c), respectively.
0 0.2 0.4 0.6 0.8 1 0 0.1 0.2 0.3 0.4 0.5 0.6 0.7 0.8 0.9 1
ROC Curve − Normal versus Cancerous
False Positive Rate (FPR)
True Positive Rate (TPR) Threshold AUC =0.88 − Haralick AUC =0.98 − LBP AUC =0.9 − Haralick and LBP
(a)
0 0.2 0.4 0.6 0.8 1 0 0.1 0.2 0.3 0.4 0.5 0.6 0.7 0.8 0.9 1
ROC Curve − Normal versus Hyperplastic
False Positive Rate (FPR)
True Positive Rate (TPR) Threshold AUC =0.71 − Haralick AUC =0.95 − LBP AUC =0.84 − Haralick and LBP
(b)
0 0.2 0.4 0.6 0.8 1 0 0.1 0.2 0.3 0.4 0.5 0.6 0.7 0.8 0.9 1
ROC Curve − Hyperplastic versus Cancerous
False Positive Rate (FPR)
True Positive Rate (TPR) Threshold AUC =0.76 − Haralick AUC =0.95 − LBP AUC =0.78 − Haralick and LBP
(c)
Figure 2: ROC curves for combinations of Normal versus Cancerous (a), Normal versus Hyperplastic (b) and Hyperplastic versus Cancerous (c).
Normal versus Hyperplastic and Hyperplastic versus Cancerous classes the best results were: 0.95 and 0.95 of AUC, respectively. These results suggest that textural features from the stromal tissue are sufficient to separate the Hyperplastic class: an important contribution to studies focused on the diagnosis of prostate cancer. Regarding the analysis of colour hues (Table 1), the green colour hues showed better results in 8 of the 9 combinations. This occurs because of the contrast information in intensity between the different components such as nuclei and cytoplasm. This contrast is related to the properties of the dyes hematoxylin and eosin. Hematoxylin has affinity with nucleic acids in the cell nucleus and eosin stains the cytoplasm with pink colour.
4. Conclusion
In this paper an automatic classification method was proposed to analyse prostate stromal tissue of normal, hyperplastic and cancer images. The main features of this method are: (1) the use of texture features of wavelet coefficients, (2) relevante to classification results between images of normal and cancer classes, (3) effectiveness in classification of the Hyperplastic class, which is the most difficult type in diagnosis and prognosis and (4) the use of small ROIs (spatial resolution of 64×64 pixels). In future works, new features of stromal tissue and glandular components such as lumen and cuboidal cells will be investigated.
References
[1] Doyle S, Madabhushi A, Feldman M and Tomaszeweski J 2006 Medical Image Computing and Computer-Assisted Intervention–MICCAI 2006 (Springer) pp 504–511
[2] Nguyen K, Sabata B and Jain A K 2012Pattern Recognition Letters33951–961
[3] Mallat S 1999A wavelet tour of signal processing (Access Online via Elsevier)
[4] Haralick R M, Shanmugam K and Dinstein I H 1973Systems, Man and Cybernetics, IEEE Transactions on
610–621
[5] Wang L and He D C 1990Pattern Recognition 23905–910
[6] de Oliveira D L L, do Nascimento M Z, Neves L A, de Godoy M F, de Arruda P F F and de Santi Neto D 2013Expert Systems with Applications407331–7340
[7] de Oliveira D L L, do Nascimento M Z, Neves L A, de Godoy M F, de Arruda P F F and de Santi Neto D 2012Anais do XXIII Congresso Brasileiro em Engenharia Biomdica – XXIII CBEB (XXIII CBEB) pp 1265–1269
[8] Jacomini R, Nascimento M, Dantas R and Ramos R 2013Recent Patents on Medical Imaging 380–88