Maximum Bite Force Analysis in Different Age
Groups
Patricia Takaki
1Marilena Vieira
1Silvana Bommarito
11Speech Therapy Department, Universidade Federal de São Paulo, São
Paulo, São Paulo, Brazil
Int Arch Otorhinolaryngol 2014;18:272–276.
Address for correspondence Patricia Takaki, Fga, Departamento de Fonoaudiologia, Universidade Federal de São Paulo, Rua Botucatu, 802 São Paulo 04023-062, São Paulo, Brazil (e-mail: patriciatakaki@gmail.com).
Introduction
The masticatory function is acquired by eating experiences and is especially influenced by the consistencies of food. The maximum bite force (MBF), based on masticatory function and related to individual anthropometric characteristics such as sex and age, has been discussed in the literature.1,2The MBF varies according to gender, general physical structure (height and weight), condition of teeth, facial morphology, and also age.2,3There are some contradictions in the litera-ture on the real relationship between these variables.4–7
The masticatory process consists of cutting, grinding, and spraying steps. This process reduces the particle size at different levels and angles of the dental arch, which promotes
its correct function. During the process of human develop-ment, nutrition and food consistencies are modified as height grows and teeth erupt. Thus, a liquid diet gradually becomes firmer, which is necessary for proper swallowing and pro-vides increased facial muscle tone and helps with speech.8,9 It is known that the peaks of MBF occur after the third molar that is around 6 years of age.10Upon completion of the permanent dentition and hormonal stability, MBF decreases and stabilizes. It is also expected that in the phase defined as senility (above 60 years),10the MBF is affected by the aging process because of bone and muscle degeneration.8,9
Few studies relate the MBF and age, and there is a lack of consensus in the literature on this topic and its relevance to orofacial motor function in relation to diagnosis, prognosis, Keywords
►
bite force
►
age groups
►
anthropometry
►
stomatognathic
system
►
mastication
Abstract
Introduction
Maximum bite force (MBF) is the maximum force performed by the
subject on the fragmentation of food, directly related with the mastication and
determined by many factors.
Objective
Analyze the MBF of subjects according to age groups.
Methods
One hundred individuals from the city of São Paulo were equally divided
according to age groups and gender. Each individual submitted to a myotherapy
evaluation composed of anthropometric measurements of height and weight to obtain
body mass index (BMI), using a tape and a digital scale (Magna, G-life, São Paulo), and a
dental condition and maximum bite force evaluation, using a digital dynamometer
model DDK/M (Kratos, São Paulo, Brazil), on Newton scale. The dental and bite force
evaluations were monitored by a professional from the area. Analysis of variance was
used with MBF as a dependent variable, age group and gender as random factors, and
BMI as a control variable.
Results
Till the end of adolescence, it was possible to observe a decrease in MBF in
both sexes, with the male force greater than the female force. In young adults, the
female force became greater the males, then decreased in adulthood. There was no
correlation between MBF and BMI.
Conclusion
There are MBF variations that characterizes the human development
stages, according to age groups.
received
November 11, 2013
accepted
March 7, 2014
published online
April 24, 2014
DOI http://dx.doi.org/ 10.1055/s-0034-1374647.
ISSN 1809-9777.
Copyright © 2014 by Thieme Publicações Ltda, Rio de Janeiro, Brazil
and therapy of changes in mastication. Therefore, the aim of this study was to analyze the MBF, according to different age groups, gender, and body mass index (BMI).
Methods
The study was approved by the Ethics Committee of Uni-versidade Federal de São Paulo, n.1508/11 and was funded by the Foundation for Research Support of the State of São Paulo–FAPESP, process no. 2011/19167-7. The experimental sample consisted of 100 individuals from the city of São Paulo, equally divided between gender and age groups (►Table 1). All participants and, in some cases, those responsible for minors, signed a Term and Statement of Consent form.
The inclusion criteria of the sample were as follows: be at least 11 years old for female participants and at least 12 years for male participants, with a maximum age restriction was 60 years, and have complete permanent dentition and ab-sence of dental mutilation, regardless of the type of dental occlusion. Individuals of age groups described on the above classification.10
The exclusion criteria of the sample were as follows: the age groups described in the literature as infancy, because it involves individuals with incomplete deciduous or mixed dentition, and senility age, involving individuals without teeth, in most cases not fitting one of certain basic criteria for sample. Also considered ineligible were individuals with any kind of syndrome, degenerative diseases, mental defi -ciencies, malformation, changes of the temporomandibular articulation, open and cross-bite, myofunctional changes of masticatory muscles, and dental implants.
Each participant underwent a speech evaluation that consisted of anamnesis, anthropometric measurements, as-sessment of dental conditions, and measurement of the MBF. The anamnesis consisted of personal information such as name, date of birth, age, gender, address, and personal e-mail. Anthropometric measurements were performed with a tape measure, measuring the height (in centimeters) and a digital weighing scale, in kilograms (Magna, G-Life, São Paulo). From these measurements, BMI was determined by the formula BMI¼weight (kg)/height2(m).
Subsequently, dental conditions were assessed and also the dental composition was examined through clinical obser-vation to ensure the presence or absence of dental mutilation
and orthodontic treatment. This stage of evaluation was performed by a specialist in orthodontics, to ensure data reliability.
Bite force was assessed by measuring the maximum force of bites, using a digital dynamometer model DDK/M (Kratos, São Paulo, Brazil). This device was developed to determine the amount of force applied by an individual at the time of a bite. The scale used is kilogram force (kgf), newtons (N) or pound force (lbf), with an adjustment knob to zero, and peak results are recorded on a digital screen, which allows measurement of the maximum force applied (maximum capacity of 100 kgf, adapted to oral conditions). Each participant performed three bites on each side (right and left), alternately, and the arithmetic means of all measurements were calculated.
The measurement process was performed in the Orofacial Miotherapy Clinic of Universidade Federal de São Paulo, located in São Paulo. During the assessments, the participant was asked to stand up and was instructed to keep the legs slightly open to ensure the body balance. The instructions were detailed during the proceedings, and before the actual measurements were started, the participants were instructed to bite (equipment testing performed twice) to ensure mea-surement reliability.
To measure the MBF, the device was alternately placed on thefirst molars and on both sides of the dental arch. Partic-ipants were instructed to bite“as hard as they could.”Then, three measurements on each side were made with an interval of 2 minutes. The MBF was recorded in newtons and measured as the peak force shown on the device screen. Results were recorded in the registry of each participant for further analysis. The dynamometer was cleaned with 70% alcohol and protected with disposable latex finger cots, positioned on the bite device between each process.
The collected data were analyzed by analysis of variance. SPSS software, version 12 (SPSS Inc., Quarry Bay, HK) was used and the test was set up to analyze the MBF as the dependent variable and with age and gender as random factors and BMI as a control variable. The confidence interval was 95% (α¼0.05).
Results
Data analysis revealed that F-values were to low to reject the null hypothesis (FIMC¼1.252, p>0.10; FGROUP¼1.305, p>0.10; FSEX¼0.450, p>0.10; FGROUPSEX¼1,721,
Table 1 Age groups according to the human development phases and sample size10
Age group Men Women
n Age group (y) n Age group (y)
Prepubescent 10 12–13.9 10 11–12.9
Pubescent 10 14–15.9 10 13–14.9
Postpubescent 10 16–19.9 10 15–17.9
Young adult 10 20–24.9 10 18–24.9
p>0.10). This means that the measures of MBF in between MBI, age and sex groups varied equally in large scale. causing a non-rejection of the null hypothesis: the average values of MBF according to the measures listed above varied largely, but in the same proportion, in all groups of analysis (►Table 2). The differences were not statistically significant between the values of MBF and age groups, even without the age–gender interaction. Thus, age does not determine the MBF. After calculating the BMI, no significant relationship was found in the variables of height and weight with the MBF. The gender factor also did not significantly determine the MBF.
The mean values showed a nonlinear variation, especially in female participants, for whom the values became smaller between 11 and 17 years, and then rose again with another valley in early adulthood, 25 years of age (►Fig. 1).
Male participants had higher values for MBF compared with girls in the pubescent period. Bite force also declined between 12 and 19 years of age. However, it appeared to be lower than that of women aged 20 years old. This difference decreases from the age of 25, since the force for the male participants increases less abruptly, as shown in►Table 3, approaching the average for female participants.
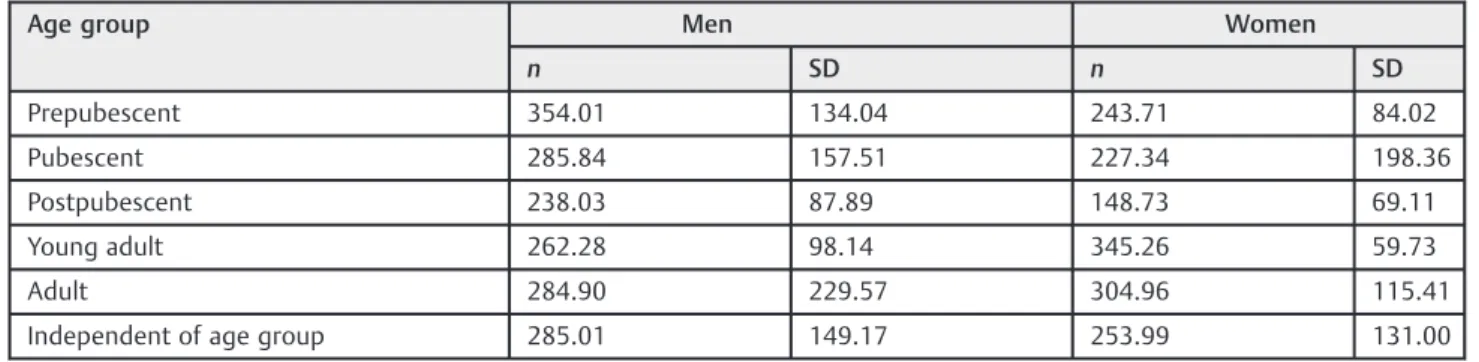
After independent analysis of the age variable, the average bite force of male participants was greater than that of female participants, with a difference of 31.01 N (male: 285.01 N; female: 253.99 N). Although men had a bite force 12.21% higher than women, the difference was not statistically significant (p>0.05).
Discussion
MBF is an objective and quantitative measure for evaluating masticatory performance, which verifies the effectiveness of incising, crushing, and pulverizing food by the number of functional teeth.►Fig. 1 shows the MBF curve in newtons according to age groups.10,11 It is possible that younger children (prepubescent age group) faithfully followed the instructions for measuring strength. However, it is possible to infer that children from the puberty group had toothaches or concern with muscle pain, tooth damage, or seizure and that is why this group had higher results than expected for their age. Research indicates that the measurement of MBF depends on the motivation and cooperation of individuals, emphasizing that these concerns can occur with some par-ticipants, as well as other concerns not noted in this study, such as temporomandibular joint structures and support pain and limitation of strength for pain reflex mechanisms.1
►Table 3shows that there was an increase in MBF according to age. In the literature, the increase in MBF occurs in individuals between 15 and 18 years of age.4Also in►Table 3, the average bite force for men was 12.21% higher than that of women, with a difference of 31.01 N between them. Although the results showed no statistically significant difference between the vari-ables, there may be a greater tendency with a larger sample. In the literature, there are significant differences in MBF between men and women.1,2,6A survey revealed that the bite force of men is usually 30% higher when compared with women.12
One study looked at the average curve between genders and stated that there is a variation of MBF according to age. However, other studies have analyzed that MBF is not deter-mined by age, but gender has been a highly correlated variable.5,6One possible explanation for the fact that women had higher measures than men in adulthood is that the variation of responses are higher than age.►Table 3shows that the standard deviations for these groups is higher, which means that the values varied widely.
In some studies, authors did not use a validated age classification.10Many studies do not use the same equipment for measuring bite force as used in this study.2–4,6,7,13–15 Some studies reported that age, gender and height2,16are not sufficient to determine MBF, as observed in this study.
►Table 3shows that MBF increased until age 20, stabilized up to 40 or 50 years of age, and then a reduction occurred.1As observed in this study, female participants aged over 25 years showed decreased MBF.
Table 2 Statistical analysis of variables and age group–gender interaction with no significant relation to the maximum bite force
Variables Type III sum of squares df Square mean F pvalue
Intercept 72.185 1 72.185 3.973 0.05
BMI 22.586 1 22.586 1.252 0.266
Age group 157.882 4 39.470 1.305 0.394
Sex 13.749 1 13.749 0.45 0.45
Groupsex 124.162 4 31.040 1.721 0.152
Abbreviations: df, degrees of freedom; IMC, BMI, body mass index; Groupsex, interaction between the two variables.
Some studies reported that MBF decrease with increasing age may occur mainly due to tooth decay7 and reduced androgenic hormones,2which decreases in both sexes around 35 years of age. In women, this decrease is more notable because they begin with a much lower rate of hormone than men, and so their strength reduces more quickly. The hor-monal factor was not controlled in this study, suggesting further investigation on the variable in question.
There was no consensus among the national and interna-tional literature on the importance of age as a determinant of, as showed above. There are reports that MBF decreases in women after 25 years of age and in men over 45 years of age.1,6 It was not possible to precisely compare the age classification used in this study (25 to 60 years old) with other studies.
Significant relationships were observed with BMI and MBF as a trend, as found in the literature (►Table 2), but one difference might be in the size of the sample. Some studies showed a nonexistent relationship between MBF and body measurements.13–15 Researchers studied normal subjects with permanent dentition and concluded that there is rela-tionship between MBF and age as well as height and weight,6 and the present study found a trend (►Table 2).
There is some controversy in the literature about the masticatory performance. A study of children and adolescents reported that masticatory performance increases with age17; another study reported that in adolescents and adults, age does not influence masticatory performance.11Additionally, dentition is indirectly related to the MBF,11,17which indicates that the force is determined by the development.
So even with weak or no correlations between MBF and age, this study, along with the literature described, indicate that growth and development can cause changes in MBF.
This study has limitations, such as sample size, which affected the determination of the correlation between MBF and age groups as well as the influence of BMI and gender. Therefore, future research is suggested with a larger sample size.
Future research is proposed to determine other variables that can directly interfere with the results, such as ethnic factor indirectly related to facial morphology, hormone levels associated with pregnancy, testosterone levels, tooth decay, and masticatory preference side. This information is essential to identify a possible prevalence of MBF on the side.
Conclusion
In this study, it was concluded that the MBF varies qualita-tively along the human development process; there is an important increase in bite force in women until adulthood, which then decreases in adulthood (25 years). For men, the MBF is greater than in women independent of age groups. A trend was found between MBF and BMI.
References
1 Bakke M. Bite force and occlusion. Semin Orthod 2006;12(2): 120–126
2 Bonjardim LR, Gavião MBD, Pereira LJ, Castelo PM. Bite force determination in adolescents with and without temporomandib-ular dysfunction. J Oral Rehabil 2005;32(8):577–583
3 Roldán S, Buschang PH, Isaza Saldarriaga JF, Throckmorton G. Reliability of maximum bite force measurements in age-varying populations. J Oral Rehabil 2009;36(11):801–807
4 Varga S, Spalj S, Lapter Varga M, Anic Milosevic S, Mestrovic S, Slaj M. Maximum voluntary molar bite force in subjects with normal occlusion. Eur J Orthod 2011;33(4):427–433
5 Kogawa EM, Calderon PS, Lauris JRP, Araujo CRP, Conti PCR. Evaluation of maximal bite force in temporomandibular disorders patients. J Oral Rehabil 2006;33(8):559–565
6 van der Bilt A, Tekamp A, van der Glas H, Abbink J. Bite force and electromyograpy during maximum unilateral and bilateral clench-ing. Eur J Oral Sci 2008;116(3):217–222
7 Pereira LJ, Pastore MG, Bonjardim LR, Castelo PM, Gavião MBD. Molar bite force and its correlation with signs of temporomandib-ular dysfunction in mixed and permanent dentition. J Oral Rehabil 2007;34(10):759–766
8 Tessitore A, Cattoni DM. Tratado de Fonoaudiologia: Diagnóstico das Alterações de Respiração, Mastigação e Deglutição. Cap. 49. 2ª Ed. São Paulo, Brazil: Roca; 2010
9 Dubrul EL. Anatomia Oral de Sicher e Dubrul. 8ª ed. São Paulo, Brazil: Artes Médicas; 1991
10 Mayoral J, Mayoral G. Ortodoncia—Princípios Fudamentales y Pratica. 2ª Ed. Barcelona: Editora Labor; 1971
11 Fontijn-Tekamp FA, van der Bilt A, Abbink JH, Bosman F. Swallow-ing threshold and masticatory performance in dentate adults. Physiol Behav 2004;83(3):431–436
12 Palinkas M, Nassar MS, Cecílio FA, et al. Age and gender influence on maximal bite force and masticatory muscles thickness. Arch Oral Biol 2010;55(10):797–802
13 Lujan-Climent M, Martinez-Gomis J, Palau S, Ayuso-Montero R, Salsench J, Peraire M. Influence of static and dynamic occlusal characteristics and muscle force on masticatory performance in dentate adults. Eur J Oral Sci 2008;116(3):229–236
Table 3 Maximum bite force means, in newtons, and standard deviations for each age group
Age group Men Women
n SD n SD
Prepubescent 354.01 134.04 243.71 84.02
Pubescent 285.84 157.51 227.34 198.36
Postpubescent 238.03 87.89 148.73 69.11
Young adult 262.28 98.14 345.26 59.73
Adult 284.90 229.57 304.96 115.41
Independent of age group 285.01 149.17 253.99 131.00
14 Castelo PM, Pereira LJ, Bonjardim LR, Gavião MBD. Changes in bite force, masticatory muscle thickness, and facial morphology be-tween primary and mixed dentition in preschool children with normal occlusion. Ann Anat 2010;192(1):23–26
15 Gavião MBD, Raymundo VG, Rentes AM. Masticatory performance and bite force in children with primary dentition. Braz Oral Res 2007;21(2):146–152
16 Pereira-Cenci T, Pereira LJ, Cenci MS, Bonachela WC, Del Bel Cury AA. Maximal bite force and its association with temporomandib-ular disorders. Braz Dent J 2007;18(1):65–68