AR
TICLE
1 Departamento de Epidemiologia, Faculdade de Saúde Pública, Universidade de São Paulo. Av. Dr. Arnaldo 715, Cerqueira César. 01246-904 São Paulo SP Brasil. denisepb@usp.br
Body mass index and waist circumference are good indicators
for classifying children’s nutritional status
Abstract This study aimed to investigate the relationship between anthropometric indicators - body mass index (BMI), waist circumference (WC), and waist-to-height ratio (WHtR) - and the sum of skinfold thicknesses in 7-10-year-old children attending a public school in São Pau-lo (SP). Height, weight, WC and triceps, biceps, subscapular and suprailiac skinfolds were mea-sured, and the sum of skinfold thicknesses, BMI and WHtR were calculated. A Bland-Altman analysis was used in order to compare methods, with values transformed into z-scores. The anal-ysis of limits of agreement and confidence inter-vals showed evidence of good agreement, above all between BMI and WC, and the sum of skinfold thicknesses, complying with strict agreement lim-its and differences smaller than 1 standard de-viation (SD). WHtR showed moderate limits of agreement, from -1.02 to + 0.64 SD (boys) and -0.74 to + 1.12 SD (girls); its performance was not better than that of WC alone, the lower and up-per limits of agreement for which were -0.91 to + 0.58 SD (boys) and -0.56 to + 0.89 SD (girls). The results support the use of anthropometric indica-tors to classify nutritional status, above all BMI and WC, in that both are similar when classifying children according to body fatness, and confer the advantages of being easy to obtain and affordable.
Key words Children, Adiposity, Anthropometry
Natália Sanchez Oliveira Jensen 1
Taís de Fátima Borges Camargo 1
Je
nse
n NSO
Introduction
Childhood obesity is a concerning issue in Brazil and a range of countries, given its raised
preva-lence1,2 and the presence of excess body fatness
(BF) at increasingly early ages3, raising the risk
of developing type 2 diabetes and
cardiovascu-lar diseases in childhood and in later life4. World
estimates show that from 1980 to 2013 the prev-alence of obesity in children and adolescents has risen in developing countries from 8.1% to
12.9% in boys and from 8.4% to 13.4% in girls5.
Anthropometric indicators such as body
mass index (BMI) are widely used6. Despite
be-ing useful for classifybe-ing children’s nutritional status, the ability of the BMI to predict BF is still a matter for debate because a high score may re-sult both from high levels of body fatness or of
lean tissue7.
Waist circumference (WC) and waist-to-height ratio (WHtR) have also been put forward for screening for excess BF, and have shown pos-itive associations with cardiometabolic risk fac-tors owing to the relationship between the waist
measurement and visceral adiposity8. However,
there are no cut-off points for WC based on a representative sample of the Brazilian popula-tion for the classificapopula-tion of children according
to body fatness9.
For WHtR, the identification of cut-off points for screening children with excess BF has
been the topic of recent studies10,11; a score of 0.5
has been put forward as a cut-off value to predict cardiometabolic risk both in children and adults, whatever the gender, and this has been simplified in public health advice as “keep your waist
cir-cumference below half your height”12.
Being so easy and so affordable to obtain, the performance of these anthropometric indicators should be studied for their contribution to fur-ther epidemiological studies classifying children by BF and analyzing techniques that give valid es-timates of body composition such as dual-energy X-ray absorptiometry (DEXA), isotope dilution, air-displacement plethysmography (ADP) or skinfold measurements, the latter being the most
feasible in population studies13,14.
The aim of this study was therefore to inves-tigate the relationship between BMI, WC and WHtR and the sum of skinfold thicknesses in a 7-to-10-year-old population attending a public school in São Paulo, Brazil.
Methods
The study included all children enrolled from the 2nd to 5th years of basic education (n = 217) at a public school in the municipality of São Pau-lo, Brazil; data was gathered in November 2008. Anthropometric characteristics were measured by researchers trained in accordance with World
Health Organization recommendations6.
Height (cm) was measured using a SE-CA®stadiometer and weight (kg) using a Tanita® digital scales; the children were bare-footed and wore light clothing. Waist circumference (WC) was measured in centimeters at the mid-point between the lower border of the last rib and the iliac crest, at the end of a normal expiration,
us-ing a non-elastic tape measure6.
Triceps, biceps, subscapula and suprail-iac skinfolds (mm) were measured using a Lange®adipometer on the right-hand side of the body. All measurements were taken in du-plicate, and averages were calculated later. The second measurements were recorded by the same researcher - without, however, seeing the first scores so as to avoid memory bias.
BMI (weight (kg)/height2 (meters)), WHR
(waist circumference (cm)/height (cm)) and the sum of the four skinfolds (mm) were calculated. The research project was approved by the Univer-sity of São Paulo School of Public Health’s Ethics Committee; the legal guardians for the children taking part in the study signed a free informed consent document.
Statistical analysis
The descriptive analysis involved calculating the mean, standard deviation and 95% confi-dence interval (95% CI). To analyze the agree-ment between each indicator and the sum of
skinfold measurements, the Bland-Altman15
ap-proach was followed, and a scatter plot was pro-duced to show the difference between the two variables (y axis) and their mean (x axis). To en-able comparison between varien-ables measured
us-ing different units (e.g. BMI (kg/m2) and the sum
of skinfolds (mm)), scores were standardized by taking the difference between the score and the average, divided by the standard deviation, to produce the z-score.
aúd
e C
ole
tiv
a,
21(4):1175-1180,
2016
when from 1.0 to 1.49 SD and there was con-sidered to be agreement between the methods for differences smaller than 1.0 SD. Stat 11.0 (StataCorp LP, College Station, TX) was used for the statistical analysis.
Results
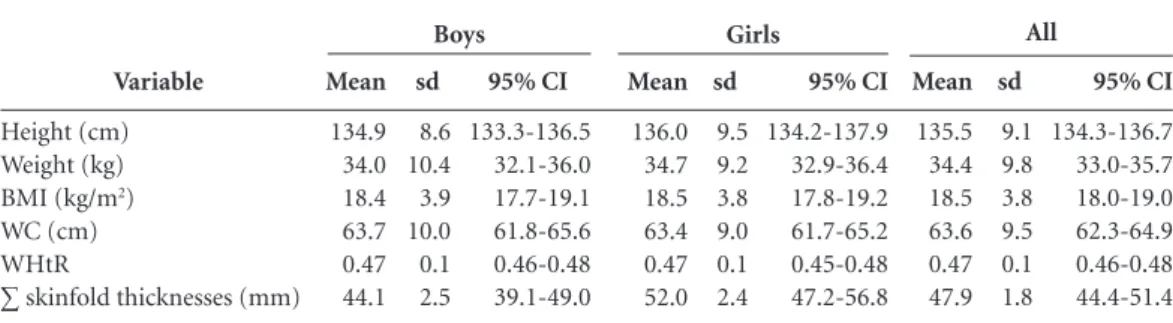
The 217 school children taking part in the study were almost equally distributed by gender (n = 111 boys and n = 106 girls) and an average age of 9.2 years (SD 1.0 year). Superimposing the confi-dence intervals, no difference was found between boys and girls as to scores for average height, weight, BMI, WC, WHtR and sum of skinfold thicknesses (Table 1).
Figure 1 presents the Bland-Altman plots. The analysis of limits of agreement and their confidence intervals showed evidence of good agreement, above all between BMI and WC with the sum of skinfold thicknesses, complying with strict agreement limits and differences smaller than 1 standard deviation (SD). WHtR showed moderate limits of agreement, from -1.02 to +0.64 SD (boys) and -0.74 to +1.12 SD (girls); the performance of WHtR was not better than that of WC alone, the lower and upper limits of agreement for which were -0.91 to +0.58 SD (boys) and -0.56 to +0.89 SD (girls).
Discussion
The results from this study support the use of BMI and WC to identify children with excess BF, bearing out findings published in the literature that describe the indicators’ good performance in
identifying excess BF with DEXA or skinfolds as
reference16-19.
In this study BMI and WC alone present-ed better agreement with skinfold measure-ments than WHtR - as has also been found by
other researchers20,21. In the study by Sijtsma et
al.21 investigating the performance of BMI, WC
and WHtR in predicting cardiometabolic risk in 3-to-7-year-old children, WHtR showed the worst performance in estimating BF percentage, and the lowest scores for correlation to variables indicating cardiometabolic risk.
However, in another study of
9-to-11-year-old Japanese schoolchildren10 as well as in a study
of 7-to-10-year-old Brazilian schoolchildren11,
WHtR performed well, comparably with BMI and WC in identifying excess abdominal adiposi-ty and total BF, respectively. The disparities in the literature may be linked to the age group of the individuals assessed and to differences between populations.
Furthermore, given that WHtR was proposed in the late 1990s and that interest in its perfor-mance as a BF indicator has grown in recent
years22, the number of articles on this indicator
is scarce when compared with BMI and WC. Fur-ther studies would seem to be necessary in order to enable definitive conclusions to be drawn as to its effectiveness in detecting excess BF in chil-dren.
Sample size is one limitation of the present study, as is the use of data concerning children from a single public school, hindering any gen-eralization of the results. On the other hand one advantage was the fact that the study was carried out with all of the schoolchildren from the 2nd to 5th years of basic education (i.e. 7-to-10-year-olds).
Variable
Height (cm) Weight (kg)
BMI (kg/m2)
WC (cm) WHtR
∑ skinfold thicknesses (mm)
Table 1. Mean values, standard deviation (sd), and 95% confidence interval (95% CI) of height, weight, body mass index (BMI), waist circumference (WC), waist-to-height ratio (WHtR), and sum of skinfold thicknesses in 7-10-year-old children attending a public school in São Paulo, Brazil.
Mean
134.9 34.0 18.4 63.7 0.47 44.1
sd
8.6 10.4 3.9 10.0 0.1 2.5
95% CI
133.3-136.5 32.1-36.0 17.7-19.1 61.8-65.6 0.46-0.48 39.1-49.0
Mean
136.0 34.7 18.5 63.4 0.47 52.0
sd
9.5 9.2 3.8 9.0 0.1 2.4
95% CI
134.2-137.9 32.9-36.4 17.8-19.2 61.7-65.2 0.45-0.48 47.2-56.8
Mean
135.5 34.4 18.5 63.6 0.47 47.9
sd
9.1 9.8 3.8 9.5 0.1 1.8
95% CI
134.3-136.7 33.0-35.7 18.0-19.0 62.3-64.9 0.46-0.48 44.4-51.4
Je
nse
n NSO
Figure 1. Bland and Altman plots. Distribution of 7-10-year-old children attending a public school in São Paulo, Brazil, according to mean values and differences (transformed into z-scores) between anthropometric indicators (a) body mass index (BMI), (b) waist circumference (WC), and (c) waist-to-height ratio (WHtR) and the sum of skinfold thicknesses, by gender.
* Values converted to z.
(a)
Boys
mean
Lower limit of agreement (95% CI): -0.90 (-1.02 to - 0.77) Upper limit of agreement (95% CI): 0.63 (0.50 to 0.76)
diff
er
enc
e skinf
olds - BMI
2
1
0
-1
-2
-2 -1 0 1 2 3 4
Girls
mean
Lower limit of agreement (95% CI): -0.58 (-0.70 to -0.46) Upper limit of agreement (95% CI): 0.85 (0.72 to 0.97)
diff
er
enc
e skinf
olds - BMI
2
1
0
-1
-2
-2 -1 0 1 2 3 4
(b)
Boys
mean
Lower limit of agreement (95% CI): -0.91 (-1.03 to -0.79) Upper limit of agreement (95% CI): 0.58 (0.46 to 0.71)
diff
er
enc
e skinf
olds -
W
C
2
1
0
-1
-2
-2 -1 0 1 2 3 4
Girls
mean
Lower limit of agreement (95% CI): -0.56 (-0.69 to -0.44) Upper limit of agreement (95% CI): 0.89 (0.76 to 1.01)
diff
er
enc
e skinf
olds -
W
C
2
1
0
-1
-2
-2 -1 0 1 2 3 4
(c)
Boys
mean
Lower limit of agreement (95% CI): -1.02 (-1.15 to -0.88) Upper limit of agreement (95% CI): 0.64 (0.51 to 0.78)
diff
er
enc
e skinf
olds -
WHtR
2
1
0
-1
-2
-2 -1 0 1 2 3 4
Girls
mean
Lower limit of agreement (95% CI): -0.74 (-0.89 to -0.58) Upper limit of agreement (95% CI): 1.12 (0.96 to 1.28)
diff
er
enc
e skinf
olds -
WHtR
2
1
0
-1
-2
aúd
e C
ole
tiv
a,
21(4):1175-1180,
2016
The choice of skinfolds as the method of com-parison, rather than such techniques as DEXA or ADP, enabled measurements to be taken in the school itself, facilitating the field work. The lit-erature indicates this method as the best choice when DEXA or ADP equipment - for example - is not available for financial or operational
rea-sons14. Using skinfold measurements necessitates
the training of assessors, standardization of the procedures followed, and a reliability study,
indi-cating the quality of the data23. We therefore
opt-ed to work with duplicate scores. The literature
recommends taking at least two measurements24,
although some authors argue for three
measure-ments to be taken25.
We opted to sum the scores rather than use predictive equations since we had access to mea-surements for four skinfolds - biceps, triceps, subscapular and suprailiac - that reflect both
central and peripheral fatness. The equations normally consider one or two skinfolds - as in
Slaughter et al.26, for example, with the triceps
and calf. Furthermore, studies of children and adolescents question the validity of these
equa-tions in different populaequa-tions27,28.
To conclude, the results show agreement be-tween BMI and WC and the skinfolds, reinforc-ing favorable evidence in the literature of the use of these measurements in classifying schoolchil-dren as to BF. Division of the waist score by the height (WHtR) showed worst agreement com-pared with waist circumference alone. We there-fore particularly suggest the use of BMI and WC in epidemiological studies as methods for clas-sifying nutritional status, because both perform similarly and have the advantage of being harm-less, affordable and easy to obtain and interpret.
Collaborations
NOS Jensen, TFB Camargo and DP Bergamaschi helped in the conception of the article, in the sta-tistical analysis and in the interpretation of the data, the drafting and the proof reading of the manuscript.
Acknowledgments
To Brazil’s National Council for Scientific and
Technological Development (Conselho
Nacio-nal de Desenvolvimento Científico e Tecnológico - CNPq) for funding the original project and for the scholarship for Natália Sanchez Oliveira Jen-sen. To the University of São Paulo for the grant
in Initiation in the Scientific Method (
Iniciação-Científica) for Taís de Fátima Borges Camargo (RUSP Institutional Scholarship) during the exe-cution of the study.
References
Instituto Brasileiro de Geografia e Estatística (IBGE). Antropometria e estado nutricional de crianças, adoles-centes e adultos no Brasil. Rio de Janeiro: IBGE; 2010. Ogden CL, Carroll MD, Kit BK, Flegal KM. Prevalence of childhood and adult obesity in the United States, 2011-2012. JAMA 2014; 311(8):806-814.
de Onis M, Blössner M, Borghi E. Global prevalence and trends of overweight and obesity among preschool children. Am J Clin Nutr 2010; 92(5):1257-1264. Park MH, Sovio U, Viner RM, Hardy RJ, Kinra S. Over-weight in childhood, adolescence and adulthood and cardiovascular risk in later life: pooled analysis of three british birth cohorts. PLoS One 2013; 8(7):e70684. 1.
2.
3.
Je
nse
n NSO
Ng M, Fleming T, Robinson M, Thomson B, Graetz N, Margono C, Mullany EC, Biryukov S, Abbafati C, Abera SF, Abraham JP, Abu-Rmeileh NM, Achoki T, AlBuhai-ran FS, Alemu ZA, Alfonso R, Ali MK, Ali R, Guzman NA, Ammar W, Anwari P, Banerjee A, Barquera S, Basu S, Bennett DA, Bhutta Z, Blore J, Cabral N, Nonato IC, Chang JC, Chowdhury R, Courville KJ, Criqui MH, Cundiff DK, Dabhadkar KC, Dandona L, Davis A, Dayama A, Dharmaratne SD, Ding EL, Durrani AM, Esteghamati A, Farzadfar F, Fay DF, Feigin VL, Flaxman A, Forouzanfar MH, Goto A, Green MA, Gupta R, Ha-fezi-Nejad N, Hankey GJ, Harewood HC, Havmoeller R, Hay S, Hernandez L, Husseini A, Idrisov BT, Ikeda N, Islami F, Jahangir E, Jassal SK, Jee SH, Jeffreys M, Jonas JB, Kabagambe EK, Khalifa SE, Kengne AP, Khader YS, Khang YH, Kim D, Kimokoti RW, Kinge JM, Kokubo Y, Kosen S, Kwan G, Lai T, Leinsalu M, Li Y, Liang X, Liu S, Logroscino G, Lotufo PA, Lu Y, Ma J, Mainoo NK, Men-sah GA, Merriman TR, Mokdad AH, Moschandreas J, Naghavi M, Naheed A, Nand D, Narayan KM, Nelson EL, Neuhouser ML, Nisar MI, Ohkubo T, Oti SO, Pe-droza A, Prabhakaran D, Roy N, Sampson U, Seo H, Se-panlou SG, Shibuya K, Shiri R, Shiue I, Singh GM, Singh JA, Skirbekk V, Stapelberg NJ, Sturua L, Sykes BL, Tobias M, Tran BX, Trasande L, Toyoshima H, van de Vijver S, Vasankari TJ, Veerman JL, Velasquez-Melendez G, Vlas-sov VV, Vollset SE, Vos T, Wang C, Wang X, Weiderpass E, Werdecker A, Wright JL, Yang YC, Yatsuya H, Yoon J, Yoon SJ, Zhao Y, Zhou M, Zhu S, Lopez AD, Murray CJ, Gakidou E. Global, regional, and national prevalence of overweight and obesity in children and adults during 1980-2013: a systematic analysis for the Global Burden of Disease Study 2013. Lancet 2014; 384(9945):766-781. World Health Organization (WHO). Physical Status: The use and interpretation of anthropometry. Geneva: WHO; 1995. (WHO – Technical Report Series, 854). Freedman DS, Ogden CL, Blanck HM, Borrud LG, Di-etz WH. The abilities of body mass index and skinfold thicknesses to identify children with low or elevated levels of dual-energy X-ray absorptiometry-deter-mined body fatness. J Pediatr 2013; 163(1):160-166. Harrington DM, Staiano AE, Broyles ST, Gupta AK, Katzmarzyk PT. Waist circumference measurement site does not affect relationships with visceral adiposity and cardiometabolic risk factors in children. Pediatr Obes 2013; 8(3):199-206.
Bergmann GG, Gaya A, Halpern R, Bergmann ML, Rech RR, Constanzi CB, Alli LR. Waist circumference as screening instrument for cardiovascular disease risk factors in schoolchildren. J Pediatr (Rio J) 2010; 86(5):411-416.
Fujita Y, Kouda K, Nakamura H, Iki M. Cut-off values of body mass index, waist circumference, and waist-to-height ratio to identify excess abdominal fat: pop-ulation-based screening of Japanese school children. J Epidemiol 2011; 21(3):191-196.
Ribeiro EA, Leal DB, de Assis MA. Diagnostic accuracy of anthropometric indices in predicting excess body fat among seven to ten-year-old children. Rev Bras Epide-miol 2014; 17(1):243-254.
Browning LM, Hsieh SD, Ashwell M. A systematic re-view of waist-to-height ratio as a screening tool for the prediction of cardiovascular disease and diabetes: 0·5 could be a suitable global boundary value. Nutr Res Rev 2010; 23(2):247-269.
Weber DR, Leonard MB, Zemel BS. Body composition analysis in the pediatric population. Pediatr Endocrinol Rev 2012; 10(1):130-139.
5.
6.
7.
8.
9.
10.
11.
12.
13.
Michels N, Huybrechts I, Bammann K, Lissner L, Moreno L, Peeters M, Sioen I, Vanaelst B, Vyncke K, De Henauw S. Caucasian children’s fat mass: routine an-thropometry v. air-displacement plethysmography. Br J Nutr 2013; 109(8):1528-1537.
Bland JM, Altman DG. Statistical methods for assessing agreement between two methods of clinical measure-ment. Lancet 1986; 1(8476):307-310.
Reilly JJ, Dorosty AR, Ghomizadeh NM, Sherriff A, Wells JC, Ness AR. Comparison of waist circumference percentiles versus body mass index percentiles for di-agnosis of obesity in a large cohort of children. Int J Pediatr Obes 2010; 5(2):151-156.
Flegal KM, Ogden CL, Yanovski JA, Freedman DS, Shepherd JA, Graubard BI, Borrud LG. High adiposity and high body mass index-for-age in US children and adolescents overall and by race-ethnic group. Am J Clin Nutr 2010; 91(4):1020-1026.
Tuan NT, Wang Y. Adiposity assessments: agreement between dual-energy X-ray absorptiometry and an-thropometric measures in U.S. children. Obesity (Silver Spring) 2014; 22(6):1495-1504.
Leal DB, de Assis MAA, Conde WL, Bellisle F. Perfor-mance of references based on body mass index for de-tecting excess body fatness in schoolchildren aged 7 to 10 years. Rev Bras Epidemiol 2014; 17(2):517-530. Hubert H, Guinhouya CB, Allard L, Durocher A. Comparison of the diagnostic quality of body mass index, waist circumference and waist-to-height ratio in screening skinfold-determined obesity among chil-dren. J Sci Med Sport 2009; 12(4):449-451.
Sijtsma A, Bocca G, L’abée C, Liem ET, Sauer PJ, Cor-peleijn E. Waist-to-height ratio, waist circumference and BMI as indicators of percentage fat mass and car-diometabolic risk factors in children aged 3-7 years. Clin Nutr 2014; 33(2):311-315.
Ashwell M, Gunn P, Gibson S. Waist-to-height ratio is a better screening tool than waist circumference and BMI for adult cardiometabolic risk factors: systematic review and meta-analysis. Obes Rev 2012; 13(3):275-286. Freaza SEM, Sewell CD, Adami F, Hinnig PF, Berga-maschi DP. Relação entre atividade física e peso, estatu-ra e IMC de escolares de 7 a 10 anos. In: 10º Congresso Nacional da Sociedade Brasileira de Alimentação e Nu-trição, 2009, São Paulo. Anais do 10º Congresso Nacio-nal da Sociedade Brasileira de Alimentação e Nutrição – SBAN – Dos Genes à Coletividade. São Paulo: SBAN; 2009. p. 304.
Heyward VH, Stolarczyk LM. Avaliação da composição corporal aplicada. São Paulo: Manole; 2000.
Lohman TG, Roche AF, Martorell R, editors. Antropo-metric standardization reference manual. Champaign: Human kinetics; 1988.
Slaughter MH, Lohman TG, Boileau RA, Horswill CA, Stilman RJ, Van Loan MD, Bemben DA. Skinfold equa-tions for estimation of body fatness in children and youth. Hum Biol 1988; 60(5):709-723.
Yeung DC, Hui SS. Validity and reliability of skinfold measurement in assessing body fatness of Chinese chil-dren. Asia Pac J Clin Nutr 2010; 19(3):350-357. Hoffman DJ, Toro-Ramos T, Sawaya AL, Roberts SB, Rondo P. Estimating total body fat using a skinfold pre-diction equation in Brazilian children. Ann Hum Biol 2012; 39(2):156-160.
Article submitted 08/06/2015 Approved 06/08/2015
Final version submitted 08/08/2015 14.
15.
16.
17.
18.
19.
20.
21.
22.
23.
24. 25.
26.
27.