REVISTA PAULISTA
DE PEDIATRIA
Rev Paul Pediatr. 2015;33(1):56–621984-1462/© 2014 Sociedade de Pediatria de São Paulo. Published by Elsevier Editora Ltda. All rights reserved. www.rpped.com.br
DOI of refers to article: http://dx.doi.org/10.1016/j.rpped.2014.06.007
ORIGINAL ARTICLE
Anthropometric indicators of obesity in the prediction
of high body fat in adolescents
Andreia Pelegrini
a,*, Diego Augusto Santos Silva
b,
João Marcos Ferreira de Lima Silva
c, Leoberto Grigollo
d,
Edio Luiz Petroski
ba Universidade do Estado de Santa Catarina (UDESC), Florianópolis, SC, Brazil b Universidade Federal de Santa Catarina (UFSC), Florianópolis, SC, Brazil c Faculdade Leão Sampaio (FALS), Juazeiro do Norte, CE, Brazil
d Universidade do Oeste de Santa Catarina (UNOESC), Joaçaba, SC, Brazil
Received 18 April 2014; accepted 6 August 2014
KEYWORDS
Anthropometry; Body fat distribution; Students
Abstract
Objective:To determine the anthropometric indicators of obesity in the prediction of
high body fat in adolescents from a Brazilian State.
Methods:The study included 1,197 adolescents (15-17 years old). The following
anthro-pometric measurements were collected: body mass (weight and height), waist circumfe-rence and skinfolds (triceps and medial calf). The anthropometric indicators analyzed were: body mass index (BMI), waist circumference (WC), waist-to-height ratio (WHtR) and conicity index (C-Index). Body fat percentage, estimated by the Slaughter et al equa-tion, was used as the reference method. Descriptive statistics, U Mann-Whitney test, and ROC curve were used for data analysis.
Results: Of the four anthropometric indicators studied, BMI, WHtR and WC had the
lar-gest areas under the ROC curve in relation to relative high body fat in both genders. The cutoffs for boys and girls, respectively, associated with high body fat were BMI 22.7 and 20.1kg/m², WHtR 0.43 and 0.41, WC 75.7 and 67.7cm and C-Index 1.12 and 1.06.
Conclusions: Anthropometric indicators can be used in screening for identiication of
body fat in adolescents, because they are simple, have low cost and are non-invasive. © 2014 Sociedade de Pediatria de São Paulo. Published by Elsevier Editora Ltda. All rights reserved.
*Corresponding author.
em adolescentes Resumo
Objetivo: Determinar os indicadores antropométricos de obesidade na predição da
gordura corporal elevada em adolescentes de um estado brasileiro.
Métodos: O estudo incluiu 1.197 adolescentes (15-17 anos). Foram coletadas medidas
antropométricas: massa corporal e estatura, perímetro da cintura e dobras cutâneas (tríceps e perna medial). Os indicadores antropométricos analisados foram: índice de massa corporal (IMC), perímetro da cintura (PC), razão cintura-estatura (RCE) e índice de conicidade (ÍndiceC). A gordura corporal elevada, estimada pela equação de Slaughter et al que foi usada como método de referência. Estatística descritiva, teste U de Mann-Whitney e curva ROC foram utilizadas para a análise dos dados.
Resultados: Dos indicadores antropométricos estudados, o IMC e RCE e o PC tiveram as
maiores áreas sob a curva ROC em relação ao gordura corporal relativa elevada em ambos os sexos. Os pontos de corte para os rapazes e moças, respectivamente, associados com gordura corporal elevada foram IMC 22,7 e 20,1kg/m², RCE 0,43 e 0,41 e PC de 75,7 e 67,7cm e ÍndiceC de 1,12 e 1,06.
Conclusões: Os indicadores antropométricos podem ser usados como ferramenta para
identiicação da gordura corporal em adolescentes, por ser um método simples, de baixo
custo e não invasivo.
© 2014 Sociedade de Pediatria de São Paulo. Publicado por Elsevier Editora Ltda. Todos os direitos reservados.
Antropometria; Distribuição de gordura corporal;
Estudantes
Introduction
Overweight has been considered an important public health problem worldwide.1 Evidence consistently reports that
there is a greater likelihood of overweight and obese ado-lescents to become obese adults.2 In this context, obesity
in childhood and in adolescence is considered an indepen-dent risk factor in the development of cardiovascular dis-eases in adulthood.3
Numerous methods have been used to assess body com-position.4 Among indirect methods, hydrostatic weighing
and dual energy X-ray absorptiometry (DEXA) stand out; however, they are more difficult to be used in large sam-ples due to the high cost and the need for a qualified tech-nical team for assessing the measurements.5 Among double
indirect methods, anthropometry is considered a simple, rapid, inexpensive method that can be applied to a great number of individuals.6
Many anthropometric indicators have been proposed to diagnose the health risks taking into account the increased body fat.7 The most widely used is still the body mass index
(BMI), but it has some limitations.8 However, other
indica-tors have been recommended. Waist circumference (WC) is one of the measures proposed to achieve results closer to reality, since abdominal fat deposits also cause, alone, var-ious health problems.9 The waist-to-height ratio (WHtR)10
and the conicity index (C-Index) have also been used as indicators to diagnose body fat.
Some studies have been conducted with children and adolescents in order to analyze the performance of anthro-pometric indicators (BMI, WC, WHtR) in the diagnosis of
excess body fat.11-14 In Brazil, few studies have investigated
the ability of each indicator to detect excess body fat in adolescents,15,16 however, studies using anthropometric
indicators to predict high blood pressure17 and hypertension
stand out.18 Both in Brazil and in other countries, no studies
investigating the C-Index for the prediction of high body fat were found. In this sense, there are discussions about what would be the best anthropometric index for predicting high body fat, regardless of sex, age and total body fat. Therefore, more empirical evidence is needed, especially in adolescence. Thus, this study aims to verify the diagnos-tic performance of anthropometric indicators of obesity in the prediction of high body fat in adolescents.
Methods
This cross-sectional epidemiological study included school-children aged 15-17 years enrolled in public schools (state and federal) in the Brazilian state of Santa Catarina. The study was approved by the Ethics Committee on Human Research of the Federal University of Santa Catarina (pro-tocol number 372/2006) and University of Western Santa Catarina (protocol number 079/08).
To conduct the survey, two regions were considered: 1) a survey was conducted in 2007 in Florianópolis, capital of the state of Santa Catarina, located in southern Brazil. Florianópolis has a population of approximately 420,000 inhabitants,19 and is considered one of the Brazilian cities
with the highest human development index (HDI=0.875).20
58 Pelegrini A et al
Santa Catarina, one of the mesoregions of the state.19 The
western region of Santa Catarina has an HDI of 0.807.20
Among the top 20 cities in quality of life in Brazil, five are from the western region of Santa Catarina, which has an estimated population of 25,322 inhabitants.19
The sample was calculated separately for each region. The following parameters were used: prevalence for the outcome of 50% (unknown prevalence), tolerable error of five percentage points, confidence level of 95%, and a delimitation effect of 1.5, adding 10% for possible losses/ refusals. Thus, 634 adolescents in each region were evalu-ated, composing a total sample of 1,268 adolescents.
In Florianópolis, the sampling process was determined in two stages: stratified by geographic region and conglomer-ate groups. In the first stage, the city was divided into five geographical regions: center, continent, east, north and south. The school with the largest number of students from each region was selected, and in each school, classes were randomly selected to represent a sample representative of the geographic area. In the second stage, all adolescents who were present in classroom on the day of data collec-tion were invited to participate in the study.
In the Midwestern region of Santa Catarina, the sampling process was determined in two stages: stratified by public high schools and classes conglomerates. In the first stage, only schools with over 150 students were considered. Moreover, in cities with more than one teaching unit, we chose the one with the highest number of students. In the second stage, all adolescents who were present in class-room on the day of data collection were invited to partici-pate in the study.
For this investigation, we defined as eligible the students enrolled in public state schools, those present in the class-room on the day of data collection and those aged 15-17 years. The exclusion criteria were: (a) students either <15 or >17 years old; (b) students who did not bring the Free and Informed Consent Form (FICF) signed by parents and/ or guardian; (c) students who refused to participate; (d) students who did not perform anthropometric measure-ments.
Fieldwork was conducted by Physical Education teachers and students, trained to carry out all the necessary proce-dures in order to standardize data collection. School stu-dents were instructed on evaluations at least five days in advance. At that time, the FICF was presented and they were informed about the procedures for the tests. The data collection team was trained in order to standardize the anthropometric measurements. The technical error of mea-surement was not calculated, but the researcher responsi-ble for the survey had extensive experience in anthropo-metric measurements and routinely performed the quality control of the team of evaluators.
Anthropometric body mass data – weight and height, waist circumference, triceps skinfold thickness (TSFT) and medial calf skinfold thickness (MCST) were measured according to standardized procedures.21 Body mass index
(BMI) was calculated and ranked according to cutoff points for adolescents, which vary according to age and gender.22
Abdominal obesity was verified by measuring waist circum-ference. WHtR was assessed by the waist x height ratio in cm. C-Index was determined by measuring body mass
(weight and height) and waist circumference, using the Valdez mathematical equation.23
Body fat was verified by the relative body fat – % BF,24 for boys and girls, using the sum (Σ2DC) of TSFT and MCST, as
shown below:
Boys Girls
%G=0.735*(TSFT+MCST)+1.0 %G=0.610*(TSFT+MCST)+5.1 %G, relative body fat; TSFT, triceps skinfold thickness; MCST, medial calf skinfold thickness.
The cutoff points used for the classification of body fat were those recommended by Lohman,25 according to
gen-der and age, in which values higher than 20 for boys and 25 for girls were considered high.
Mean and standard deviation were used in the descrip-tive analysis of variables. The Kolmogorov-Smirnov test was used to verify data normality. Differences in the aver-ages of variables between genders were analyzed by the Mann Whitney test. Association between anthropometric indicators and gender was assessed by the chi-square test. To evaluate the diagnostic performance of BMI, WHtR and C-Index in detecting excess body fat, the ROC curve anal-ysis was applied. The diagnostic accuracy refers to the ability of BMI, WHtR and C-Index to discriminate adoles-cents with excess body fat from those without excess body fat. Areas under the ROC curve and confidence intervals were determined. To better determine the optimal critical values of anthropometric indicators with greater accuracy in the overweight detection, sensitivity and specificity were considered for each gender. The significance level was set at p<0.05. Analyses were performed using SPSS (Statistical Package for Social Sciences) 20.0 version and MedCalc.
Results
The study showed a response rate of 94.4% (n=1,197), with 478 male and 719 female adolescents aged 15-17 years. The sample characteristics are presented in Table 1. Boys had higher body mass, height, WC, WHtR and C-Index, while girls had higher averages of TSFT, MCST, sum of two
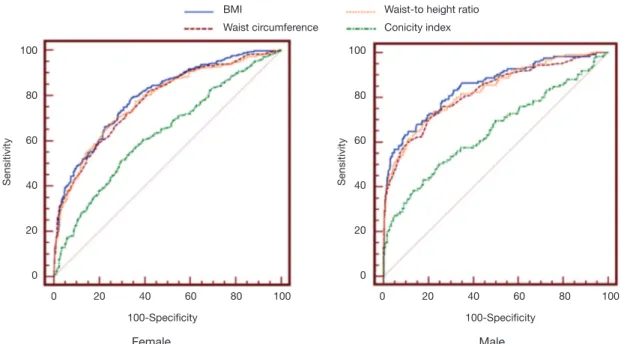
skinfolds (Σ2DC) and fat percentage (BF%) (p<0.05). The values of the area under the ROC curve, cutoff points, sensitivity and specificity are presented (Table 2) for all anthropometric indicators as discriminators of high relative body fat. All anthropometric indicators analyzed showed predictive ability to identify subjects with high body fat (i.e. lower limit of CI95% of the area under the ROC curve >0.50). BMI, WHtR and WC had greater ability to discriminate body fat in both genders compared to the C-Index (Table 2).
Table 1 General characteristics of the sample ±. Male (n=478) ±
Female (n=719)
±
p valueBody Mass (kg) 64.52 (11.69) 55.27 (9.71) <0.001
Height (cm) 173.81 (7.50) 162.33 (6.10) <0.001
BMI (kg/m²) 21.32 (3.45) 20.95 (3.33) 0.056
WC (cm) 72.72 (7.68) 67.20 (7.23) <0.001
WHtR 0.42 (0.04) 0.41 (0.05) 0.030
TSFT (mm) 10.14 (4.57) 16.39 (5.68) <0.001
MCST (mm) 11.28 (5.53) 17.92 (6.47) <0.001
Σ2DC (mm) 21.42 (9.57) 34.27 (11.28) <0.001
%BF 16.74 (7.04) 26.00 (6.88) <0.001
C-Index 1.10 (0.05) 1.06 (0.06) <0.001
BMI, body mass index; WC, waist circumference; WHtR, waist/height ratio; TSFT, triceps skinfold thickness; MCST, medial calf skinfold thickness; Σ2DC, sum of two skinfolds; % BF, relative body fat; C-Index, conicity index
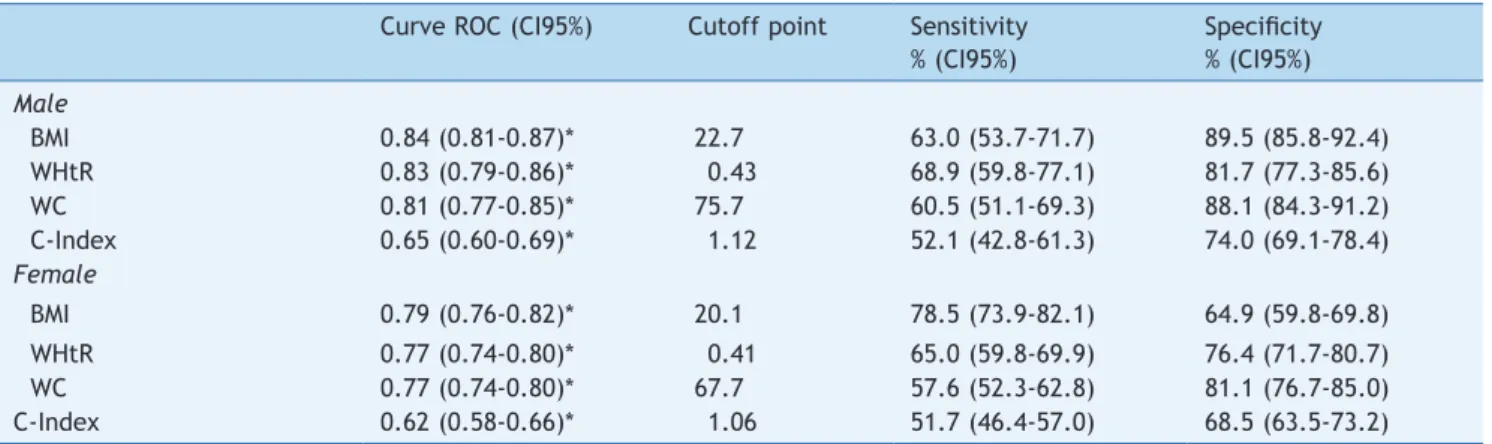
Table 2 Diagnostic properties of anthropometric indicators of obesity to detect high body fat percentage in adolescents according to gender.
Curve ROC (CI95%) Cutoff point Sensitivity % (CI95%)
Speciicity % (CI95%) Male
BMI 0.84 (0.81-0.87)* 22.7 63.0 (53.7-71.7) 89.5 (85.8-92.4)
WHtR 0.83 (0.79-0.86)* 0.43 68.9 (59.8-77.1) 81.7 (77.3-85.6)
WC 0.81 (0.77-0.85)* 75.7 60.5 (51.1-69.3) 88.1 (84.3-91.2)
C-Index 0.65 (0.60-0.69)* 1.12 52.1 (42.8-61.3) 74.0 (69.1-78.4)
Female
BMI 0.79 (0.76-0.82)* 20.1 78.5 (73.9-82.1) 64.9 (59.8-69.8)
WHtR 0.77 (0.74-0.80)* 0.41 65.0 (59.8-69.9) 76.4 (71.7-80.7)
WC 0.77 (0.74-0.80)* 67.7 57.6 (52.3-62.8) 81.1 (76.7-85.0)
C-Index 0.62 (0.58-0.66)* 1.06 51.7 (46.4-57.0) 68.5 (63.5-73.2)
CI95%, conidence interval; BMI, body mass index; WC, waist circumference; WHtR, waist/height ratio; C-Index, conicity index. *: area under the ROC curve demonstrating discriminatory power for body fat (lower limit of CI95%>0.50).
Discussion
All anthropometric indicators were able to diagnose excess body fat, as they showed the lowest limit of 95% of the area under the ROC curve up to 0.50. However, BMI, WHtR and WC had greater ability to discriminate body fat in both genders compared to the C-Index. These results show that not only indicators of general obesity (BMI), but also indi-cators of central obesity (WC, WHtR) can be used in adoles-cents to diagnose high body fat.
These results were similar to those presented by Brazilian adults in relation to the C-Index, which is an anthropomet-ric indicator with low discriminatory power for health prob-lems compared to other anthropometric indicators.26 The
C-index was a good predictor for chronic non-communica-ble diseases.27
WC and WHtR had enough similarity to discriminate body fat in this study. A study conducted in southern Brazil also revealed that these anthropometric indicators showed
sim-ilarity to predict blood hypertension.26 The similarity
between these indicators lies in the fact that both deal with fat located in the central region.10 This study also
reported that BMI was similar to WC and WHtR to detect the adiposity anthropometric indicator, which shows that during adolescence this measure may be useful for diagnos-ing obesity.10
The findings of this study have vital implications for the assessment of obesity among adolescents, since it reinforc-es the use of anthropometric indicators of obreinforc-esity, which are relatively simple to be evaluated, as a discriminator of body fat. There is no doubt that the assessment of body composition by skinfold is more accurate than using anthro-pometric indicators, as shown by Nooyens et al.28 However,
the measurement of skinfolds requires trained evaluators to provide accurate measurements. Thus, the World Health Organization29 recommends the use of simpler
60 Pelegrini A et al
Research conducted with Spanish children and adoles-cents revealed that BMI, triceps skinfold thickness and WC were good anthropometric indicators in the diagnosis of total body fat assessed by the doubly labeled water meth-od.13 In North American children and adolescents (5-18
years old), it was shown that both BMI and fat percentage (derived from skinfolds) are low cost, viable indicators that can be used for screening excess body adiposity.30 BMI and
WC provided better diagnostic in screening obesity (mea-sured by plethysmography) in adolescents than the waist-hip circumference ratio (WHtR) in Swedish adolescents.14
Based on the results of this study and those found in liter-ature, it could be inferred that for adolescents anthropo-metric indicators of general obesity and central obesity are both good predictors of high body fat.
The best cutoff point for BMI to detect the emergence of high body fat was 22.7kg/m² for boys and 20.1kg/m² for girls. Usually, the cutoff points for BMI in adolescents vary according to gender and age.22,31 A study that developed
cutoff points for BMI in a sample of Brazilian adolescents reported that in the age group of this study (14-17 years old), BMI for overweight ranged from 21.7kg/m² to 23.6kg/ m² for males and from 22.8kg/m² to 24.8kg/m² for females. For obesity, the mentioned study reported that for males the cutoff point for BMI ranged from 27.5kg/m² to 28.7kg/ m² and for females the cuttoff point ranged from 27.5kg/ m² to 29.6kg/m². In the study by Cole et al,22 who
devel-oped cutoff points for BMI in a sample of children and ado-lescents from six countries (Brazil, Great Britain, Hong Kong, the Netherlands, Singapore and the United States), BMI for overweight ranged from 22.6kg/m² to 24.5kg/m² for males and 23.3kg/m² to 24.7kg/m² for females. For obesity, the cutoff point for BMI ranged from 27.6kg/m² to 29.4kg/m² for males and the cuttoff point for females ranged from 28.6kg/m² to 29.7kg/m². It was observed that
the cutoff point for BMI for males in this study is in the overweight range of other studies.22,31 Moreover, the cutoff
point for BMI in this study for females is below those found in literature to detect overweight. One possible explana-tion for these discrepancies may be related to ethnic and cultural differences in Brazilian adolescents that may influ-ence BMI.
As for WC, it was observed that the best cutoff point to detect the emergence of high body fat was 75.7cm and 67.7cm for boys and girls, respectively. Fernandez et al,32
when developing cutoff points for WC in a sample represen-tative of children and adolescents of different ethnicities (African Americans, European Americans and Mexican Americans) found that, in the age group of this study, WC ranged from 79.4cm to 87.0cm for males and from 78.3cm to 85.5cm for females. It was also observed that the cutoff points found for adolescents of this investigation are lower than those of other studies.32 Evidence shows that, among
the anthropometric indicators, WC had the best perfor-mance in the diagnosis of obesity in children and adoles-cents.11,14
Regarding WHtR, the best cutoff point to detect the emergence of high body fat was 0.43cm and 0.41cm for males and females, respectively. Studies conducted with Italian33 and African adolescents34 found that the best
diag-nostic value of WHtR for metabolic risk was 0.41, which is similar to the findings of this study, and lower than what is internationally proposed (0.50). Moreover, this indicator has been considered one of the best in the evaluation of central fat distribution, and it is associated with various cardiovascular risk factors.10 As for predicting high body
fat, it is possible to observe that WHtR has been considered a simple, easy-to-use, accurate indicator, with high appli-cability in screening overweight and obesity in children and adolescents.12
100
80
60
40
20
0
100
80
60
40
20
0
0 20 40 60 80 100 0 20 40 60 80 100
100-Specificity BMI
Waist circumference
Waist-to height ratio
Conicity index
100-Specificity
Sensitivity Sensitivity
Female Male
The best cutoff point for the C-Index was 1.12 for boys and 1.06 for girls. Publications on the prediction of high body fat through the C-Index were not found, which makes it difficult to compare the results found in this study. However, cutoff points for the C-Index were developed to detect high blood pressure (boys=1.13 and girls=1.14), high levels of total cholesterol (boys=1.10) and low levels of HDL-c (girls=1.10).35
Among the limitations of the study, the use of double indirect measures (skinfold) to establish the criterion mea-sure of body fat can be highlighted; however, in the assess-ment of nutritional status and body composition in children and adolescents, such measures are commonly used and recommended by health agencies.29
According to the findings of this study, it could be con-cluded that anthropometric indicators can be used in screening to identify high body fat in adolescents for being a simple, inexpensive and non-invasive method. These find-ings reinforce the possibility of using anthropometric indi-cators as an alternative to evaluate adolescents, through simple, replicable and reliable criteria, with high sensitivi-ty and specificisensitivi-ty at low cost, which allows greater range in the scope of monitoring nutritional and health status among adolescents.
Conlicts of interest
The authors declare no conflicts of interest.
References
1. Bambra CL, Hillier FC, Moore HJ, Summerbell CD. Tackling inequalities in obesity: a protocol for a systematic review of the effectiveness of public health interventions at reducing socioeconomic inequalities in obesity amongst children. Syst Rev. 2012;1:16.
2. Goldhaber-Fiebert JD, Rubinfeld RE, Bhattacharya J, Robinson TN, Wise PH. The utility of childhood and adolescent obesity assessment in relation to adult health. Med Decis Making. 2013;33:163-75.
3. Lloyd LJ, Langley-Evans SC, McMullen S. Childhood obesity and risk of the adult metabolic syndrome: a systematic review. Int J Obes. 2012;36:1-11.
4. Sant’Anna MS, Priore SE, Franceschini SC. Methods of body composition evaluation in children. Rev Paul Pediatr. 2009;27:315-21.
5. Ellis KJ. Human body composition: in vivo methods. Physiol Rev. 2000;80:649-80.
6. Carvalho AB, Pires-Neto CS. Body composition by underwater weighing and bioelectrical impedance methods in college students. Rev Bras Cineantropom Des Hum. 1999;1:18-23. 7. Sigulem DM, Devincenzi MU, Lessa AC. Diagnosis of child and
adolescent nutritional status. J Pediatr (Rio J). 2000;76 (Suppl 3):S275-84.
8. Neovius M, Linné Y, Barkeling B, Rössner S. Discrepancies between classiication systems of childhood obesity. Obes Rev. 2004;5:105-14.
9. Imai A, Komatsu S, Ohara T, Kamata T, Yoshida J, Miyaji K, et al. Visceral abdominal fat accumulation predicts the progression of noncalciied coronary plaque. Atherosclerosis. 2012;222:524-9.
10. Flegal KM, Shepherd JA, Looker AC, Graubard BI, Borrud LG, Ogden CL, et al. Comparisons of percentage body fat, body mass index, waist circumference, and waist-stature ratio in adults. Am J Clin Nutr. 2009;89:500-8.
11. Hubert H, Guinhouya CB, Allard L, Durocher A. Comparison of the diagnostic quality of body mass index, waist circumference and waist-to-height ratio in screening skinfold-determined obesity among children. J Sci Med Sport. 2009;12:449-51. 12. Weili Y, He B, Yao H, Dai J, Cui J, Ge D, et al. Waist-to-height ratio
is an accurate and easier index for evaluating obesity in children and adolescents. Obesity (Silver Spring). 2007;15:748-52. 13. Sarría A, Moreno LA, García-Llop LA, Fleta J, Morellón MP,
Bueno M. Body mass index, triceps skinfold and waist circumference in screening for adiposity in male children and adolescents. Acta Paediatr. 2001;90:387-92.
14. Neovius M, Linné Y, Rossner S. BMI, waist-circumference and waist-hip ratio as diagnostic tests for fatness in adolescents. Int J Obes (Lond). 2005;29:163-9.
15. Lunardi CC, Petroski EL. Body mass index, waist circumference and skinfolds for predicting lipid abnormalities in 11 years old children. Arq Bras Endocrinol Metab. 2008;52:1009-14. 16. Campagnolo PD, Hoffman DJ, Vitolo MR. Waist-to-height ratio
as a screening tool for children with risk factors for cardiovascular disease. Ann Hum Biol. 2011;38:265-70. 17. Fernandes RA, Christofaro DG, Buonani C, Monteriro HL, Cardoso
JR, Freitas IF Jr, et al. Performance of body fat and body mass index cutoffs in elevated blood pressure screening among male children and adolescents. Hypertens Res. 2011;34:963-7. 18. Christofaro DG, Ritti-Dias RM, Fernandes RA, Polito MD, Andrade
SM, Cardoso JR, et al. High Blood pressure detection in adolescents by clustering overall and abdominal adiposity markers. Arq Bras Cardiol. 2011;96:465-70.
19. Brasil – Instituto Brasileiro de Geograia e Estatística [homepage on the Internet]. IBGE cidades [accessed 22 October 2010]. Available from: http://www.ibge.gov.br/cidadesat.
20. Organização das Nações Unidas [homepage on the Internet]. Ranking IDHM Municípios 2010 [accessed 10 June 2010]. Available from: http://www.pnud.org.br/atlas/ranking/ Ranking-IDHM-Municipios-2010.aspx.
21. Canadian Society for Exercise Physiology (CSEP). The Canadian physical activity, itness and lifestyle ppraisal: CSEP’s guide to health active living. 2nd ed. Ottawa: CSEP; 2003.
22. Cole TJ, Bellizzi MC, Flegal KM, Dietz WH. Establishing a standard deinition for child overweight and obesity worldwide: international survey. BMJ. 2000;320:1240-3.
23. Valdez R. A simple model-based index of abdominal adiposity. J Clin Epidemiol. 1991;44:955-6.
24. Slaughter MH, Lohman TG, Boileau RA, Horswill CA, Stillman RJ, Van Loan MD, et al. Skinfold equations for estimation of body fatness in children and youth. Hum Biol. 1988;60:709-23. 25. Lohman TG. Applicability of body composition techniques and
constants for children and youths. Exerc Sport Sci Rev. 1986;14:537-57.
26. Silva DA, Petroski EL, Peres MA. Accuracy and measures of association of anthropometric indexes of obesity to identify the presence of hypertension in adults: a population-based study in Southern Brazil. Eur J Nutr. 2013;52:237-46.
27. Pitanga FJ, Lessa I. Anthropometric indexes of obesity as an instrument of screening for high coronary risk in adults in the city of Salvador- Bahia. Arq Bras Cardiol. 2005;85:26-31. 28. Nooyens AC, Koppes LL, Visscher TL, Twisk JW, Kemper HC,
Schuit AJ, et al. Adolescent skinfold thickness is a better predictor of high body fatness in adults than is body mass index: the Amsterdam growth and health longitudinal study. Am J Clin Nutr. 2007;85:1533-9.
62 Pelegrini A et al
[accessed 24 June 2014]. Available from: http://www.who.int/ childgrowth/publications/physical_status/en/.
30. Laurson KR, Eisenmann JC, Welk GJ. Body Mass Index standards based on agreement with health-related body fat. Am J Prev Med. 2011;41 (4 Suppl 2):S100-5.
31. Conde WL, Monteiro CA. Body mass index cutoff points for evaluation of nutritional status in Brazilian children and adolescents. J Pediatr (Rio J). 2006;82:266-72.
32. Fernández JR, Redden DT, Pietrobelli A, Allison DB. Waist circumference percentiles in nationally representative samples of African-American, European-American, and Mexican-American children and adolescents. J Pediatr. 2004;145:439-44.
33. Kruger HS, Faber M, Schutte AE, Ellis SM. A proposed cutoff point of waist-to-height ratio for metabolic risk in African township adolescents. Nutrition. 2013;29:502-7.
34. Papalia T, Greco R, Lofaro D, Mollica A, Roberti R, Bonoiglio R. Anthropometric measures can better predict high blood pressure in adolescents. J Nephrol. 2013;26:899-905.