Article
Increased Risk of Diabetes Development in Subjects with
the Hypertriglyceridemic Waist Phenotype: A 4-Year
Longitudinal Study
Ki Joong Han, Shin Yeoung Lee, Nam Hee Kim, Hyun Beom Chae, Tae Hoon Lee, Choel Min Jang, Kyung Mo Yoo, Hae Jung Park, Min Kyung Lee, Won Seon Jeon, Se Eun Park, Cheol-Young Park, Won-Young Lee, Ki-Won Oh, Sung-Woo Park, Eun-Jung Rhee
Department of Endocrinology and Metabolism, Kangbuk Samsung Hospital, Sungkyunkwan University School of Medicine, Seoul, Korea
Background: The hypertriglyceridemic waist (HTGW) phenotype is a simple and inexpensive screening parameter to identify peo-ple at increased risk of cardiovascular disease. We evaluated whether the HTGW phenotype predicts diabetes in urban Korean adults. Methods: A total of 2,900 nondiabetic subjects (mean age 44.3 years), comprising 2,078 males (71.7%) and 822 females (28.3%) who underwent annual medical check-ups at our center between January 2005 and December 2009, were recruited. The subjects were divided into four groups according to baseline serum triglyceride (TG) level and waist circumference (WC): normal WC-nor-mal TG (NWNT) level, norWC-nor-mal WC-high TG level, enlarged WC-norWC-nor-mal TG level, and enlarged WC-high TG (EWHT) level. High serum TG level was defined as ≥150 mg/dL and enlarged WC was defined as ≥90 cm for men and ≥85 cm for women. New cases of diabetes were determined according to questionnaires filled in by participants and the diagnostic criteria of the Amer-ican Diabetes Association. Cox proportional hazards model analysis was used to assess the association of HTGW phenotype with the incidence of diabetes.
Results: A total of 101 (3.5%) new diabetes cases were diagnosed during the study period. The EWHT group had a higher inci-dence of diabetes (8.3%) compared with the NWNT group (2.2%). The adjusted hazard ratio for diabetes for subjects with the EWHT phenotype at baseline was 4.113 (95% confidence interval [CI], 2.397 to 7.059) after adjustment for age, and 2.429 (95% CI, 1.370 to 4.307) after adjustment for age, sex, total cholesterol, systolic blood pressure, and alcohol drinking history. It was at-tenuated by inclusion of baseline fasting glucose level in the model.
Conclusion: Subjects with the HTGW phenotype showed the highest risk of incident diabetes. This tool could be useful for iden-tifying individuals at high risk of diabetes.
Keywords: Hypertriglyceridemic waist phenotype; Hypertriglyceridemia; Waist circumference; Diabetes; Metabolic syndrome
Received: 20 April 2014, Revised: 2 June 2014,
Accepted: 3 June 2014
Corresponding author: Eun-Jung Rhee
Department of Endocrinology and Metabolism, Kangbuk Samsung Hospital, Sungkyunkwan University School of Medicine, 29 Saemunan-ro, Jongno-gu, Seoul 110-746, Korea
Tel: +82-2-2001-2485, Fax: +82-2-2001-1588, E-mail: [email protected]
Copyright © 2014 Korean Endocrine Society
INTRODUCTION
Diabetes has become one of the major public-health challenges worldwide, owing to a westernized lifestyle [1]. Diabetes and its complications have become a major cause of morbidity and mor-tality in most developing and developed countries. Recently, the International Diabetes Federation (IDF) estimated that in 2011 there were 366 million people worldwide with diabetes, and pre-dicted that this figure will rise to 552 million by 2030 [1]. As dia-betes becomes more prevalent, its social and economic costs will become one of the major problems for patients and society [2,3]. To slow the markedly increasing rate of diabetes, it is important to identify and treat risk factors for diabetes.
The pathogenesis of type 2 diabetes mellitus (T2DM) is het-erogeneous, and both genetic factors affecting insulin release and responsiveness and environmental factors, such as obesity, are important for its development. In 1988, Reaven [4] pro-posed that insulin resistance is a fundamental disorder associat-ed with a cluster of diabetogenic, atherogenic, prothrombotic, and inflammatory metabolic abnormalities now called meta-bolic syndrome (MetS). Recently, the criteria for MetS from the National Cholesterol Education Program-Adult Treatment Panel III (NCEP-ATP III) [5] and IDF [6] are most widely used as screening tools to identify subjects with features of MetS. The MetS definition proposed by the IDF acknowledges the importance of central obesity in MetS by making it a required component for clinical diagnosis.
As waist circumference (WC) cannot fully discriminate vis-ceral adiposity from subcutaneous abdominal adiposity, elevat-ed triglyceride (TG) levels have been adoptelevat-ed as a marker of dysfunctional visceral adipose tissue [7-9]. Lemieux et al. [9] were the first group to recognize that the hypertriglyceridemia plus large WC (hypertriglyceridemic waist, HTGW) phenotype is associated with increased cardiovascular disease (CVD) risk. In particular, the HTGW is associated with the atherogenic triad of hyperinsulinemia, elevated concentrations of apolipoprotein B and small, dense low density lipoprotein cholesterol (sdLDL-C) particles. Lemieux et al. [9] also suggested that visceral obe-sity and the HTGW phenotype are the central components of MetS. Recent evidence now indicates that MetS begins with ex-cess central adiposity [10]. Therefore, the HTGW phenotype could be used as a simple and inexpensive screening tool to identify people at increased risk of MetS, T2DM, and CVD [9,11-14].
As most of previous studies were performed in only Cauca-sians, we designed this study to compare the risk for diabetes
development among the groups divided by HTGW phenotypes with a median follow-up of 48.7 months in a large cohort of nondiabetic Korean subjects who participated in a medical check-up program.
METHODS
Subjects
This was a retrospective study, and the subjects were partici-pants in the Kangbuk Samsung Health Study, a large database of participants in a medical health check-up program at the Health Promotion Center of Kangbuk Samsung Hospital, Sung-kyunkwan University School of Medicine, Seoul, Korea. The purpose of the medical health check-up program is to promote the health of employees through regular health check-ups and to enhance early detection of existing diseases. Most of the ex-aminees are employees of various industrial companies from all around the country and their family members. The costs of the medical examinations are largely paid for by their employ-ers, and a considerable proportion of the examinees undergo examinations annually or biannually.
Initial data were obtained from 10,868 subjects in whom an-nual health check-ups were performed for 5 consecutive years between January 2005 and December 2009. Among these sub-jects, 7,968 were excluded due to the presence of diabetes or missing data, especially for WC and lipid profiles. The final analyses were performed in 2,900 subjects (2,078 men [71.7%] and 822 women [28.3%]) with a mean age of 44.3 years. The participants provided their written informed consent for the usage of the medical check-up data for the research. The design, protocol and the consent procedure of this study were reviewed and approved by Institutional Review Board of Kangbuk Samsung Hospital (KBS12089) and is in accordance with the Helsinki Declaration of 1975.
Anthropometric and laboratory measurements
Height and weight were measured twice and then averaged. Body mass index (BMI) was calculated by dividing the weight (kg) by the square of the height (m). Blood pressure (BP) was measured using a standardized sphygmomanometer after 5 minutes of rest. The WC was measured in the standing posi-tion, at the middle point between anterior iliac crest and the lower border of the ribs by a single examiner. Values for WC were only available for 2,900 subjects due to inconsistency of the measurement method.
hexokinase method was used to measure fasting glucose con-centrations (Hitachi Modular D2400, Roche, Tokyo, Japan). Fasting serum insulin concentrations were determined by elec-trochemiluminescence immunoassay (Hitachi Modular E170, Roche). An enzymatic calorimetric test was used to measure se-rum total cholesterol (TC) and TG concentrations. The selective inhibition method was used to measure the level of high density lipoprotein cholesterol (HDL-C), and a homogeneous enzymat-ic calorimetrenzymat-ic test was used to measure the level of LDL-C. HbA1c was measured by immunoturbidimetric assay with a Cobra Integra 800 automatic analyzer (Roche Diagnostics, Ba-sel, Switzerland) with a reference value of 4.4% to 6.4%. The methodology was aligned with the Diabetes Control and Com-plications Trial and National Glycohemoglobin Standardization Program (NGSP) standards [15]. The intra-assay coefficient of variation (CV) was 2.3% and the interassay CV was 2.4%; both were within the NGSP acceptable limits [16].
Subjects with underlying diabetes at baseline were excluded from the study. The presence of diabetes mellitus was deter-mined according to questionnaires filled in by participants and the diagnostic criteria of the American Diabetes Association [17]. Development of diabetes was assessed in each year’s ex-amination with the same diagnostic criteria for diabetes melli-tus. HOMA-IR was calculated as follows: HOMA-IR=[fasting
insulin (IU/mL)×fasting glucose (mmol/L)]/22.5 [18].
The presence of hypertension was defined by criteria recom-mended by the seventh report of the Joint National Committee on Prevention, Detection, Evaluation, and Treatment of High Blood Pressure (JNC 7) [19]: BP ≥140/90 mm Hg or current antihypertensive medication use. Alcohol drinking was defined by drinking more than three times a week in the self-adminis-tered questionnaire.
Diagnosis of MetS was based on two criteria:
1) Modified NCEP-ATP III [5]: three or more of the follow-ing components: (1) abdominal obesity: WC ≥90 cm in men, ≥85 cm in women [20]; (2) elevated blood pressure: systolic blood pressure (SBP) ≥130 mm Hg or diastolic blood pressure (DBP) ≥85 mm Hg, or treatment for previously diagnosed hy-pertension; (3) elevated fasting plasma glucose: ≥100 mg/dL (≥5.6 mmol/L) or previously diagnosed type 2 diabetes; (4) hypertriglyceridemia: TG ≥150 mg/dL (≥1.7 mmol/L); (5) re-duced HDL-C: <40 mg/dL (<1.03 mmol/L) in men and <50
mg/dL (<1.29 mmol/L) in women.
2) IDF [6]: the presence of abdominal obesity (WC ≥90 cm in men, ≥85 cm in women [20]) plus two of following compo-nents: (1) elevated blood pressure: SBP ≥130 mm Hg or DBP
≥85 mm Hg, or treatment for previously diagnosed hyperten-sion; (2) elevated fasting plasma glucose: ≥100 mg/dL (≥5.6 mmol/L) or previously diagnosed type 2 diabetes; (3) hypertri-glyceridemia: TG ≥150 mg/dL (≥1.7 mmol/L); (4) reduced HDL-C: <40 mg/dL (<1.03 mmol/L) in men and <50 mg/dL
(<1.29 mmol/L) in women.
HTGW was diagnosed using anthropometric criteria for the Korean population [19] (WC: ≥90 cm for men and ≥85 cm for women) and fasting plasma TG ≥150 mg/dL.
According to the above criteria, participants were divided into four groups: 1) normal WC, normal TG (NWNT): WC
<90 cm in men, WC <85 cm in women, and TG <150 mg/dL;
2) normal WC, high TG (NWHT): WC <90 cm in men, WC <85 cm in women, and TG ≥150 mg/dL; 3) enlarged WC, normal TG (EWNT): WC ≥90 cm in men, WC ≥85 cm in women, and TG <150 mg/dL; 4) enlarged WC, high TG
(EWHT): WC ≥90 cm in men, WC ≥85 cm in women, and TG ≥150 mg/dL.
Statistical analysis
All data were analyzed using SPSS version 18.0 (IBM Co., Ar-monk, NY, USA). Comparisons of the variables among the four groups divided by baseline TG level and WC were per-formed by one-way analysis of variance. Data that did not fol-low a normal distribution were analyzed after logarithmic transformation. Comparisons of adjusted hazard ratios (aHRs) for incident diabetes in the four groups divided by baseline TG level and WC were analyzed by Cox proportional hazards model analysis after adjustment for confounding baseline vari-ables. Kaplan-Meier survival analyses were performed for inci-dent diabetes for 4 years according to baseline TG level and WC. Statistical significance was defined as P<0.05.
RESULTS
Study population and baseline characteristics
The mean age of the participants was 44.3 years (Table 1). At baseline, 1,790 subjects (61.7%) were in the NWNT group, 615 (21.2%) in the NWHT group, 255 (8.8%) in the EWNT group, and 240 (8.3%) in the EWHT group.
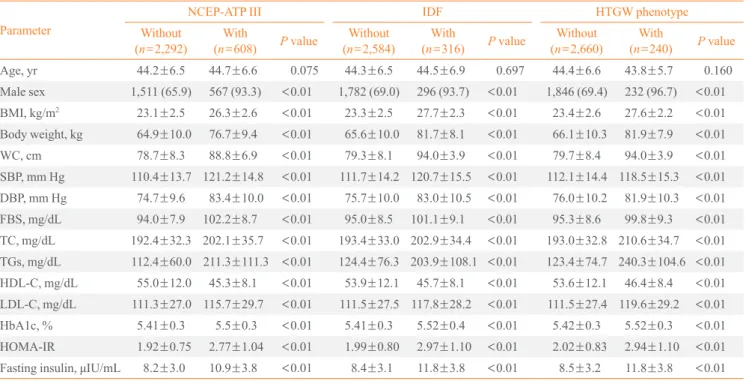
were higher in subjects satisfying the MetS criteria compared with subjects with the HTGW phenotype, irrespective of the definition used (P<0.01). Subjects with the HTGW phenotype
displayed worse lipid profiles, including lower HDL-C levels, higher TG levels, and higher fasting glucose concentrations, compared with subjects without this phenotype (P<0.05).
Similar results were shown in subjects with MetS defined by NCEP-ATP III and IDF criteria (P<0.01). The lipid profiles
showed similar findings among subjects who met the NCEP-ATP III and IDF criteria and who had the HTGW phenotype.
Hazard ratios for diabetes according to the groups divided by baseline WC and TG level
During a median follow-up of 48.7 months, 101 subjects (3.5 %) developed diabetes. Incidence rates for diabetes were 2.2%, 4.1%, 6.7%, and 8.3% in the NWNT, NWHT, EWNT, and EWHT groups, respectively (Table 1).
In a Cox proportional hazards model with diabetes develop-ment as the dependent variable, EWHT subjects had an aHR of 4.113 (95% confidence interval [CI], 2.397 to 7.059), EWNT
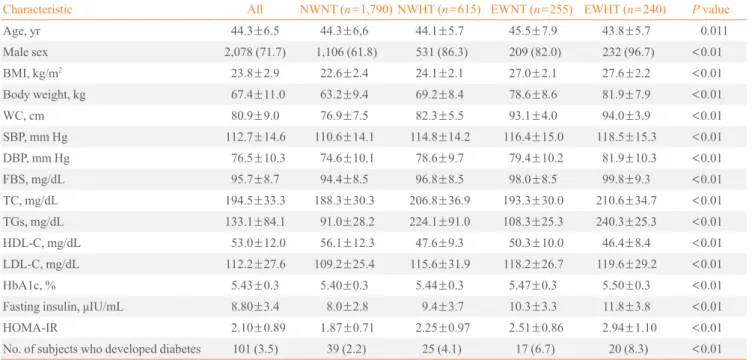
Table 1. Baseline Characteristics of Participants in the Four Groups Divided by Waist Circumference and Serum Triglyceride Levels
(n=2,900)
Characteristic All NWNT (n=1,790) NWHT (n=615) EWNT (n=255) EWHT (n=240) P value
Age, yr 44.3±6.5 44.3±6,6 44.1±5.7 45.5±7.9 43.8±5.7 0.011
Male sex 2,078 (71.7) 1,106 (61.8) 531 (86.3) 209 (82.0) 232 (96.7) <0.01
BMI, kg/m2 23.8±2.9 22.6±2.4 24.1±2.1 27.0±2.1 27.6±2.2 <0.01
Body weight, kg 67.4±11.0 63.2±9.4 69.2±8.4 78.6±8.6 81.9±7.9 <0.01
WC, cm 80.9±9.0 76.9±7.5 82.3±5.5 93.1±4.0 94.0±3.9 <0.01
SBP, mm Hg 112.7±14.6 110.6±14.1 114.8±14.2 116.4±15.0 118.5±15.3 <0.01
DBP, mm Hg 76.5±10.3 74.6±10.1 78.6±9.7 79.4±10.2 81.9±10.3 <0.01
FBS, mg/dL 95.7±8.7 94.4±8.5 96.8±8.5 98.0±8.5 99.8±9.3 <0.01
TC, mg/dL 194.5±33.3 188.3±30.3 206.8±36.9 193.3±30.0 210.6±34.7 <0.01
TGs, mg/dL 133.1±84.1 91.0±28.2 224.1±91.0 108.3±25.3 240.3±25.3 <0.01
HDL-C, mg/dL 53.0±12.0 56.1±12.3 47.6±9.3 50.3±10.0 46.4±8.4 <0.01
LDL-C, mg/dL 112.2±27.6 109.2±25.4 115.6±31.9 118.2±26.7 119.6±29.2 <0.01
HbA1c, % 5.43±0.3 5.40±0.3 5.44±0.3 5.47±0.3 5.50±0.3 <0.01
Fasting insulin, μIU/mL 8.80±3.4 8.0±2.8 9.4±3.7 10.3±3.3 11.8±3.8 <0.01
HOMA-IR 2.10±0.89 1.87±0.71 2.25±0.97 2.51±0.86 2.94±1.10 <0.01
No. of subjects who developed diabetes 101 (3.5) 39 (2.2) 25 (4.1) 17 (6.7) 20 (8.3) <0.01
Values are expressed as mean±SD or number (%).
NWNT, normal waist with normal plasma triglyceride level; NWHT, normal waist with hypertriglyceridemia; EWNT, enlarged waist with normal plasma triglyceride level; EWHT, enlarged waist with hypertriglyceridemia; BMI, body mass index; WC, waist circumference; SBP, systolic blood pressure; DBP, diastolic blood pressure; FBS, fasting blood glucose; TC, total cholesterol; TG, triglyceride; HDL-C, high density lipoprotein choles-terol; LDL-C, low density lipoprotein cholescholes-terol; HbA1c, glycated hemoglobin; HOMA-IR, homeostasis model assessment-insulin resistance.
1.0
0.9
0.8
0.7
0.6
NWNT
NWHT
EWNT
EWHT
Cumulative
disease-free survival
0 20 40 60 Months
subjects an aHR of 2.866 (95% CI, 1.616 to 5.083), and NWHT subjects an aHR of 1.942 (95% CI, 1.175 to 3.211) for diabetes after adjustment for age, with the NWNT group as the reference group (Table 3). Similar results were observed in model 2 (adjusted for age, sex, TC, SBP, and alcohol drinking history). In model 2, the aHR for diabetes was 2.429 (95% CI, 1.370 to 4.307) in the EWHT group, 2.390 (95% CI, 1.346 to 4.245) in the EWNT group and 1.328 (95% CI, 0.783 to 2.251)
in the NWHT group, with the NWNT group as the reference group. When baseline fasting glucose level was also included in the model (model 3), the risks were attenuated, with an aHR of 2.251 in the EWNT group and 1.569 in the EWHT group (Table 3). There was no interaction between serum TG level and WC for the development of diabetes (P=0.238).
In a Kaplan-Meier disease-free survival analysis, the EWHT group showed the lowest disease-free survival for diabetes
Table 2. Comparisons of Metabolic Parameters between Groups without or with Metabolic Syndrome and HTGW Criteria (n=2,900)
Parameter
NCEP-ATP III IDF HTGW phenotype
Without (n=2,292)
With
(n=608) P value
Without (n=2,584)
With
(n=316) P value
Without (n=2,660)
With
(n=240) P value Age, yr 44.2±6.5 44.7±6.6 0.075 44.3±6.5 44.5±6.9 0.697 44.4±6.6 43.8±5.7 0.160
Male sex 1,511 (65.9) 567 (93.3) <0.01 1,782 (69.0) 296 (93.7) <0.01 1,846 (69.4) 232 (96.7) <0.01
BMI, kg/m2
23.1±2.5 26.3±2.6 <0.01 23.3±2.5 27.7±2.3 <0.01 23.4±2.6 27.6±2.2 <0.01
Body weight, kg 64.9±10.0 76.7±9.4 <0.01 65.6±10.0 81.7±8.1 <0.01 66.1±10.3 81.9±7.9 <0.01
WC, cm 78.7±8.3 88.8±6.9 <0.01 79.3±8.1 94.0±3.9 <0.01 79.7±8.4 94.0±3.9 <0.01
SBP, mm Hg 110.4±13.7 121.2±14.8 <0.01 111.7±14.2 120.7±15.5 <0.01 112.1±14.4 118.5±15.3 <0.01
DBP, mm Hg 74.7±9.6 83.4±10.0 <0.01 75.7±10.0 83.0±10.5 <0.01 76.0±10.2 81.9±10.3 <0.01
FBS, mg/dL 94.0±7.9 102.2±8.7 <0.01 95.0±8.5 101.1±9.1 <0.01 95.3±8.6 99.8±9.3 <0.01
TC, mg/dL 192.4±32.3 202.1±35.7 <0.01 193.4±33.0 202.9±34.4 <0.01 193.0±32.8 210.6±34.7 <0.01
TGs, mg/dL 112.4±60.0 211.3±111.3 <0.01 124.4±76.3 203.9±108.1 <0.01 123.4±74.7 240.3±104.6 <0.01
HDL-C, mg/dL 55.0±12.0 45.3±8.1 <0.01 53.9±12.1 45.7±8.1 <0.01 53.6±12.1 46.4±8.4 <0.01
LDL-C, mg/dL 111.3±27.0 115.7±29.7 <0.01 111.5±27.5 117.8±28.2 <0.01 111.5±27.4 119.6±29.2 <0.01
HbA1c, % 5.41±0.3 5.5±0.3 <0.01 5.41±0.3 5.52±0.4 <0.01 5.42±0.3 5.52±0.3 <0.01
HOMA-IR 1.92±0.75 2.77±1.04 <0.01 1.99±0.80 2.97±1.10 <0.01 2.02±0.83 2.94±1.10 <0.01
Fasting insulin, μIU/mL 8.2±3.0 10.9±3.8 <0.01 8.4±3.1 11.8±3.8 <0.01 8.5±3.2 11.8±3.8 <0.01
Values are expressed as mean±SD or number (%).
NCEP-ATP III, National Cholesterol Education Program-Adult Treatment Panel III; IDF, International Diabetes Federation; HTGW, hypertriglyceri-demic waist; BMI, body mass index; WC, waist circumference; SBP, systolic blood pressure; DBP, diastolic blood pressure; FBS, fasting blood glu-cose; TC, total cholesterol; TG, triglyceride; HDL-C, high density lipoprotein cholesterol; LDL-C, low density lipoprotein cholesterol; HbA1c, gly-cated hemoglobin; HOMA-IR, homeostasis model assessment-insulin resistance.
Table 3. Adjusted Hazard Ratios for Diabetes according to the Four Groups Divided by Waist Circumference and Serum Triglyceride Level
Model 1 Model 2 Model 3
NWNT 1.00 1.00 1.00
NWHT 1.942 (1.175–3.211) 1.328 (0.783–2.251) 1.392 (0.765–2.228)
EWNT 2.866 (1.616–5.083) 2.390 (1.346–4.245) 2.251 (1.195–3.815)
EWHT 4.113 (2.397–7.059) 2.429 (1.370–4.307) 1.569 (0.817–2.602)
Model 1 was adjusted for age. Model 2 was adjusted for age, sex, total cholesterol, systolic blood pressure, and alcohol drinking history. Model 3 was adjusted for the factors adjusted for in model 2 plus fasting glucose level at baseline.
among the four groups. The EWNT group showed the second lowest disease-free survival (Fig. 1). The NWNT group showed the highest disease-free survival among the groups.
DISCUSSION
In this study, the EWHT group showed a significantly in-creased risk of diabetes development compared with the NWNT group during a median of 48.7 months of follow-up. In a Cox proportional hazards model, the EWHT group showed a significantly higher aHR for diabetes compared with the NWNT group, with a 4.1-fold increased risk in model 1 and a 2.4-fold increased risk in model 2. However, when baseline fasting glucose was included in the model, these effects were attenuated, suggesting the importance of fasting glucose in the development of diabetes. High TG levels and enlarged WC could have affected diabetes development through develop-ment of insulin resistance.
It is known that adipose tissue is not only an accumulation of fat cells but is also an active endocrine organ that secretes various adipocytokines that influence energy expenditure and metabolism in our body [21]. Furthermore, where adipose tis-sue is deposited affects metabolic function more than the actual amount. For example, visceral fat is the starting point for insu-lin resistance as it is more prone to lipolysis and releases free fatty acids into the circulation, whereas subcutaneous fat is known to protect against insulin resistance and obesity [22]. MetS is a cluster of various risk factors for CVDs [23]. Al-though multiple risk factors are included in the definition of MetS, the concept of MetS stems from insulin resistance and abdominal obesity. However, obesity is remarkably heteroge-neous. Some very obese patients have a fairly normal metabol-ic risk profile, despite their obesity. On the other hand, some moderately overweight individuals have a whole cluster of ath-erogenic and diabetogenic metabolic abnormalities. The recent concept of ‘metabolically healthy obesity’ refers to the sub-group of obese subjects who are metabolically healthy and pro-tected from CVDs [24-26].
In 2000, Lemieux et al. [8] suggested the concept of the ‘HTGW’ phenotype as the simultaneous presence of an elevat-ed fasting TG level and an enlargelevat-ed WC. They found that a moderately or substantially enlarged WC (WC ≥90 cm but
<100 cm and WC >100 cm) in the absence of an elevated TG
level was not enough to adequately discriminate men with the metabolic triad (i.e., elevated fasting insulin and apo B concen-trations and sdLDL-C particles). Therefore, they concluded
that an enlarged WC alone is not enough to identify men with the atherogenic metabolic triad and that considering the pres-ence of a hypertriglyceridemia could further improve the screen-ing procedure. They suggested that the identification of jects with the HTGW phenotype improves the selection of sub-jects at high risk of metabolic disturbances, insulin resistance and subsequent CVD [9]. However, we found that high TG level and enlarged WC independently increased the risk of dia-betes, since there was no interaction between those two factors for the development of diabetes.
Few studies have investigated the relationship between dia-betes development and the HTGW phenotype in Asian popula-tions. In a very recent retrospective study performed in 687 Chinese who were followed up for 15 years, the HWHT phe-notype was associated with a 4.1-fold increased risk of diabe-tes, and presence of MetS was associated with a 3.7-fold in-creased risk of diabetes. In addition, for the population without elevated fasting plasma glucose levels, a multivariate analysis showed that the HTGW phenotype was associated with a 3.9-fold increased risk of diabetes and that presence of MetS was associated with a 3.7-fold increased risk of diabetes [27]. This is in line with our study results in that subjects with high WCs and hypertriglyceridemia showed a higher risk of diabetes compared with subjects with normal WCs and normal serum TG levels, suggesting the importance of visceral obesity and insulin resistance assessed by this simple and inexpensive method. However, when fasting glucose was included in the model, the risks were attenuated. As the previous study per-formed in Chinese did not analyze the results with adjustment for fasting blood glucose, our result is more reliable regarding the association between the HTGW phenotype and diabetes development.
Our study has limitations. As it is observational, the precise mechanism for the results could not be fully explained. The lack of post-challenge glucose levels in the diagnosis of diabe-tes could have biased the true proportion of diabediabe-tes patients. However, as we included HbA1c ≥6.5% and history of diabe-tes medication use in the definition of diabediabe-tes, we had suffi-cient power to exclude subjects with diabetes [28]. Despite these limitations, the study is meaningful in that it is the first retrospective study regarding this issue performed in a large Korean urban population.
these subjects, as simple weight loss might not be the optimal solution for them.
CONFLICTS OF INTEREST
No potential conflict of interest relevant to this article was re-ported.
REFERENCES
1. Whiting DR, Guariguata L, Weil C, Shaw J. IDF diabetes
atlas: global estimates of the prevalence of diabetes for 2011 and 2030. Diabetes Res Clin Pract 2011;94:311-21. 2. Lee KW. Costs of diabetes mellitus in Korea. Diabetes
Metab J 2011;35:567-70.
3. Centers for Disease Control and Prevention. 2011 National
diabetes fact sheet [Internet]. Atlanta: Centers for Disease Control and Prevention; 2011 [updated 2014 Jul 7; cited 2014 Aug 26]. Available from: http://www.cdc.gov/diabetes/pubs/ factsheet11.htm.
4. Reaven GM. Banting lecture 1988. Role of insulin
resis-tance in human disease. Diabetes 1988;37:1595-607. 5. Assmann G, Guerra R, Fox G, Cullen P, Schulte H, Willett
D, Grundy SM. Harmonizing the definition of the metabol-ic syndrome: comparison of the criteria of the Adult Treat-ment Panel III and the International Diabetes Federation in United States American and European populations. Am J Cardiol 2007;99:541-8.
6. Alberti KG, Zimmet P, Shaw J; IDF Epidemiology Task Force
Consensus Group. The metabolic syndrome: a new world-wide definition. Lancet 2005;366:1059-62.
7. Sam S, Haffner S, Davidson MH, D’Agostino RB Sr,
Fein-stein S, Kondos G, Perez A, Mazzone T. Hypertriglyceride-mic waist phenotype predicts increased visceral fat in sub-jects with type 2 diabetes. Diabetes Care 2009;32:1916-20. 8. Lemieux I, Pascot A, Couillard C, Lamarche B, Tchernof A,
Almeras N, Bergeron J, Gaudet D, Tremblay G, Prud’homme D, Nadeau A, Despres JP. Hypertriglyceridemic waist: A marker of the atherogenic metabolic triad (hyperinsu-linemia; hyperapolipoprotein B; small, dense LDL) in men? Circulation 2000;102:179-84.
9. Lemieux I, Poirier P, Bergeron J, Almeras N, Lamarche B,
Cantin B, Dagenais GR, Despres JP. Hypertriglyceridemic waist: a useful screening phenotype in preventive cardiol-ogy? Can J Cardiol 2007;23 Suppl B:23B-31B.
10. Cameron AJ, Boyko EJ, Sicree RA, Zimmet PZ, Söderberg
S, Alberti KG, Tuomilehto J, Chitson P, Shaw JE. Central obesity as a precursor to the metabolic syndrome in the Aus-Diab study and Mauritius. Obesity (Silver Spring) 2008;16: 2707-16.
11. Bos G, Dekker JM, Heine RJ; Hoom study. Non-HDL
cholesterol contributes to the “hypertriglyceridemic waist” as a cardiovascular risk factor: the Hoorn study. Diabetes Care 2004;27:283-4.
12. LaMonte MJ, Ainsworth BE, DuBose KD, Grandjean PW,
Davis PG, Yanowitz FG, Durstine JL. The hypertriglyceri-demic waist phenotype among women. Atherosclerosis 2003; 171:123-30.
13. Solati M, Ghanbarian A, Rahmani M, Sarbazi N,
Allah-verdian S, Azizi F. Cardiovascular risk factors in males with hypertriglycemic waist (Tehran Lipid and Glucose Study). Int J Obes Relat Metab Disord 2004;28:706-9.
14. Lemieux I, Almeras N, Mauriege P, Blanchet C, Dewailly E,
Bergeron J, Despres JP. Prevalence of ‘hypertriglyceridem-ic waist’ in men who part‘hypertriglyceridem-icipated in the Quebec Health Survey: association with atherogenic and diabetogenic met-abolic risk factors. Can J Cardiol 2002;18:725-32.
15. NGSP. List of NGSP certified methods [Internet]. [place
unknown]: NGSP; c2010 [cited 2012 Nov 26]. Available from: http://www.ngsp.org/docs/methods.pdf.
16. Schwartz KL, Monsur JC, Bartoces MG, West PA, Neale
AV. Correlation of same-visit HbA1c test with laboratory-based measurements: a MetroNet study. BMC Fam Pract 2005;6:28.
17. American Diabetes Association. Standards of medical care
in diabetes: 2013. Diabetes Care 2013;36 Suppl 1:S11-66.
18. Matthews DR, Hosker JP, Rudenski AS, Naylor BA,
Treacher DF, Turner RC. Homeostasis model assessment: insulin resistance and beta-cell function from fasting plas-ma glucose and insulin concentrations in plas-man. Diabetolo-gia 1985;28:412-9.
19. Chobanian AV, Bakris GL, Black HR, Cushman WC, Green
LA, Izzo JL Jr, Jones DW, Materson BJ, Oparil S, Wright JT Jr, Roccella EJ; National Heart, Lung, and Blood Institute Joint National Committee on Prevention, Detection, Evalu-ation, and Treatment of High Blood Pressure; National High Blood Pressure Education Program Coordinating Committee. The Seventh Report of the Joint National Com-mittee on Prevention, Detection, Evaluation, and Treatment of High Blood Pressure: the JNC 7 report. JAMA 2003;289: 2560-72.
DY, Kwon HS, Kim SR, Lee CB, Oh SJ, Park CY, Yoo HJ. Appropriate waist circumference cutoff points for central obesity in Korean adults. Diabetes Res Clin Pract 2007;75: 72-80.
21. Galic S, Oakhill JS, Steinberg GR. Adipose tissue as an
endocrine organ. Mol Cell Endocrinol 2010;316:129-39.
22. Despres JP, Lemieux I. Abdominal obesity and metabolic
syndrome. Nature 2006;444:881-7.
23. Samson SL, Garber AJ. Metabolic syndrome. Endocrinol
Metab Clin North Am 2014;43:1-23.
24. Bluher M. Are there still healthy obese patients? Curr Opin
Endocrinol Diabetes Obes 2012;19:341-6.
25. Hamer M, Stamatakis E. Metabolically healthy obesity
and risk of all-cause and cardiovascular disease mortality.
J Clin Endocrinol Metab 2012;97:2482-8.
26. Rhee EJ, Seo MH, Kim JD, Jeon WS, Park SE, Park CY,
Oh KW, Park SW, Lee WY. Metabolic health is more close-ly associated with coronary artery calcification than obesity. PLoS One 2013;8:e74564.
27. He S, Zheng Y, Shu Y, He J, Wang Y, Chen X.
Hypertri-glyceridemic waist might be an alternative to metabolic syndrome for predicting future diabetes mellitus. PLoS One 2013;8:e73292.
28. Alqahtani N, Khan WA, Alhumaidi MH, Ahmed YA. Use