REVISTA PAULISTA
DE PEDIATRIA
1984-1462/© 2015 Sociedade de Pediatria de São Paulo. Published by Elsevier Editora Ltda. All rights reserved. www.rpped.com.br
ORIGINAL ARTICLE
Anthropometric indices to identify metabolic
syndrome and hypertriglyceridemic waist
phenotype: a comparison between the three
stages of adolescence
Patrícia Feliciano Pereira*, Franciane Rocha de Faria, Eliane Rodrigues de Faria,
Helen Hermana Miranda Hermsdorff, Maria do Carmo Gouveia Peluzio,
Sylvia do Carmo Castro Franceschini, Silvia Eloiza Priore
Universidade Federal de Viçosa (UFV), Viçosa, MG, Brazil
Received 25 April 2014; accepted 14 October 2014
KEYWORDS
Anthropometry; Adolescent; Abdominal obesity; Metabolic X syndrome; Hypertriglyceridemic waist
Abstract
Objective: To determine the prevalence of metabolic syndrome (MS) and the
hypertri-glyceridemic waist phenotype (HW) in a representative adolescent sample; as well as
to establish which anthropometric indicator better identiies MS and HW, according to
gender and adolescent age.
Methods: This cross sectional study had the participation of 800 adolescents (414 girls)
from 10-19 years old. Anthropometric indicators (body mass index, waist perimeter, waist/stature ratio, waist/hip ratio, and central/peripheral skinfolds) were determined by standard protocols. For diagnosis of MS, the criteria proposed by de Ferranti et al. (2004) were used. HW was deined by the simultaneous presence of increased waist peri -meter (>75th percentile for age and sex) and high triglycerides (>100 mg/dL). The ability of anthropometric indicators was evaluated by Receiver Operating Characteristic curve.
Results: The prevalence of MS was identical to HW (6.4%), without differences between
genders and the adolescence phases. The waist perimeter showed higher area under the
curve for the diagnosis of MS, except for boys with 17-19 years old, for whom the waist/sta
-ture ratio exhibited better performance. For diagnosing HW, waist perimeter also showed higher area under the curve, except for boys in initial and inal phases, in which the waist/ stature ratio obtained larger area under the curve. The central/peripheral skinfolds had
the lowest area under the curve for the presence of both MS and HW phenotype.
Conclusions: The waist perimeter and the waist/stature showed a better performance to
identify MS and HW in both genders and in all three phases of adolescence.
© 2015 Sociedade de Pediatria de São Paulo. Published by Elsevier Editora Ltda. All rights reserved.
DOI of original article: http://dx.doi.org/10.1016/j.rpped.2014.10.001 *Corresponding author.
Indicadores antropométricos para identiicar síndrome metabólica e fenótipo cintura hipertrigliceridêmica: uma comparação entre as três fases da adolescência
Resumo
Objetivo: Determinar a ocorrência de síndrome metabólica (SM) e do fenótipo cintura
hipertrigliceridêmica (CH) em amostra de adolescentes e estabelecer qual indicador
an-tropométrico melhor identiica SM e CH, de acordo com gênero e fase da adolescência.
Métodos: Estudo transversal com 800 adolescentes (414 meninas) de 10-19 anos. Indicadores
antropométricos (índice de massa corporal, perímetro da cintura, relação cintura/estatura, relação cintura/quadril e relação pregas cutâneas centrais/periféricas) foram determinados por protocolos padronizados. Para diagnóstico da SM, foi usada a proposta de Ferranti et al. (2004). A CH foi deinida pela presença simultânea de perímetro da cintura aumentado (>75
percentil por idade e sexo) e triglicerídeos elevados (>100 mg/dL). O desempenho dos indi-cadores antropométricos foi avaliado por meio da curva Receiver Operating Characteristic.
Resultados: A prevalência de SM foi idêntica à de CH (6,4%), sem diferenças entre os
gêneros e entre as fases da adolescência. O perímetro da cintura apresentou maior área
abaixo da curva no diagnóstico da SM, exceto para meninos entre 17-19 anos, para os quais a relação cintura/estatura exibiu melhor desempenho. No diagnóstico da CH, a cintura isolada apresentou maior área abaixo da curva, exceto para os meninos nas fases inicial e inal da adolescência, nos quais a relação cintura/estatura obteve maior área. A relação entre as pregas cutâneas apresentou pior desempenho para identiicar SM e CH.
Conclusões: O perímetro da cintura e a relação cintura/estatura mostraram o melhor
desempenho para identiicar SM e CH em ambos os sexos e nas três fases da adolescência.
© 2015 Sociedade de Pediatria de São Paulo. Publicado por Elsevier Editora Ltda. Todos os direitos reservados.
PALAVRAS-CHAVE
Antropometria; Adolescente;
Obesidade abdominal; Síndrome X metabólica; Cintura
hipertrigliceridêmica
Introduction
Chronic, noncommunicable diseases are considered the
leading cause of mortality in developed and developing
countries,1 and their incidence rates are rapidly increasing,
especially in developing countries.2 In Brazil, those diseases
account for approximately 70% of mortality.3
Metabolic syndrome (MS) is defined as a group of
alter-ations that includes central obesity, dyslipidemia, hypergly
-cemia, insulin resistance, and systemic arterial hyperten -sion.4 The hypertriglyceridemic waist (HW) phenotype, one
of the components of MS, is identified by the simultaneous
presence of high waist circumference and high concentra-tions of triglycerides.5 Both phenotypes are important
pre-dictors of cardiovascular diseases,2 but the HW is
consid-ered a simpler method for screening individuals at increased
cardiometabolic risk.6
The prevalence of MS and HW has been widely
investigat-ed in adults,4,5,7-10 but studies in children and adolescents
are scarce.6,11,12 Studies carried out in Iran with children
and adolescents aged 6-18 years reported a prevalence of
14.0% and 8.52% of MS and HW, respectively.6,13 Esmaillzadeh
et al.11 observed MS prevalence of 10.1% in adolescents
aged 10-19 years (10.3% in boys and 9.9% for girls) and 6.5%
of HW (7.3% in boys and 5.6% in girls). Recently, a study
observed HW prevalence of 7.2% in adolescents aged
11-17 years in Salvador city, state of Bahia, Brazil.12
Given the paucity of data on the HW phenotype in ado-lescents and the evidence that the prevalence of MS in
children has been increasing,2 with a tendency to persist
into adulthood,14 it becomes necessary to establish what is
the best body fat distribution indicator for early
identifica-tion of at-risk adolescents, aiming to establish interven -tions and improve future cardiovascular health.15 Therefore,
the objective of this study was to determine the preva-lence of MS and HW phenotype in a representative sample of adolescents and to establish which is the best
anthropo-metric indicator to identify MS and the HW phenotype,
according to gender and stage of adolescence.
Method
This is a cross-sectional study, which is part of a broader investigation carried out with adolescents aged 10-19 years, of both genders, from the rural and urban population of pub -lic and private schools (from the 5th year of Elementary
School to the last year of High School) from the municipality
of Viçosa, state of Minas Gerais, Brazil. Sample size was cal
-culated using the Epi Info software, release 6.04. Considering
the population aged 10-19 years and 11 months living in the
city according to the last census, in a total of 11,898 individ
-uals,16 the expected prevalence is 50%, as the study consid
-ers as outcome multiple cardiovascular risk factors, 5% of acceptable variability, 99% confidence level and 20% increase
to control for potential confounding factors; the sample cal-culation was estimated at 796 in adolescents. The value of
50% of prevalence was chosen because, when the informa
-tion is not known, the most conservative method, which also maximizes sample size, is to adopt an estimate of 50%.
Inclusion criteria were: no regular use of drugs that
altered blood glucose, insulinemia, lipid metabolism and/
diuretics/lax-atives, and not being pregnant or having been previously
pregnant. Adolescents who met the inclusion criteria and were included in the study were separated by gender and grouped by age range (10-13 years: initial stage; 14-16 years: intermediate stage; 17-19 years: final stage).17
Students were selected among those who signed the
informed consent form, by drawing a random sample, strati
-fied by age group, from each school. When an individual refused to participate or withdraw the study, another student
was selected to replace him/her. All participants and their parents/guardians – in the case of adolescents younger than
18 years – signed the informed consent form, in accordance with the Declaration of Helsinki and the rules of Resolution
number 466/2012 of the National Health Council (CNS). The study was approved by the Institutional Review Board of
Universidade Federal de Viçosa (Of. Ref. number 0140/2010).
Data collection occurred between 7:00 am and 9:30 am
at the Health Division of Federal University of Viçosa, by
qualified and previously trained professionals.
Weight and height were measured using standardized
international techniques, with adolescents barefoot and wearing light clothes,18 in an electronic digital scale (LC
200pp, Marte®, São Paulo, Brazil) and a portable stadiome
-ter (Alturexata®, Belo Horizonte, Brazil). The body mass
index (BMI) was calculated using the ratio between body
weight (kg) and the height squared (m2).
Waist circumference was measured at midpoint between
the lower margin of the lowest rib and the iliac crest, in the
horizontal plane and at the end of a normal expiration. Hip
circumference was measured on the gluteal region, over light clothes, and comprised the largest horizontal circumference between the waist and knees.18 All measurements were
per-formed in duplicate by a single trained evaluator, accepting variations of 0.5cm and calculating the mean values, using a measuring tape with a length of 2 meters, flexible and inelas -tic (Cardiomed®, São Luiz, MA, Brazil). Subsequently, the
waist-to-height (WHtR) and waist-hip (WHR) ratios were cal-culated by dividing waist circumference (cm) by height (cm)
and hip circumference (cm), respectively.
Subscapular, suprailiac, triceps and biceps skinfold thickness were measured on the right side of the body, and all measure
-ments were taken three times, non-consecutively by a single trained evaluator using a Lange Skinfold Caliper (Cambridge Scientific, Cambridge, MA, USA), and the mean value was
used.18 The peripheral skinfold was considered as the sum of
the triceps and biceps folds, and the central skinfold as the sum of the subscapular and suprailiac folds, based on which the central/peripheral skinfold ratio was calculated.19
Blood samples were collected from the antecubital vein
after 12-hour fasting, and serum was separated by centrif
-ugation at 2,2253g for 15 minutes at room temperature
(2-3 Sigma, Sigma Laborzentrifuzen, OsterodeamHarz,
Germany). Blood glucose was measured by the glucose oxi-dase method using the Cobas Mira Plus equipment (Roche
Diagnostics, GmbH, Montclair, NJ, USA). HDL and triglycer -ide levels were measured by the automated enzymatic col-orimetric method in a Cobas Mira Plus equipment (Roche
Diagnostics GmbH, Montclair, NJ, USA) (Roche Corp.). Systolic and diastolic blood pressure was measured, after a minimum 15-minute rest period, using automatic inflation
blood pressure monitor (Omron® HEM-741 Model CINT, Kyoto,
KYT, Japan) and a cuff size that was appropriate for the arm
perimeter. The measurement was repeated twice in the arm
with higher pressure value, with a 1-minute interval between them, and the mean of the last two measures was used.20
For the diagnosis of MS, the definition proposed by de Ferranti et al. was used,14 which is based on the presence of
three of the following criteria: waist circumference >75th
percentile for age and gender of the assessed population;
HDL <50 mg/dL (except for boys aged 15-19, for whom a value <45 mg/dL was considered); triglycerides ≥100 mg/dL;
systolic and/or diastolic blood pressure >90th percentile for
gender, age and height, and fasting glucose ≥100 mg/dL. It
should be noted that the criterion of de Ferranti et al.
pro-poses glycemia ≥110, but we chose to use the latest recom -mendations of the American Diabetes Association.21
The HW phenotype was defined according to the cutoffs used to define MS. The simultaneous presence of increased
waist circumference (≥75th percentile for age and gender of
the study population) and high levels of serum triglycerides
(≥100 mg/dL) was considered HW.22
The database was created, and data were entered twice (double entry) using Microsoft Office Excel 2007, and the statistical analyses were performed using SPSS for Windows, release 17.0, and MedCalc, release 9.3. The Kolmogorov-Smirnov test, graphical methods and asymmetry coefficient (skewness >1; asymmetric) were used to evaluate the vari
-ables for normality. Anthropometric, clinical and metabolic variables were compared between stages by ANOVA, fol
-lowed by Tukey post hoc or Kruskal-Wallis test, fol-lowed by
Mann-Whitney with Bonferroni correction for variables with
parametric and nonparametric distribution, respectively. For comparisons between genders, Student’s t test or Mann-Whitney test was used for variables with parametric and
non-parametric distribution, respectively. The occurrence of MS and HW, as well as their individual components, was com
-pared between stages and between genders using Pearson’s chi-square test. Additionally, receiver operator characteris
-tic (ROC) curves were prepared, and the area under the
curve was calculated in order to identify the best anthropo-metric indicator associated with MS and HW phenotype.
Results
All adolescents that attended public and private schools, both in urban and rural areas of the municipality of Viçosa/MG, were contacted in 2010. In the same year, the municipality
had a total of 27 schools and all of them participated in the study. All adolescents who agreed to participate and gave their free and informed consent were included in this study – a
total of 828 adolescents. Of those, 28 were excluded for the
following reasons: use of anticonvulsant medication (1); histo-ry of hypothyroidism (1); inadequate fasting (2); technical impossibility of collecting blood samples (1); use of antide-pressants (fluoxetine) (9); history of myelomeningocele (1); presence of nasal cancer (1); growth hormone use (1); hor-monal alterations (3); use of supplements and/or vitamins (5);
previous pregnancy (2); swollen foot, with plaster (1). Thus, the studied adolescents consisted of 414 girls and 383 boys, with a mean age of 14.72 years (SD=2.95). Anthropometric,
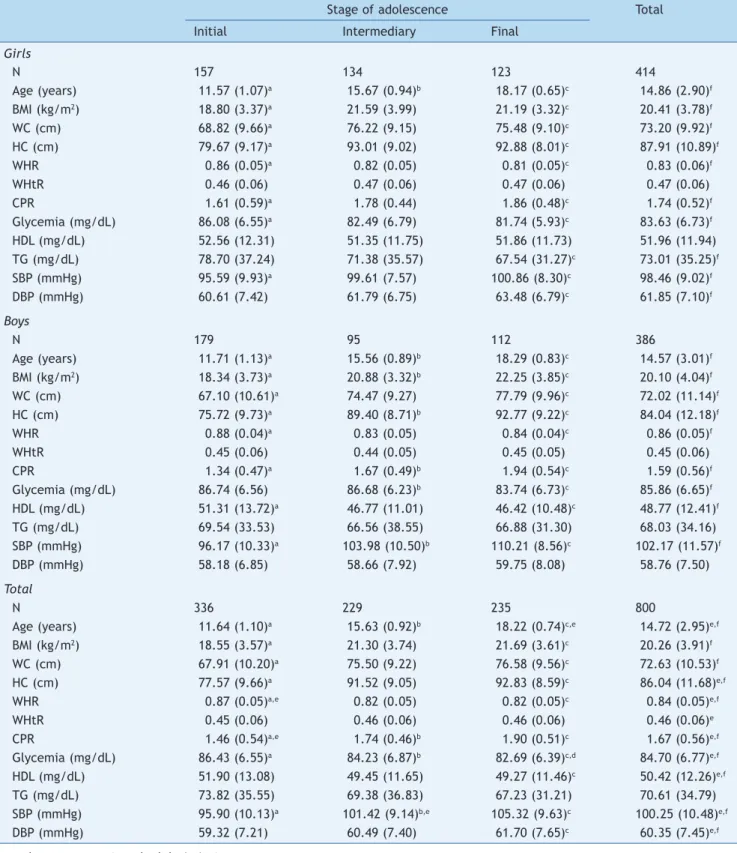
Table 1 Characteristics of the adolescents according to gender and stage of adolescence.
Stage of adolescence Total
Initial Intermediary Final
Girls
N 157 134 123 414
Age (years) 11.57 (1.07)a 15.67 (0.94)b 18.17 (0.65)c 14.86 (2.90)f
BMI (kg/m2) 18.80 (3.37)a 21.59 (3.99) 21.19 (3.32)c 20.41 (3.78)f
WC (cm) 68.82 (9.66)a 76.22 (9.15) 75.48 (9.10)c 73.20 (9.92)f
HC (cm) 79.67 (9.17)a 93.01 (9.02) 92.88 (8.01)c 87.91 (10.89)f
WHR 0.86 (0.05)a 0.82 (0.05) 0.81 (0.05)c 0.83 (0.06)f
WHtR 0.46 (0.06) 0.47 (0.06) 0.47 (0.06) 0.47 (0.06)
CPR 1.61 (0.59)a 1.78 (0.44) 1.86 (0.48)c 1.74 (0.52)f
Glycemia (mg/dL) 86.08 (6.55)a 82.49 (6.79) 81.74 (5.93)c 83.63 (6.73)f
HDL (mg/dL) 52.56 (12.31) 51.35 (11.75) 51.86 (11.73) 51.96 (11.94)
TG (mg/dL) 78.70 (37.24) 71.38 (35.57) 67.54 (31.27)c 73.01 (35.25)f
SBP (mmHg) 95.59 (9.93)a 99.61 (7.57) 100.86 (8.30)c 98.46 (9.02)f
DBP (mmHg) 60.61 (7.42) 61.79 (6.75) 63.48 (6.79)c 61.85 (7.10)f
Boys
N 179 95 112 386
Age (years) 11.71 (1.13)a 15.56 (0.89)b 18.29 (0.83)c 14.57 (3.01)f
BMI (kg/m2) 18.34 (3.73)a 20.88 (3.32)b 22.25 (3.85)c 20.10 (4.04)f
WC (cm) 67.10 (10.61)a 74.47 (9.27) 77.79 (9.96)c 72.02 (11.14)f
HC (cm) 75.72 (9.73)a 89.40 (8.71)b 92.77 (9.22)c 84.04 (12.18)f
WHR 0.88 (0.04)a 0.83 (0.05) 0.84 (0.04)c 0.86 (0.05)f
WHtR 0.45 (0.06) 0.44 (0.05) 0.45 (0.05) 0.45 (0.06)
CPR 1.34 (0.47)a 1.67 (0.49)b 1.94 (0.54)c 1.59 (0.56)f
Glycemia (mg/dL) 86.74 (6.56) 86.68 (6.23)b 83.74 (6.73)c 85.86 (6.65)f
HDL (mg/dL) 51.31 (13.72)a 46.77 (11.01) 46.42 (10.48)c 48.77 (12.41)f
TG (mg/dL) 69.54 (33.53) 66.56 (38.55) 66.88 (31.30) 68.03 (34.16)
SBP (mmHg) 96.17 (10.33)a 103.98 (10.50)b 110.21 (8.56)c 102.17 (11.57)f
DBP (mmHg) 58.18 (6.85) 58.66 (7.92) 59.75 (8.08) 58.76 (7.50)
Total
N 336 229 235 800
Age (years) 11.64 (1.10)a 15.63 (0.92)b 18.22 (0.74)c,e 14.72 (2.95)e,f
BMI (kg/m2) 18.55 (3.57)a 21.30 (3.74) 21.69 (3.61)c 20.26 (3.91)f
WC (cm) 67.91 (10.20)a 75.50 (9.22) 76.58 (9.56)c 72.63 (10.53)f
HC (cm) 77.57 (9.66)a 91.52 (9.05) 92.83 (8.59)c 86.04 (11.68)e,f
WHR 0.87 (0.05)a,e 0.82 (0.05) 0.82 (0.05)c 0.84 (0.05)e,f
WHtR 0.45 (0.06) 0.46 (0.06) 0.46 (0.06) 0.46 (0.06)e
CPR 1.46 (0.54)a,e 1.74 (0.46)b 1.90 (0.51)c 1.67 (0.56)e,f
Glycemia (mg/dL) 86.43 (6.55)a 84.23 (6.87)b 82.69 (6.39)c,d 84.70 (6.77)e,f
HDL (mg/dL) 51.90 (13.08) 49.45 (11.65) 49.27 (11.46)c 50.42 (12.26)e,f
TG (mg/dL) 73.82 (35.55) 69.38 (36.83) 67.23 (31.21) 70.61 (34.79)
SBP (mmHg) 95.90 (10.13)a 101.42 (9.14)b,e 105.32 (9.63)c 100.25 (10.48)e,f
DBP (mmHg) 59.32 (7.21) 60.49 (7.40) 61.70 (7.65)c 60.35 (7.45)e,f
Data shown as mean (standard deviation).
BMI, body mass index; WC, waist circumference; HC, hip circumference; WHR, waist-hip ratio; WHtR, waist-height ratio; CPR, central/ peripheral skinfold ratio; HDL, high-density lipoprotein; TG, triglycerides; SBP, systolic blood pressure; DBP, diastolic blood pressure.
a Differences between the initial and intermediary stages. b Differences between intermediary and inal stages. c Differences between initial and inal stages. d p<0.05 between genders.
Table 2 Prevalence of metabolic syndrome, hypertriglyceridemic waist and individual components according to gender and stage of adolescence.
Stage Waist ≥P75 Elevated TG Low HDL Elevated
glycemia
Elevated BP MS HW
n (%) n (%) n (%) n (%) n (%) n (%) n (%)
Girls
Initial (n=157) 38 (24.2) 35 (22.3) 70 (44.6) 3 (1.9) 4 (2.5) 15 (9.5) 11 (7.0) Intermediary (n=134) 34 (25.4) 22 (16.4) 64 (47.8) 0 (0) 2 (1.5) 7 (5.2) 9 (6.7)
Final (n=123) 31 (25.2) 16 (13.0) 50 (40.7) 0 (0) 1 (0.8) 5 (4.1) 6 (4.9)
Total (n=414) 103 (24.9) 73 (17.6)a 184 (44.4) 3 (0.7) 7 (1.7)a 27 (6.5) 26 (6.3) Boys
Initial (n=179) 134 (25.1) 22 (12.3) 88 (49.2) 1 (0.6) 6 (3.4) 14 (7.8) 12 (6.7) Intermediary (n=95) 24 (25.3) 10 (10.5) 45 (47.4) 1 (1.0) 6 (6.3) 4 (4.2) 5 (5.3) Final (n=112) 29 (25.9) 13 (11.6) 49 (43.8) 1 (0.9) 4 (3.6) 6 (5.4) 8 (7.1) Total (n=386) 98 (25.4) 45 (11.7)a 182 (47.2) 3 (0.8) 16 (4.2)a 24 (6.2) 25 (6.5) Total
Initial (n=336) 83 (24.7) 57 (16.9) 158 (47.0) 4 (1.2) 10 (2.9) 29 (8.6) 23 (6.9) Intermediary (n=229) 58 (25.3) 32 (13.9) 109 (47.6) 1 (0.4) 8 (3.5) 11 (4.8) 14 (6.1) Final (n=235) 60 (25.5) 29 (12.3) 99 (42.1) 1 (0.4) 5 (2.1) 11 (4.7) 14 (5.9) Total (n=800) 201 (25.1) 118 (14.8) 366 (45.8) 6 (0.8) 23 (2.9) 51 (6.4) 51 (6.4) MS, metabolic syndrome; HW, hypertriglyceridemic waist; P, percentile; TG, triglycerides; HDL, high-density lipoprotein; BP, blood pressure.
a p<0.01 between genders.
Girls had higher hip circumference values, waist/height ratio, central/peripheral skinfold ratio, HDL, and diastolic
blood pressure when compared to boys. Boys had higher blood glucose and systolic blood pressure levels. The
parameters body mass index, waist circumference, tri -glycerides and age did not differ between the genders.
Some variables did not change with age, namely the waist/ height ratio and HDL in girls and waist/height ratio, tri -glycerides and diastolic blood pressure in boys. When
com-paring the stages of adolescence, it was observed that, in females, the intermediate and final stages did not differ
between each other (early stage<intermediate stage=final
stage), whereas in boys, the parameters usually differed
between the stages (initial stage<intermediate stage<final
stage, except for glucose levels, which decreased from the
intermediate to the final stage).
Table 2 discloses the presence of MS, HW phenotype and their components, according to the gender and adoles -cence stage. The prevalence of MS was identical to that of
HW (6.4%), with no differences between genders and
between the stages of adolescence. Among the MS
compo-nents, the most prevalent was low HDL. Regarding pheno
-type, the prevalence of abdominal obesity was higher than
that of hypertriglyceridemia. The prevalence of high blood pressure was higher in boys (p<0.01), while hypertriglycer -idemia was more prevalent in girls (p<0.01).
When assessing which anthropometric indicator showed
better performance in the prediction of MS and HW, waist
circumference showed the highest absolute values of area
under the curve in all analyses, except for boys in the ini -tial and final stages in the diagnosis of HW and for boys in
the final stage in the diagnosis of MS, in whom the
waist-to-height ratio showed higher absolute value of area under
the curve. In turn, the central/peripheral skinfold ratio
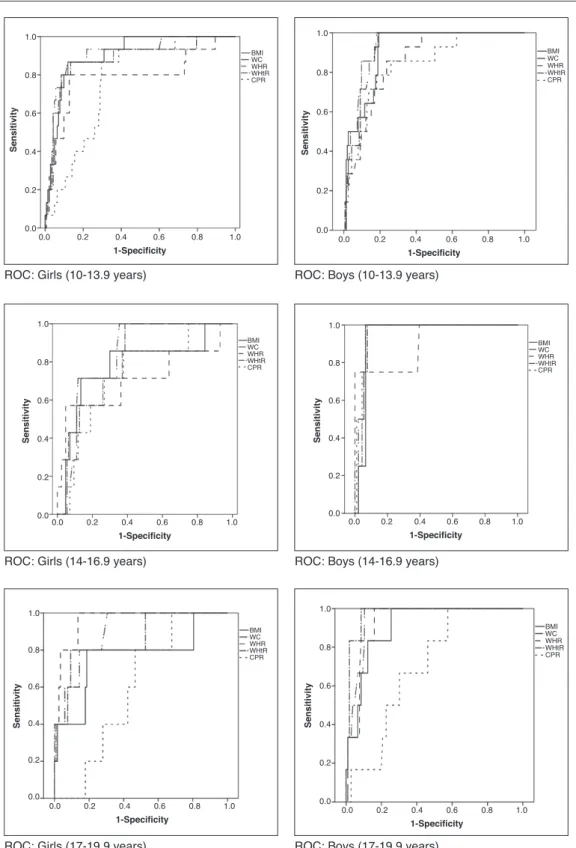
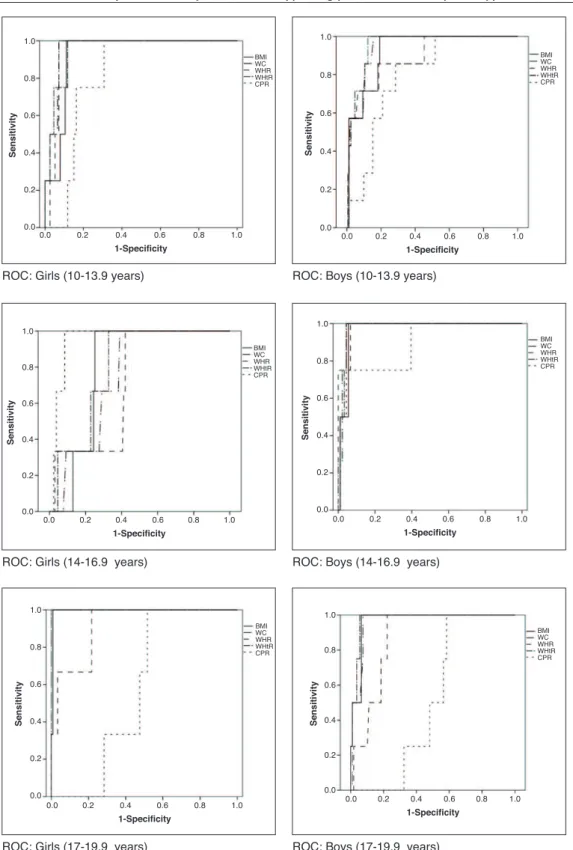
showed the smallest areas under the curve for the presence of both MS and HW (Table 3). The areas under the curves were calculated using the receiver operating characteristic (ROC) curves (Figs. 1 and 2).
Discussion
The present study, carried out with adolescents in a represen
-tative sample of rural and urban, public and private school populations from Viçosa, Minas Gerais, Brazil, identified a prevalence rate of 6.4% for MS and HW phenotype, with no
differences between genders and adolescence stages. MS is a health problem in the pediatric group in devel-oped countries and especially in developing ones2;
howev-er, as yet there is no formal, unified criterion for its diag
-nosis in children and adolescents, and the use of different
criteria for this definition has been observed in different
populations, making it difficult to compare prevalence.13
The prevalence of MS in the United States, according to the same criteria used in this study, was estimated at 12.9% in Mexican-Americans, 10.9% among non-Hispanic whites, and 2.5% for non-Hispanic blacks.14 Kelishadi et al.13 observed a
prevalence of 14% (13% for girls and 14% for boys) of MS
using similar criteria to those of the present study. In Brazil, a study of children and adolescents in Salvador, state of Bahia, observed the prevalence of 6.6% (8.5% in girls and
4.7% in boys).23
10-19 years in Tehran (Iran) (6.4%),11 and similar to that
identified in children and adolescents aged 6-18 years from
Iran (8.5%),6 in adolescents aged 10-19 years from the UK
(7.3%),22 and in adolescents aged 11-17 years from Salvador/
Bahia, Brazil (7.2%).12 However, a study carried out in
England24 with obese children and adolescents aged 8-18
years found a prevalence of 40% of HW phenotype.22
Differences in MS and HW phenotype prevalence can be attributed to variations in the cutoffs used to classify
cen-tral obesity, hypertriglyceridemia, and other components
of MS between different studies and their differences
regarding nutritional status, sexual maturation, race/eth -nicity and life habits between regions.12,25
Among the components of MS, low HDL concentrations were the most prevalent, which can be explained by the current nutritional transition process experienced in Brazil,
where food consumption consists mainly of high-energy
food and, among adolescents, one can observe a high fre
-quency of consumption of cookies, sausages, hotdogs, bolo
-gna, sandwiches and salty snacks. The prevalence of inad
-equate intake of saturated fat was greater than 80%, and the consumption of cream-filled cookies, which contain hydrogenated fats and trans-fatty acids, was four times
higher in this group compared to adults.26 Low levels of
physical activity commonly observed in this age group con-stitute another factor that possibly contributes to the high prevalence of low HDL levels.27
In this sense, although the experience of using the HW phenotype as a diagnostic tool for cardiometabolic risk in adolescents is still limited, it has been documented that in adults, this phenotype is capable of identifying individuals with the atherogenic triad, comprising increased concen
-trations of small and dense LDL, apolipoprotein B and hyperinsulinemia, and who are at high risk for cardiovascu -lar disease.5 In a longitudinal study with adults in Tehran
(n=6,834) the HW phenotype increased the risk of cardio -vascular disease incidence.9 The results of the present
study suggest that these two measures, WC and tri
-glycerides, can be used to substitute higher-cost indicators to identify adolescents at risk of metabolic disorders.
The second objective of this study was to determine which anthropometric index performs best to identify the occurrence of MS and HW phenotype. The ROC analyses demonstrated that WC and waist/height ratio had a high-er area undhigh-er the curve to identify both MS and HW. Studies have shown that the WC in adolescents is a good
Table 3 Areas under the curve (95%CI) of anthropometric indicators as predictors of metabolic syndrome and hypertriglyceridemic waist phenotype.
Gender Stage BMI WC WHR WHtR CPR
MS Girls Initial 0.906
(0.849; 0.946)b
0.906 (0.849; 0.946)b
0.789 (0.717; 0.850)b
0.881 (0.819; 0.927)b
0.767 (0.693; 0.831)b Intermediary 0.778
(0.699; 0.846)a
0.835 (0.761; 0.894)b 0.706 (0.622; 0.782) 0.818 (0.742; 0.879)b 0.733 (0.650; 0.806)a
Final 0.763
(0.678; 0.835)a
0.902 (0.835; 0.948)b
0.961 (0.910; 0.987)b
0.864 (0.790; 0.919)b
0.595 (0.503; 0.682)
Boys Initial 0.914
(0.863; 0.951)b
0.929 (0.881; 0.962)b
0.861 (0.802; 0.908)b
0.924 (0.875; 0.958)b
0.839 (0.777; 0.890)b Intermediary 0.945
(0.878; 0.981)b
0.964 (0.904; 0.991)b
0.902 (0.824; 0.954)b
0.953 (0.889; 0.986)b
0.967 (0.908; 0.992)b
Final 0.910
(0.841; 0.956)b
0.948 (0.889; 0.981)b
0.931 (0.867; 0.970)b
0.976 (0.928; 0.995)b
0.700 (0.607; 0.783) HW
Girls Initial 0.926 (0.874; 0.962)a
0.959 (0.915; 0.984)a
0.944 (0.896; 0.975)a
0.954 (0.909; 0.981)a
0.815 (0.746; 0.873)a Intermediary 0.872 (0.815; 0.929) 0.917 (0.870; 0.965) 0.955 (0.920; 0.990) 0.970 (0.941; 0.999) 0.902 (0.852; 0.953) Final 0.994
(0.960; 0.998)b
1.000 (0.970; 1.000)b
0.917 (0.853; 0.959)b
0.999 (0.967; 1.000)a
0.575 (0.483; 0.664)
Boys Initial 0.927
(0.878; 0.960)b
0.943 (0.898; 0.972)b
0.894 (0.839; 0.935)b
0.953 (0.911; 0.979)b
0.797 (0.730; 0.853)b Intermediary 0.967
(0.908; 0.992)b
0.978 (0.924; 0.997)b
0.984 (0.933; 0.998)b
0.977 (0.922; 0.996)b
0.885 (0.803; 0.941)b
Final 0.965
(0.912; 0.990)b
0.961 (0.906; 0.988)b
0.867 (0.790; 0.924)b
0.977 (0.929; 0.996)a
0.512 (0.415; 0.607) CI, conidence interval; MS, metabolic syndrome; HW, hypertriglyceridemic waist; BMI, body mass index (kg/m2); WC, waist
circumference (cm); WHR, waist/hip ratio; WHtR, waist/height ratio; CPR, central/peripheral skinfold ratio.
ROC: Girls (10-13.9 years)
1.0
0.8
0.6
0.4
0.2
0.0
1.0
0.8
0.6
0.4
0.2
0.0
1.0
0.8
0.6
0.4
0.2
0.0
Sensitivity
Sensitivity
Sensitivity Sensitivity
Sensitivity
1-Specificity
1-Specificity
1-Specificity 1-Specificity
1-Specificity
0.0 0.2 0.4 0.6 0.8 1.0
0.0 0.2 0.4 0.6 0.8 1.0 0.0 0.2 0.4 0.6 0.8 1.0 1.0
0.8
0.6
0.4
0.2
0.0
Sensitivity
1-Specificity
0.0 0.2 0.4 0.6 0.8 1.0
ROC: Boys (10-13.9 years)
ROC: Girls (14-16.9 years) ROC: Boys (14-16.9 years)
ROC: Girls (17-19.9 years) ROC: Boys (17-19.9 years)
1.0
0.8
0.6
0.4
0.2
0.0
1.0
0.8
0.6
0.4
0.2
0.0
0.0 0.2 0.4 0.6 0.8 1.0 0.0 0.2 0.4 0.6 0.8 1.0
BMI WC WHR WHtR CPR BMI
WC WHR WHtR CPR
BMI WC WHR WHtR CPR
BMI WC WHR WHtR CPR
BMI WC WHR WHtR CPR
BMI WC WHR WHtR CPR
Figure 1 Receiver operator characteristic (ROC) curves for metabolic syndrome according to gender and stage of adolescence. BMI, body mass index (kg/m2); WC, waist circumference (cm); WHR, waist/hip ratio; WHtR, waist/height ratio; CPR, central/ peripheral skinfold ratio.
indicator of visceral abdominal fat content28 and
cardio-vascular risk factors,13,29,30 and it can be a simple tool to
identify MS in children and adolescents.13,23,25 In a study
carried out in children and adolescents (8-18 years),
waist/height ratio showed to be a slightly better
predic-tor of MS (area under the curve=0.83 [0.78 to 0.89]) than WC (area under the curve=0.79 [0.73 to 0.85]) and BMI (area under the curve=0.79 [0.72 to 0.85]).23 One of the
advantages of waist/height ratio is the possibility of using
all ages, to identify children and adolescents at cardio
-vascular risk.15 Body mass index, an indicator widely used
in pediatric clinical practice for the assessment of
nutri-tional status, showed a worse performance than waist cir
-cumference and waist/height ratio, which is consistent
ROC: Girls (10-13.9 years) ROC: Boys (10-13.9 years)
ROC: Girls (14-16.9 years) ROC: Boys (14-16.9 years)
ROC: Girls (17-19.9 years) ROC: Boys (17-19.9 years)
Sensitivity
1-Specificity
1.0
0.8
0.6
0.4
0.2
0.0
0.0 0.2 0.4 0.6 0.8 1.0
BMI WC WHR WHtR CPR
Sensitivity
1-Specificity
1.0
0.8
0.6
0.4
0.2
0.0
0.0 0.2 0.4 0.6 0.8 1.0
BMI WC WHR WHtR CPR
Sensitivity
1-Specificity
1.0
0.8
0.6
0.4
0.2
0.0
0.0 0.2 0.4 0.6 0.8 1.0
BMI WC WHR WHtR CPR
Sensitivity
1-Specificity
1.0
0.8
0.6
0.4
0.2
0.0
0.0 0.2 0.4 0.6 0.8 1.0
BMI WC WHR WHtR CPR
Sensitivity
1-Specificity
1.0
0.8
0.6
0.4
0.2
0.0
0.0 0.2 0.4 0.6 0.8 1.0
BMI WC WHR WHtR CPR
Sensitivity
1-Specificity
1.0
0.8
0.6
0.4
0.2
0.0
0.0 0.2 0.4 0.6 0.8 1.0
BMI WC WHR WHtR CPR
Figure 2 Receiver operator characteristic (ROC) curves for hypertriglyceridemic waist phenotype according to gender and stage of adolescence. BMI, body mass index (kg/m2); WC, waist circumference (cm); WHR, waist/hip ratio; WHtR, waist/height ratio; CPR, central/peripheral skinfold ratio.
with previous studies that demonstrated the superiority of waist circumference as an isolated measure or adjust-ed by height.13,25,28 Additionally, waist circumference is
less affected than body mass index by gender, ethnicity,
The index with the worst performance was the central/
peripheral skinfold ratio, which can be explained by the fact that skinfolds estimate subcutaneous and not visceral fat, and the latter is the one associated with increased risk.31 Moreover, the validity of indicators that are based on
the association between two or more measures, compared to individual measures, to predict cardiovascular risk has
been questioned.32
This study has some limitations, such as the cross-sec
-tional design, which does not allow the assessment of the precise effects of growth on waist measurement, and eth
-nicity, which is one of the factors that affect body fat dis
-tribution. However, the effects of the latter were not assessed, as the classification could be inaccurate due to
the great multi-ethnicity of the Brazilian population. Another limitation was the impossibility to assess the stage of sexual maturation of the participants. Despite of
puber-ty effects on body fat distribution, we attempted to control
them by employing specific WC cutoffs for age and gender.
Finally, lifestyle characteristics (food and physical activity
habits) could affect the association between the occur-rence of obesity and other associated metabolic disorders; therefore they should be included in further studies.
It can be concluded that, according to the study results,
HW phenotype is a simple tool to substitute MS in screening
individuals at cardiometabolic risk. Regarding the capacity of the anthropometric indicators, waist circumference and
waist/height ratio showed better performance to identify
MS and HW, two major phenotypes of cardiometabolic risk in both genders and at all stages of adolescence, which
emphasizes the importance of incorporating the measure-ment of these parameters in pediatric clinical routine.
These observations lead to the demand for a national
waist circumference reference curve for adolescents,
which could be used both in the clinical setting and in
pop-ulation surveillance to identify young, but at high risk,
asymptomatic individuals who might benefit from an early intervention. It is believed that such iniciatives could impact on primary prevention in public health.
Funding
Conselho Nacional de Desenvolvimento Científico e Tecnológico
(number 485986/2011-6) and Fundação de Amparo à Pesquisa
do Estado de Minas Gerais (APQ-00872-12).
Conlicts of interest
The authors declare no conflicts of interest.
References
1. World Health Organization. In: World Health Statistics; 2014 [accessed 12 Aug 2014]. Available from: http://www.who.int/ gho/ncd/en/.
2. Kelishadi R. Childhood overweight, obesity, and the metabolic syndrome in developing countries. Epidemiol Rev. 2007;29:62-76.
3. Brasil. Ministério da Saúde. Secretaria de Vigilância em Saúde. Departamento de Análise de Situação de Saúde. In: Plano de ações estratégicas para o enfrentamento das doenças crônicas não transmissíveis (DCNT) no Brasil 2011-2022. Brasília: Ministério da Saúde; 2011.
4. Alberti KG, Eckel RH, Grundy SM, Zimmet PZ, Cleeman JI, Donato KA, et al. Harmonizing the metabolic syndrome: a joint interim statement of the International Diabetes Federation Task Force on Epidemiology and Prevention; National Heart Lung and Blood Institute; American Heart Association; World Heart Federation; International Atherosclerosis Society; and International Association for the Study of Obesity. Circulation. 2009;120:1640-5.
5. Lemieux I, Pascot A, Couillard C, Lamarche B, Tchernof A, Alméras N, et al. Hypertriglyceridemic waist: a marker of the atherogenic metabolic triad (hyperinsulinemia; hyperapolipoprotein B; small, dense LDL) in Men? Circulation. 2000;102:179-84.
6. Alavian SM, Motlagh ME, Ardalan G, Motaghian M, Davarpanah AH, Kelishadi R. Hypertriglyceridemic waist phenotype and associated lifestyle factors in a national population of youths: Caspian Study. J Trop Pediatr. 2008;54:169-77.
7. Rogowski O, Shapira I, Steinvil A, Berliner S. Low-grade inlammation in individuals with the hypertriglyceridemic waist phenotype: another feature of the atherogenic dysmetabolism. Metabolism. 2009;58:661-7.
8. Radenković SP, Kocić RD, Pešić MM, Dimić DN, Golubović MD, Radojković DB, et al. The hypertriglyceridemic waist phenotype and metabolic syndrome by differing criteria in type 2 diabetic patients and their relation to lipids and blood glucose control. Endokrinol Pol. 2011;62:316-23.
9. Samadi S, Bozorgmanesh M, Khalili D, Momenan A, Sheikholeslami F, Azizi F, et al. Hypertriglyceridemic waist: the point of divergence for prediction of CVD vs. mortality: Tehran Lipid and Glucose Study. Int J Cardiol. 2013;165:260-5. 10. Li Y, Chen S, Shao X, Guo J, Liu X, Liu A, et al. Association of
uric acid with metabolic syndrome in men, premenopausal women and postmenopausal women. Int J Environ Res Public Health. 2014;11:2899-910.
11. Esmaillzadeh A, Mirmiran P, Azadbakht L, Azizi F. Prevalence of the hypertriglyceridemic waist phenotype in Iranian adolescents. Am J Prev Med. 2006;30:52-8.
12. Conceição-Machado ME, Silva LR, Santana ML, Pinto EJ, Silva R de C, Moraes LT, et al. Hypertriglyceridemic waist phenotype: association with metabolic abnormalities in adolescents. J Pediatr (Rio J). 2013;89:56-63.
13. Kelishadi R, Ardalan G, Gheiratmand R, Adeli K, Delavari A, Majdzadeh R, et al. Paediatric metabolic syndrome and associated anthropometric indices: the Caspian study. Acta Paediatr. 2006;95:1625-34.
14. De Ferranti SD, Gauvreau K, Ludwig DS, Neufeld EJ, Newburger JW, Rifai N. Prevalence of the metabolic syndrome in American adolescents: indings from the third national health and nutrition examination survey. Circulation. 2004;110:2494-7. 15. McCarthy HD. Measuring growth and obesity across childhood
and adolescence. Proc Nutr Soc. 2014;73:210-7.
16. Brasil. Instituto Brasileiro de Geograia e Estatística. In: Censo demográico 2010; 2014 [accessed 12 Aug 2014]. Available from: http://www.cidades.ibge.gov.br
17. World Health Organization. In: Nutrition in adolescence - Issues and challenges for the health sector: issues in adolescent health and development; 2014 [accessed 12 Aug 2014]. Available from: http://whqlibdoc.who.int/publications/2005 /9241593660eng.pdf
18. Lohman TG, Roche AF, Martorell R. Anthropometric standardization reference manual. Champaign: Human Kinetics; 1988.
et al. Inlammatory proteins are related to total and abdominal adiposity in a healthy adolescent population: the Avena study. Am J Clin Nutr. 2006;84:505-12.
20. Sociedade Brasileira de Cardiologia; Sociedade Brasileira de Hipertensão; Sociedade Brasileira de Nefrologia. VI Diretrizes Brasileiras de Hipertensão Arterial. Arq Bras Cardiol. 2010;95 Suppl 1:1-51.
21. American Diabetes Association. Diagnosis and classiication of diabetes mellitus. Diabetes Care. 2006;35 Suppl 1:S43-8. 22. Hobkirk JP, King RF, Gately P, Pemberton P, Smith A, Barth JH,
et al. The predictive ability of triglycerides and waist (hyper-triglyceridemic waist) in assessing metabolic triad change in obese children and adolescents. Metab Syndr Relat Disord. 2013;11:336-42.
23. Ribeiro-Silva RC, Florence TC, Conceição-Machado ME, Fernandes GB, Couto RD. Anthropometric indicators for prediction of metabolic syndrome in children and adolescents: a population-based study. Rev Bras Saude Mater Infant. 2014;14:173-81. 24. Bailey DP, Savory LA, Denton SJ, Davies BR, Kerr CJ. The
hypertriglyceridemic waist, waist-to-height ratio, and cardio-metabolic risk. J Pediatr. 2013;162:746-52.
25. Pereira PF. Medidas de localização da gordura corporal e fatores de risco para doenças cardiovasculares em adolescentes do sexo feminino Viçosa-MG. Viçosa: UFV; 2008. Tese de mestrado. 26. Brasil. Ministério do Planejamento, Orçamento e Gestão.
Instituto Brasileiro de Geograia e Estatística. Diretoria de Pesquisas. Coordenação de Trabalho e Rendimento. In: Pesquisa de orçamentos familiares 2008-2009: análise do consumo alimentar pessoal no Brasil. Rio de Janeiro: IBGE; 2011.
27. Fernandes RA, Christofaro DG, Milanez VF, Casonatto J, Cardoso JR, Ronque ER, et al. Physical activity: rate, related factors, and association between parents and children. Rev Paul Pediatr. 2011;29:54-9.
28. Daniels SR, Khoury PR, Morrison JA. Utility of different measures of body fat distribution in children and adolescents. Am J Epidemiol. 2000;152:1179-84.
29. Harrington DM, Staiano AE, Broyles ST, Gupta AK, Katzmarzyk PT. Waist circumference measurement site does not affect relationships with visceral adiposity and cardiometabolic risk factors in children. Pediatr Obes. 2013;8:199-206.
30. Pereira PF, Serrano HM, Carvalho GQ, Lamounier JA, Peluzio MC, Franceschini SC, et al. Waist and waist-to-height ratio: useful to identify the metabolic risk of female adolescents? Rev Paul Pediatr. 2011;29:372-7.
31. Orphanidou C, McCargar L, Birmingham CL, Mathieson J, Goldner E. Accuracy of subcutaneous fat measurement: comparison of skinfold calipers, ultrasound, and computed tomography. J Am Diet Assoc. 1994;94:855-8.