Márcia Gonçalves FerreiraI Joaquim Gonçalves ValenteII Regina Maria Veras Gonçalves-SilvaI
Rosely SichieriII
I Departamento de Alimentos e Nutrição. Faculdade de Nutrição. Instituto de Saúde Coletiva. Universidade Federal de Mato Grosso. Cuiabá, MT, Brasil
II Departamento de Epidemiologia. Instituto de Medicina Social. Universidade do Estado do Rio de Janeiro. Rio de Janeiro, RJ, Brasil Correspondence:
Márcia Gonçalves Ferreira
Av. Marechal Deodoro, 829/1202, Bairro Araés 78005-505, Cuiabá, MT, Brasil
E-mail: [email protected] Received: 7/23/2007 Revised: 5/12/2008 Approved: 6/11/2008
Alcohol consumption and
abdominal fat in blood donors
ABSTRACT
OBJECTIVE: To evaluate the association between alcohol consumption and abdominal fat.
METHODS: Cross-sectional study carried out in a sample of male blood donors (n=1,235), aged 20-59 years, in the city of Cuiabá, Central-West Brazil, between August 1999 and January 2000. Waist circumference and waist-to-hip ratio were indicators of abdominal fat, adjusted for total adiposity. Weight, height, waist and hip circumferences were measured. Alcohol consumption was evaluated using a questionnaire collecting information on type, frequency, and amount of consumption. The association between alcohol consumption and abdominal fat was assessed through multiple linear regression models adjusted for age, physical activity, smoking, and percent of body fat.
RESULTS: After adjustment, waist circumference and waist-to-hip ratio were positively associated with beer (p = 0.02) and total alcohol consumption (p=0.01; p=0.03, respectively). Waist circumference was positively associated with spirit consumption (p=0.04).
CONCLUSIONS: Alcohol intake, particularly beer, was positively associated to abdominal fat.
DESCRIPTORS: Blood Donors. Men’s Health. Alcohol Drinking, metabolism. Abdominal Fat. Waist-Hip Ratio. Cross-Sectional Studies.
INTRODUCTION
Prospective and cross-sectional epidemiological studies has consistently dem-onstrated an association between chronic diseases and central body fat.4,6,11
Abdominal fat location can be measured using anthropometric measurements, which provide accurate, low-cost measures compared to more complex ones.8,12
Several recent studies have underscored the value of measures such as waist circumference and waist-to-hip ratio (WHR) as indicators of fat location. Stud-ies conducted in Brazil have evidenced an association between high levels of these indicators and conditions such as hypertension, diabetes, dyslipidemias, and coronary artery disease.6,11,13
Different factors such as genetics, gender and age3,17 are believed to be major
determinants of central body fat. Though still controversial, behaviors such as physical inactivity, alcohol consumption and smoking have also been positively associated.2,14,18 Yet some studies have not evidenced an
associa-tion between fat locaassocia-tion and dietary habits and alcohol consumpassocia-tion.9 As
for alcohol intake, prospective studies have shown an association only with beer consumption.15 In Brazil, few studies have assessed the effect of alcohol
The objective of the present study was to assess the association between anthropometric indicators of fat location and alcohol consumption after controlling for potential confounders.
METHODS
Cross-sectional study including blood donors in the city of Cuiabá, central-west Brazil. The estimated sample size was approximately 600 subjects for 80% power, 0.05 alpha error, and 30% prevalence ratio of inadequacy of the waist-to-hip ratio in alcohol con-sumers and 20% in non-concon-sumers according to that described by Machado & Sichieri.9 A total of 1,749
blood donors aged between 20 and 59 were invited to participate in the study between August 1999 and January 2000. Women were excluded from the study since the proportion of females among blood donors was very low (n=249). Other donors (n=265) were also excluded: 15 were under diet therapy; 12 were regularly taking medication; 15 reported weight loss in the two months prior to the interview; 15 had body mass index (BMI) <18.5 kg/m2; 164 had BMI
≥30.0 kg/m2; 29 refused to participate and 15 were lost. The
fi nal sample consisted of 1,235 male subjects, either eutrofi c or overweight.
Data was collected through interviews carried out by graduating students of Nutrition. Sociodemographic and lifestyle information (alcohol consumption, smok-ing, physical activity) was collected using a question-naire developed for the study.
All respondents reported the frequency and type of alcoholic beverage consumed in the week prior to the in-terview. Consumption was quantifi ed based on common measures (glass, can, bottle, cup, and dose). The doses were set as follows: beer – 200 mL (a double glass); wine – 150 mL (a cup); and spirits – 50 mL (or one measured amount). Low rate of reporting of other alcoholic bever-ages did not allow to breaking them down for analysis. The amount of ethanol (g/day) was calculated based on this information considering the average alcohol content contained in the most commonly marketed beverages: beer=5%; wine=12.5%; spirits=39%.
Smoking was measured in number of cigarettes smoked per day. The respondents were divided into three groups according to their smoking habits: non-smokers were those reporting never smoking; smokers were those reporting at least one cigarette a day at the time of the interview; and former smokers were those report-ing havreport-ing smoked in the past but quitted. Physical activity was assessed using the study questionnaire and respondents were considered physically active or inactive during their leisure time based on information regarding the last month prior to the interview.
All body composition measures were taken before blood donation. Waist and hip circumferences were measured in duplicate following Callaway et al1 standardization.
Waist circumference was measured at the level of the subject’s natural waist, i.e., at the narrower perimeter of the trunk. Hip circumference was measured at the level of greater perimeter around the buttocks. In the analysis, it was included the mean of two measures.
Weight was measured in kilogram using bioimped-ance. Subjects wore light clothing and no shoes during measurements. Height was measured using a metallic tape measure attached to a wooden pole and mounted to a wall with no baseboard. Measurements were taken while subjects were standing barefoot with their backs against the pole, and gazing forward, and recorded to the nearest centimeter. Percent of body fat was estimated using electric bioimpedance and the same analyzer of body composition used for weight measures (Tanita, model TBF-305), at an electric current of 500
μA and low frequency (50 kHz). Further details on the technique used for anthropometric and percent of body fat measurements are available elsewhere.8
Fat distribution-related factors were analyzed in linear regression models. Waist circumference and waist-to-hip ratio were included as dependent variables in individual models. Since the analysis showed both dependent variables did not have a normal distribu-tion, they underwent logarithmic conversion to meet the assumed normality required in linear regression models. Whenever the logarithmic models showed similar results to those found in non-converted mod-els, we present the latter. The models used to assess the predictive ability of ethanol (g/day) and a dose of each one of the alcoholic beverages studied related to the indicators of fat location were adjusted for age as a continuous variable, percent of body fat, smoking, and physical activity.
A previous study in the same population8 evidenced a
strong correlation between fat location (especially waist circumference but also waist-to-hip ratio) and measures of total body fat (BMI and percent of body fat). Hence, the assessment of the independent predictive ability of alcohol consumption related to the indicators of fat location required the inclusion of percent of body fat in the models. The choice for percent of body fat rather than BMI is justifi ed by the fact the percent of body fat is more effective in eliminating the effect of total body fat. Studies4,7,8 have pointed that percent of
body fat is a better indicator than BMI because BMI effectiveness as an indicator of total body fat decreases with age. In addition, the adjustment for total energy consumption is crucial in the analysis of potential as-sociations between nutrients or foods and outcomes,19
Physical activity14 and smoking2 are also considered
confounders of the association between fat location and alcohol consumption and were adjusted for in the models.
The study was approved by Research Ethics Committee at Júlio Muller University Hospital of Universidade Federal de Mato Grosso.
RESULTS
More than half of the subjects (56.7%) aged between 20 and 29 and attended eight to 12 years of school (64.9%). Of all donors, 22.1% were smokers, 16.3% were former smokers, and 61.6% were non-smokers. Among blood donors 55% reported engaging in physi-cal activities during leisure time. A total of 594 subjects (48.1%) reported not consuming alcohol at all (Table 1). Beer was the most commonly consumed alcoholic beverage among those reporting alcohol intake (90.6%). The prevalences of consumption of the main types of
alcoholic beverages are shown in Table 2. Most re-ported consuming only one type of alcoholic beverage in the week prior to the interview and a same subject consumed at most three different types of alcoholic beverage during this same period. Weekly consumption ranged between one and seven days.
The prevalence of overweight was 40.1%. Notably, there was a difference in the prevalences of inadequacy of the waist circumference and the waist-to-hip ratio when the cutoffs described in the previous study for this population (85 cm for waist circumference and 0.90 for waist-to-hip ratio)6 and WHO-recommended (94 cm
for waist circumference and 1.00 for waist-to-hip ratio) were applied.20 These data are shown in Table 3.
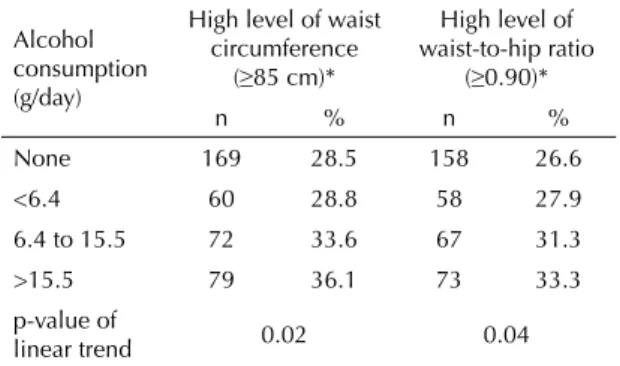
Table 4 shows that the prevalence of inadequacy of the waist circumference and the waist-to-hip ratio linearly increased with alcohol consumption (p=0.02 and p=0.04, respectively).
After adjusting for total body fat and potential con-founders, waist circumference and waist-to-hip ratio remained positively associated to consumption of beer and total amount of alcohol consumed. Waist circumference had an association only with spirits consumption (Table 5).
Table 1. Sociodemographic and lifestyle characteristics of
blood donors. Cuiabá, Brazil, Central-West 1999–2000. N=1,235
Variable n % 95% CI
Age (years)
20–29 700 56.7 53.9;59.5
30–39 363 29.4 26.9;32.0
40–59 172 13.9 12.1;16.0 Schooling (years)
<8 333 27.0 24.5;29.5
8–12 801 64.9 62.1;67.5
>12 101 8.2 6.7;9.9 Income*
<1.0 372 30.1 27.6;32.8
1.0–2.0 392 31.7 29.2;34.4
>2.0 471 38.1 35.4;40.9 Smoking
Non-smoker 761 61.6 58.8;64.3
Former smoker 201 16.3 14.3;18.5
Smoker 273 22.1 19.8;24.5 Alcohol consumption (g/day)**
None 594 48.1 45.3;50.9
<6.4 208 16.8 14.8;19.1
6.4–15.5 214 17.3 15.3;19.6 >15.5 219 17.7 15.7;20.0
Physical activity during leisure time
No 548 44.4 41.6;47.2
Yes 687 55.6 52.8;58.4 * Per capita minimum wages
** Tercile of consumption
Table 2. Prevalence of consumption by type of alcohol
beverage in blood donors. Cuiabá, Central-West Brazil, 1999–2000.
Type of alcoholic beverage n %
Beer 581 90.6
Wine 45 7.0
Spirits 32 5.0
Other 8 1.2
Table 3. Prevalence of overweight and abdominal obesity
defi ned by waist circumference and waist-to-hip ratio in blood donors based on two cutoffs. Cuiabá, Central-West Brazil, 1999–2000.
Variable n % 95% CI
Overweight* 495 40.1 37.3;42.9
Waist circumference
≥85 cm** 380 30.8 28.2;33.4 ≥94 cm*** 79 6.4 5.1;7.9 Waist-to-hip ratio
≥0.90** 356 28.8 26.3;31.5 ≥1.00*** 20 1.6 1.0;2.5 * 25.0 ≤ BMI ≤ 29.9 kg/m2 [BMI = body mass index] **Cutoff values described by Ferreira et al6
DISCUSSION
The most consistent association found in the pres-ent study was a positive correlation between weekly consumption of beer and total daily amount of alcohol consumed and indicators of fat location. This as-sociation was statistically signifi cant for both waist circumference and waist-to-hip ratio after adjusting for potential confounders.
It was also found in this same population that beer and ethanol consumption (g/day) had an independent ef-fect on blood levels of HDL-cholesterol (p=0.002 and p=0.003, respectively). This same association has been described in other studies10 and supports the validity of
alcohol consumption estimates in the present study.
Although the present study design does not allow any inferences on a causal relationship, the multivariate analysis allowed to exploring potential associations between alcohol intake and anthropometric measures of fat location after controlling for major risk factors.
A strength of the present study compared to other cross-sectional studies was the exclusion of obese blood donors since blood donors are less likely to have health
problems. This approach may have contributed to reduce biases. Obese individuals, aware of the need to restrict alcohol intake, could have lower alcohol consumption, which would have affected the interpretation of results due to reverse causality, often seen in cross-sectional studies. Alcohol consumption is frequently lower in individuals with medical conditions and its relation-ship with outcomes is refl ected as either a J-shaped or U-shaped curve.15 This fact has been reported in studies
that evaluated several different outcomes while studying alcohol consumption as an explanatory variable.
A strong association was found between total alcohol consumption and beer consumption and the indicators of abdominal fat. Consistently with our fi ndings, several studies have showed that the total amount of alcohol consumed has a major effect on abdominal fat.15,18
In the present study the prevalence of inadequacy of both the waist circumference and the waist-to-hip ratio linearly increased with the amount of alcohol consumed, suggesting a dose-response relationship, already reported in other studies.5
Recent studies have failed to show consistent associa-tions between particular types of alcoholic beverages and abdominal fat. Corroborating our fi ndings, Macha-do & Sichieri9 reported that daily intake of four or more
glasses of beer in men was an independent predictor of inadequacy of the waist-to-hip ratio while the deleteri-ous effect of distilled beverages on abdominal fat was seen only in post-menopausal women.
The type of alcoholic beverage, dose consumed and exposure time seem to play an important role in the association between alcohol consumption and changes in the indicators of fat location. A prospective study evaluating the amount and type of alcoholic beverage consumed showed a signifi cant increase in the waist circumference in men with a weekly intake of more than 21 doses of beer over ten years.16
Despite its limitation for causality inferences, common to cross-sectional studies, the present study was able to detect a statistically signifi cant association between beer consumption and both indicators of abdominal fat studied. In the multivariate analysis, after adjusting for potential confounders, nearly a 0.3-cm increase in the waist circumference was evidenced in those consum-ing 10 glasses of beer weekly compared to those who did not consume any beer. For spirits consumers, the effect was greater per dose consumed, i.e., a weekly 10-dose intake could result in 2.4-cm increase in the waist circumference compared to those who did not take spirits. Machado & Sichieri9 did not fi nd any
as-sociation between inadequacy of the waist-to-hip ratio and consumption of spirits in men.
Despite using a careful methodological approach in this study, especially in the construction of regression mod-els, it cannot be assured that all potential confounders
Table 5. Coeffi cient of regression and p-value associated to
abdominal fat indicators and alcohol consumption in male blood donors. Cuiabá, Central-West Brazil, 1999–2000. N=1,235
Variable
Waist circumference*
Waist-to-hip ratio* β p-value β p-value Beer (dose) 0.026 0.02 0.0002 0.02 Wine (dose) –0.0002 1.00 0.0013 0.56 Spirits (dose) 0.244 0.04 0.0006 0.60
Ethanol (g/day) 0.019 0.01 0.0002 0.03 * Adjusted for age, percent of body fat, physical activity and smoking
Table 4. Prevalence of abdominal obesity defi ned by waist
circumference and waist-to-hip ratio in blood donors by alcohol consumption. Cuiabá, Central-West Brazil, 1999– 2000. N=1,235
Alcohol consumption (g/day)
High level of waist circumference
(≥85 cm)*
High level of waist-to-hip ratio
(≥0.90)*
n % n %
None 169 28.5 158 26.6
<6.4 60 28.8 58 27.9 6.4 to 15.5 72 33.6 67 31.3
>15.5 79 36.1 73 33.3 p-value of
linear trend 0.02 0.04
were controlled for. Given its cross-sectional design, the study results should be cautiously interpreted because a temporal relationship cannot be established between exposure and the outcomes studied.
The present study evidenced an association between overall alcohol consumption and some types of
1. Callaway CW, Chumlea WC, Bouchard C, Himes JH, Lohman TG, Martin AD, et al. Circumferences. In: Lohman, TG, Roche AF, Martorell R. Anthropometric standardization reference manual. Champaign: Human Kinetics; 1988. p. 39-54.
2. Canoy D, Wareham N, Luben R, Welch A, Bingham S, Day N, et al. Cigarette smoking and fat distribution in 21,828 British men and women: a population-based study. Obes Res. 2005;13(8):1466-75. DOI: 10.1038/ oby.2005.177
3. Castanheira M, Olinto MTA, Gigante DP. Associação de variáveis sócio-demográfi cas e comportamentais com a gordura abdominal em adultos: estudo de base populacional no Sul do Brasil. Cad Saude Publica 2003;19(Suppl 1):S55-65. DOI: 10.1590/S0102-311X2003000700007
4. Dobbelsteyn CJ, Joffres MR, Maclean DR, Flowerdew G. The Canadian Heart Health Surveys Research Group. A comparative evaluation of waist circumference, waist-to-hip ratio and body mass index as indicators of cardiovascular risk factors. Int J Obes Relat Metab Disord. 2001;25(5):652-61. DOI: 10.1038/sj.ijo.0801582
5. Dorn JM, Hovey K, Muti P, Freudenheim JL, Russel M, Nochajski TH, et al. Alcohol drinking patterns differentially affect central adiposity as measured by abdominal height in women and men. J Nutr. 2003;133(8):2655-62.
6. Ferreira MG, Valente JG, Gonçalves-Silva, RMV, Sichieri, R. Acurácia da circunferência da cintura e da relação cintura/quadril como preditores de dislipidemias em estudo transversal de doadores de sangue de Cuiabá, Mato Grosso, Brasil. Cad Saude Publica. 2006;22(2):307-14. DOI: 10.1590/S0102-311X2006000200008
7. Grinker JA, Tucker KL, Vokonas PS, Rush D. Changes in patterns of fatness in adult men in relation to serum indices of cardiovascular risk: the Normative Aging Study. Int J Obes Relat Metab Disord. 2000;24(10):1369-78. DOI: 10.1038/sj.ijo.0801397
8. Lemos-Santos MG, Valente JG, Gonçalves-Silva, RMV, Sichieri, R. Waist circumference and waist-to-hip ratio as predictors of serum concentration of lipids in Brazilian men. Nutrition. 2004;20(10):857-62. DOI: 10.1016/j.nut.2004.06.005
9. Machado PAN, Sichieri R. Relação cintura-quadril e fatores de dieta em adultos. Rev Saude Publica. 2002;36(2):198-204. DOI: 10.1590/S0034-89102002000200012
10. Marques-Vidal P, Montaye M, Hass B, Bingham A, Evans A, Juhan-Vague I, et al. Relationships between alcoholic beverages and cardiovascular risk factor levels in middle-aged men, the PRIME Study. Atherosclerosis. 2001;57(2):431-40. DOI: 10.1016/ S0021-9150(00)00734-6
11. Olinto MT, Nacul LC, Gigante DP, Costa JSD, Menezes, AM, Macedo S. Waist circumference as a determinant of hypertension and diabetes in Brazilian women: a population-based study. Public Health Nutr. 2004;7(5):629-35. DOI: 10.1079/PHN2003582
12. Olinto MTA, Nacul LC, Dias-da-Costa JS, Gigante DP, Menezes AMB, Macedo S. Níveis de intervenção para obesidade abdominal: prevalência e fatores associados. Cad Saude Publica. 2006;22(6):1207-15. DOI: 10.1590/S0102-311X2006000600010
13. Pitanga FJG, Lessa I. Indicadores antropométricos de obesidade como instrumento de triagem para risco coronariano elevado em adultos na cidade de Salvador - Bahia. Arq Bras Cardiol. 2005;85(1):26-31. DOI: 10.1590/S0066-782X2005001400006
14. Ross R, Janssen I. Physical activity, total and regional obesity: dose-response considerations. Med Sci Sports Exerc. 2001;33(6 Suppl):S521-7. DOI: 10.1097/00005768-200106001-00023
15. Rouillier P, Bertrais S, Daudin JJ, Bacro JN, Hercberg S, Boutron-Ruault MC. Drinking patterns are associated with variations in atherosclerotic risk factors in French men. Eur J Nutr. 2006;45(2):79-87. DOI: 10.1007/ s00394-005-0567-6
16. Vadstrup ES, Petersen L, Sorensen TI, Grønbaek M. Waist circumference in relation to history of amount and type of alcohol: results from the Copenhagen City Heart Study. Int J Obes Relat Metab Disord. 2003;27(2):238-46. DOI: 10.1038/sj.ijo.802203
17. Vague, J. The degree of masculine differentiation of obesities: a factor determining predisposition to diabetes, atherosclerosis, gout, and uric calculous disease. Am J Clin Nutr. 1956;4(1):20-34.
18. Wannamethee SG, Shaper AG, Whincup PH. Alcohol and adiposity: effects of quantity and type of drink and time relation with meals. Int J Obes Relat Metab Disord. 2005;29(12):1436-44. DOI: 10.1038/ sj.ijo.0803034
19. Willett W. Nutritional epidemiology. New York: Oxford University Press; 1998.
20. World Health Organization. Obesity: preventing and managing the global epidemic. Geneva; 1998. (WHO Technical Report Series, 894).
REFERENCES
Research partially supported by Conselho Nacional de Desenvolvimento Científi co e Tecnológico (CNPq – Process 620161/04-3) and Fundação de Apoio à Pesquisa do Estado de Mato Grosso (Fapemat – Process 300/04).