BGD
8, 1369–1409, 2011Moisture and temperature
sensitivity
C. E. Gabriel and L. Kellman
Title Page
Abstract Introduction
Conclusions References
Tables Figures
◭ ◮
◭ ◮
Back Close
Full Screen / Esc
Printer-friendly Version Interactive Discussion
Discussion
P
a
per
|
Dis
cussion
P
a
per
|
Discussion
P
a
per
|
Discussio
n
P
a
per
|
Biogeosciences Discuss., 8, 1369–1409, 2011 www.biogeosciences-discuss.net/8/1369/2011/ doi:10.5194/bgd-8-1369-2011
© Author(s) 2011. CC Attribution 3.0 License.
Biogeosciences Discussions
This discussion paper is/has been under review for the journal Biogeosciences (BG). Please refer to the corresponding final paper in BG if available.
Examining moisture and temperature
sensitivity of soil organic matter
decomposition in a temperate coniferous
forest soil
C. E. Gabriel1,2and L. Kellman2
1
Environmental Sciences Research Centre, St. Francis Xavier University, Antigonish, NS, B2G 2W5, Canada
2
Department of Earth Sciences, Dalhousie University, Halifax, NS, B3H 4J1, Canada Received: 12 January 2011 – Accepted: 21 January 2011 – Published: 14 February 2011 Correspondence to: C. E. Gabriel ([email protected])
BGD
8, 1369–1409, 2011Moisture and temperature
sensitivity
C. E. Gabriel and L. Kellman
Title Page
Abstract Introduction
Conclusions References
Tables Figures
◭ ◮
◭ ◮
Back Close
Full Screen / Esc
Printer-friendly Version Interactive Discussion
Discussion
P
a
per
|
Dis
cussion
P
a
per
|
Discussion
P
a
per
|
Discussio
n
P
a
per
Abstract
Temperature and moisture are primary environmental drivers of soil organic matter (SOM) decomposition, and the development of a better understanding fo their roles in this process through depth in soils is needed. The objective of this research is to independently assess the roles of temperature and moisture in driving heterotrophic 5
soil respiration for shallow and deep soils in a temperate red spruce forest. Minimally disturbed soil cores from shallow (0–25 cm) and deep (25–50 cm) layers were extracted from a 20 yr old red spruce stand and were then transferred to a climate chamber where they were incubated for 3 months under constant and diurnal temperature regimes. Soils were subjected to different watering treatments representing a full range of water 10
contents. Temperature, moisture, and CO2 surface flux were assessed daily for all soils and continuously on a subset of the microcosms. The results from this study indicate that shallow soils dominate the contribution to surface flux (90%) and respond more predictably to moisture than deep soils. An optimum moisture range of 0.15 to 0.60 water-filled pore space was observed for microbial SOM decomposition in shallow 15
cores across which a relatively invariant temperature sensitivity was observed. For soil moisture conditions experienced by most field sites in this region, flux-temperature relationships alone can be used to reasonably estimate heterotrophic respiration, as in this range moisture does not alter flux, with the exception of rewetting events along the lower part of this optimal range. Outside this range, however, soil moisture determines 20
SOM decomposition rates.
1 Introduction
Soil is the largest terrestrial store of carbon (C), with more than two thirds of terrestrial C stored in soils (Hibbard et al., 2005). The terrestrial surface flux of carbon dioxide (CO2) is a significant contributor to global carbon cycling, generating emissions of 50–
25
BGD
8, 1369–1409, 2011Moisture and temperature
sensitivity
C. E. Gabriel and L. Kellman
Title Page
Abstract Introduction
Conclusions References
Tables Figures
◭ ◮
◭ ◮
Back Close
Full Screen / Esc
Printer-friendly Version Interactive Discussion
Discussion
P
a
per
|
Dis
cussion
P
a
per
|
Discussion
P
a
per
|
Discussio
n
P
a
per
|
of the rate of soil respiration and represents the integration of a number of complex subsurface interactions, including the production and transport of CO2 through the profile. At any time, heterotrophic respiration comprises a fraction of this flux, while the other component is derived from autotrophic respiration, where CO2 is respired from
living roots, by microbes fed by root exudates, and by ectomycorrhizal fungi (Lavigne 5
et al., 2004).
In terrestrial ecosystems, soil organisms decompose organic molecules from soil or-ganic matter (SOM) and produce CO2, among other greenhouse gases, in the process of their metabolism. Most of the respired CO2from SOM decomposition is derived from
a small fast cycling labile carbon (C) pool (Trumbore, 2000), with the production of CO2
10
highest at the surface organic layers and declining with depth (Fang and Moncrieff, 2005; Risk et al., 2008b). Although the concentration of organic C is generally lower in subsurface horizons than in organic surface horizons, the total contribution from sub-surface soil layers can be 50% of the total organic C in a 1 m profile (Batjes, 1996). Subsurface soils are composed of SOM that is generally considered unavailable for 15
decomposition through physical separation (Xiang et al., 2008), inaccessibility within aggregate structures (Denef et al., 2001), or due to inherent chemical recalcitrance (Agren and Bosatta, 2002; Giardina and Ryan, 2000).
CO2 flux from SOM decomposition is typically related to soil temperature as it
pro-vides the best overall predictive tool of SOM decomposition. Heterotrophic soil res-20
piration typically increases exponentially with an increase in temperature and may be inhibited at low or high moisture levels (Luo and Zhou, 2006). The temperature sen-sitivity of SOM decomposition is important in determining soil C balance with shifts in climate as it provides an indication of the sensitivity of SOM decomposition to temper-ature changes (Kirschbaum, 2000; Davidson et al., 2006a). The tempertemper-ature sensitiv-25
BGD
8, 1369–1409, 2011Moisture and temperature
sensitivity
C. E. Gabriel and L. Kellman
Title Page
Abstract Introduction
Conclusions References
Tables Figures
◭ ◮
◭ ◮
Back Close
Full Screen / Esc
Printer-friendly Version Interactive Discussion
Discussion
P
a
per
|
Dis
cussion
P
a
per
|
Discussion
P
a
per
|
Discussio
n
P
a
per
experimental conditions can introduce changes to soil structure and substrate avail-ability, so care must be taken to interpret estimates of temperature sensitivity within the defined methodology (Wixon and Balser, 2009).
The impact of moisture on SOM decomposition is more complex than temperature because microbial activity is affected by several physical processes that vary with wa-5
ter content (Rodrigo et al., 1997), including water movement, gas and solute diffusion to sites of microbial activity, and the survival and motility of microorganisms (Luo and Zhou, 2006). By altering solute and oxygen diffusion, this indirectly affects substrate supply and decomposition rates (Davidson et al., 2006a), although the temporal and spatial scale may determine which environmental factor is most important (Savage 10
et al., 2009). The relationship between soil moisture and respiration also depends on physical characteristics of each soil that affect its moisture content, including tex-ture, porosity, and organic matter content. Nutrient cycling is also subject to non-linear shifts in dynamics as changing hydroclimatic conditions can force the soil-water system through a number of bifurcation points (Manzoni et al., 2004). Soil respiration can also 15
be affected by sudden changes in moisture availability. Over very short time scales (minutes to hours), infiltrating water is known to result in a large pulse of CO2 imme-diately after the event, and it is suggested that this rapid pulse is transport-related, with a displacement of CO2 from subsurface pore space (Xu et al., 2004; Smart and
Penuelas, 2005; Luo and Zhou, 2006; McCulley et al., 2007; Liu et al., 2009). Over 20
longer time scales (days), rewetting stimulates microbial growth and activity (Iovieno and Baath, 2008), resulting in a large sustained release of soil CO2: the so-called
“Birch effect” (Jarvis et al., 2007). Respiration rates can be as high as 500% faster than the rates before the rewetting and the pulse can last for 2–6 days after the rewet-ting event depending on the pulse size, among other factors (Fierer et al., 2003a). 25
BGD
8, 1369–1409, 2011Moisture and temperature
sensitivity
C. E. Gabriel and L. Kellman
Title Page
Abstract Introduction
Conclusions References
Tables Figures
◭ ◮
◭ ◮
Back Close
Full Screen / Esc
Printer-friendly Version Interactive Discussion
Discussion
P
a
per
|
Dis
cussion
P
a
per
|
Discussion
P
a
per
|
Discussio
n
P
a
per
|
difficult to separate the effect of temperature on respiration from the effect of moisture in a natural setting. Establishing relationships between controlling variables and CO2 flux from SOM decomposition is also challenging due to the high spatial and temporal variability in bulk density, SOM content and quality within a field site and through depth. Observed in situ soil CO2fluxes are thus highly variable, and this presents difficulty for 5
the identification of a land use or climate driven change (Kellman et al., 2007). One potential reason for the observed variability is that many studies do not attempt to isolate CO2flux from decomposition from other CO2generating processes in situ such as the autotrophic component of soil respiration from roots. Field measurements of CO2 surface flux and subsurface production must consider the contribution of both
10
sources in their assessment of temperature sensitivity across growing seasons. This can be accomplished through root exclusion, including trenching (Lavigne et al., 2004; Risk et al., 2008b), using spatial gradients in the landscape (Baldocchi et al., 2006), or girdling (Hogberg et al., 2009).
In an effort to minimize potential confounding influences, standard laboratory incu-15
bations are often employed with a particular set of sample preparation procedures. These incubations are then typically carried out on sieved and homogenized soil under fixed temperature and/or moisture conditions, with optima of 20–25◦
C and 50–60% of water holding capacity (Hopkins, 2008). Standard laboratory incubations are sub-ject to criticism, however, because they do not not adequately reflect field conditions. 20
Optimal temperatures and moistures for microbial activity have been experimentally determined from incubations of processed soils, but it is likely that microbes in natural field conditions rarely experience these optimal conditions (Fang and Moncrieff, 2001). Furthermore, in situ mineralization rates may contrast highly with those determined from standard laboratory incubations (Oburger and Jones, 2009). Due to the complex 25
BGD
8, 1369–1409, 2011Moisture and temperature
sensitivity
C. E. Gabriel and L. Kellman
Title Page
Abstract Introduction
Conclusions References
Tables Figures
◭ ◮
◭ ◮
Back Close
Full Screen / Esc
Printer-friendly Version Interactive Discussion
Discussion
P
a
per
|
Dis
cussion
P
a
per
|
Discussion
P
a
per
|
Discussio
n
P
a
per
microbial community dynamics. Standard laboratory incubations also rely on incuba-tions of shallow soil, where it is thought most microbial activity occurs. Although lower soil organic carbon (SOC) mineralization rates are observed in situ for deep soils (Risk et al., 2008b), potential SOC decomposition rates derived from laboratory incubations with sieved and homogenized soil can be similar to those for native surface soils (Sa-5
lome et al., 2009). This certainly indicates that physical controls at depth in the field setting can play an important role in dictating decomposition rates, and that the poten-tial for unrealistic estimates based upon measured soil temperature are greater in the deeper zones of the soil profile.
Here we present results of a study whose research objective is to independently as-10
sess the role of temperature and moisture in driving heterotrophic soil respiration for shallow and deep soils in a temperate red spruce forest. The physical environment in soils exerts a primary control upon rates of soil organic matter (SOM) decomposi-tion, however quantifying the relationships amongst temperature, moisture and SOM decomposition is methodologically challenging in situ, especially for deep soil. Ideally, 15
it is important to consider the role of each while the other is held constant. In this study, the incubation of intact soil cores represents an intermediate between field measure-ments and laboratory incubations, employed in order to more realistically simulate field conditions and to allow shallow and deep soil responses to changes in environmen-tal conditions to be documented. In using this approach, the original soil structure is 20
maintained in intact cores in order to minimize confounding factors on substrate supply, especially through disturbance, which then allows environmental factors to be manipu-lated independently in a climate-controlled facility in a manner that addresses problems inherent in standard incubation approaches.
2 Materials and methods
25
BGD
8, 1369–1409, 2011Moisture and temperature
sensitivity
C. E. Gabriel and L. Kellman
Title Page
Abstract Introduction
Conclusions References
Tables Figures
◭ ◮
◭ ◮
Back Close
Full Screen / Esc
Printer-friendly Version Interactive Discussion
Discussion
P
a
per
|
Dis
cussion
P
a
per
|
Discussion
P
a
per
|
Discussio
n
P
a
per
|
Canada (45.1◦N 62.83◦W). A chronosequence representing forests in various stages post-harvest, along with an old growth stand with no record of harvesting (Neily et al., 2003) has been studied since 2005 for soil C stores (Diochon and Kellman, 2008, 2009; Diochon et al., 2009) and biogenic gas emissions. As part of this study, a set of root exclusion plots were installed in order to isolate heterotrophic respiration in these 5
forest soils. This 20 yr old forest site (plantation) is in close proximity to the studied chronosequence, providing an ideal opportunity to examine in situ microbial respiration processes and to carry out parallel studies using extracted soil cores and controlled climate manipulations.
The stand is situated on well-drained, sandy loam soil within the Governor Lake 10
Ecodistrict in the Eastern Ecoregion of Nova Scotia, Canada. The soil is from the Halifax Series, derived mainly from quartzite, and is an Orthic Humo-Ferric Podzol. The Bfh horizons of the Halifax series are known to be high in organic matter (MacDougall, 1963). Soil properties from this site are summarized in Table 1. Soil bulk density was determined using the method of Huntington et al. (1988) due to the rocky nature of 15
these soils. The organic layer was generally quite shallow (less than 5 cm), with a ground cover of mosses and needle litter. The mineral soil depth interval of 0–5 cm was generally coincident with the E horizon, while the remaining soil represented the B horizon. The A horizon was typically <1 cm or absent. This site was previously whole tree harvested. Additional information about sampling methods can be found in 20
Diochon et al. (2009).
The climate of the site is temperate, characterized by warmer winters and cooler summers with a mean annual temperature of 5.8◦
C, a mean summer temperature of 16.3◦C, and a mean winter temperature of
−5◦C. This site receives 1440 mm of precipitation and has 1522 growing degree-days and 196 growing season days (Neily 25
BGD
8, 1369–1409, 2011Moisture and temperature
sensitivity
C. E. Gabriel and L. Kellman
Title Page
Abstract Introduction
Conclusions References
Tables Figures
◭ ◮
◭ ◮
Back Close
Full Screen / Esc
Printer-friendly Version Interactive Discussion
Discussion
P
a
per
|
Dis
cussion
P
a
per
|
Discussion
P
a
per
|
Discussio
n
P
a
per
2.1 Experimental approach
This study employed both a field and laboratory approach. The presence of in situ root exclusion plots allowed for field measurements of SOM decomposition while a coupled incubation of intact cores was carried out in order to isolate specific environmental responses. The incubation of intact soil cores represents an intermediate between field 5
measurements and highly processed standard laboratory incubations. The original soil structure is maintained in intact cores in order to minimize confounding factors on substrate supply, especially through disturbance. Environmental factors can then be manipulated in isolation in a climate-controlled facility. Eight shallow and four deep samples were extracted from each of three soil plots, for a total of 24 shallow cores 10
and 12 deep cores, allowing for 3 replicates for each experimental treatment.
2.2 In situ gas sampling
Field sampling took place at a series of six root exclusion plots that were established in 2005. The root exclusion plots are 4 m2 and 1 m deep, with temperature probes (Campbell Scientific 107) inserted at three depths in the subsurface (7.5, 22.5 and 15
37.5 cm). Time domain reflectometry (TDR) moisture probes (CS 615 and CS 616) were inserted vertically into the soil at each root exclusion plot and data was collected continuously with a datalogger (Campbell Scientific 23X). One PVC collar (10 cm) was pressed into the surface layers of each plot to a depth of approximately 5 cm for place-ment of a LI-8100 (LI-COR Biosciences, Ltd.) chamber used to measure soil surface 20
CO2 flux. CO2 flux was calculated by the LI-COR software from the rate of increase
in CO2concentration measured by the instrument’s infrared gas analyzer (IRGA). The
observation length was 2 min with a 20 s deadband. Field sampling occurred biweekly during the growing season (May to November) of 2007 and 2008. Collar offsets were recorded on each sampling day.
BGD
8, 1369–1409, 2011Moisture and temperature
sensitivity
C. E. Gabriel and L. Kellman
Title Page
Abstract Introduction
Conclusions References
Tables Figures
◭ ◮
◭ ◮
Back Close
Full Screen / Esc
Printer-friendly Version Interactive Discussion
Discussion
P
a
per
|
Dis
cussion
P
a
per
|
Discussion
P
a
per
|
Discussio
n
P
a
per
|
2.3 Sample extraction and experimental set-up
Minimally disturbed shallow (0–25 cm) and deep (25–50 cm) soil cores were extracted on 9 and 10 June 2008 from 3 randomly located plots within a 400 m radius of the root exclusion plots. After extraction, they were immediately placed in insulated containers, constructed from 30 cm diameter PVC pipe with a wall thickness of 2 cm cut in lengths 5
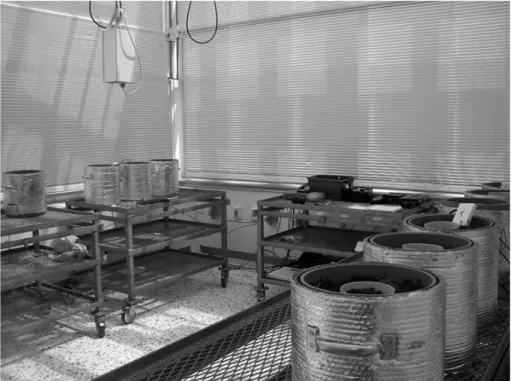
of 30 cm. A PVC base (1 cm thick) with a small hole for drainage was fitted to the bottom of each microcosm. Insulation was wrapped around the exterior of the cylinder to minimize radial temperature influences (Reichstein et al., 2005). Immediately following collection, all microcosms were covered with plastic to maintain soil at field moisture until incubation. These microcosms were then transported to the Phytotron, a climate-10
controlled facility, at the K.C. Irving Environmental Science Centre at Acadia University, Wolfville, NS. Samples were placed on top of large metal trolleys at a height of 1.5 m in triplicate groups (Fig. 1).
Instrumentation
Soil gas exchanges were monitored on 10 cm PVC collars inserted at the soil surface 15
into the centre of each core using one of two portable LiCor CO2infrared gas analyzers
(LI-COR 8100, LI-COR Biosciences Ltd.). Flux rates were monitored daily for all treat-ments and a subset were monitored continuously (every 15 min) for up to 24 h. The LI-COR 8100 gas analyzers were calibrated independently two months before use, but linear offsets were applied to the data to calibrate results between the two instruments. 20
Environmental variables within the room were collected continuously (room temper-ature and relative humidity). Tempertemper-ature probes (CS107, Campbell Scientific) were inserted in one set of the triplicate cores at two depths: 5 and 15 cm. Probe data was collected every 15 min with Campbell Scientific 10X dataloggers. Profile soil moisture was measured for each soil microcosm using 30 cm TDR probes inserted vertically or 25
BGD
8, 1369–1409, 2011Moisture and temperature
sensitivity
C. E. Gabriel and L. Kellman
Title Page
Abstract Introduction
Conclusions References
Tables Figures
◭ ◮
◭ ◮
Back Close
Full Screen / Esc
Printer-friendly Version Interactive Discussion
Discussion
P
a
per
|
Dis
cussion
P
a
per
|
Discussion
P
a
per
|
Discussio
n
P
a
per
a subset of the samples at the surface of the soil core using a 5 cm TDR soil mois-ture probe (ECHO – Decagon Devices), installed as a peripheral device to one of the LiCor 8100 units.
2.4 Climate-controlled facility experiments
We employed parallel incubations of soil microcosms with constant and diurnal tem-5
perature cycling. Half of the shallow samples were placed in one constant temperature treatment (18.5◦C), while the others were placed in a chamber that cycled around a mean temperature of 18.5◦C with an amplitude of 10◦C. This mean and amplitude are the same as the typical July mean air temperature in the region (Halifax Airport, NS). Shallow soils were exposed to both the constant and a diurnal temperature regime. 10
Deep soils were only subjected to a constant temperature regime as this more accu-rately reflected the dampened temperature signals deep soils would experience in the field setting (Beltrami and Kellman, 2003). The constant temperature chamber shifted by approximately 1◦C d−1and this temperature shift was considered during data analy-sis. We omitted data from days where high external air temperatures imposed technical 15
constraints on temperature control that compromised the treatment. After 90 days, the mean air temperature of both chambers was raised by 10◦C (from 18.5◦C to 28.5◦C) for 4 days to allow for stabilization at this higher temperature.
Shallow microcosms were incubated the day following extraction for a 95 day period. Deep samples were stored at 4◦C for 39 days. The deep soils replaced the shallow 20
constant microcosms on room trolleys and were then outfitted with temperature and moisture probes and incubated for a 56 day period. After an equilibration period of 2 weeks, the temperature was regulated in both chambers, and microcosm sample moistures were adjusted. The first two weeks of incubation were considered to be an equilibration period, consistent with observations from other soil core incubation 25
BGD
8, 1369–1409, 2011Moisture and temperature
sensitivity
C. E. Gabriel and L. Kellman
Title Page
Abstract Introduction
Conclusions References
Tables Figures
◭ ◮
◭ ◮
Back Close
Full Screen / Esc
Printer-friendly Version Interactive Discussion
Discussion
P
a
per
|
Dis
cussion
P
a
per
|
Discussion
P
a
per
|
Discussio
n
P
a
per
|
At fixed moisture contents, high frequency flux measurements (every 15 min) of shallow soil microcosms in the diurnal chamber were used to investigate the flux-temperature relationship. These continuous CO2 fluxes were observed on a subset
of samples that represented a range of moisture contents.
2.4.1 Moisture adjustment
5
Triplicate soil microcosms were adjusted to four target moistures in both the constant and diurnal temperature environments. The replicate cores (from the three soil plots) were divided into one of four soil treatments that represented target maximum mois-ture content ranges: (i)<0.1, (ii) 0.1–0.2, (iii) 0.2–0.3 and (iv)>0.3 volumetric water content. Soil was wetted in groups (ii), (iii), and (iv). Soils in wetting treatments were 10
wetted incrementally over a period of two weeks from dry (approx. 0.1 vol/vol) until they reached the targeted water content with measured amounts of deionized water applied with a misting sprayer. Soils in group (i) were never wetted. The slow wetting was performed to minimize the trapping of air within the soil matrix and to allow observation of soil respiration responses to gradual shifts in soil moisture.
15
Constant shallow soils were wet first, followed by the diurnal shallow and then the deep samples in order to assess the response of CO2 flux after each incremental
wetting event. During the moisture adjustment period, soils from moisture groups (ii), (iii) and (iv) were wet almost every day receiving approximately four or more wettings per day. Total daily water additions were generally less than 20 mm; however, group (iv) 20
BGD
8, 1369–1409, 2011Moisture and temperature
sensitivity
C. E. Gabriel and L. Kellman
Title Page
Abstract Introduction
Conclusions References
Tables Figures
◭ ◮
◭ ◮
Back Close
Full Screen / Esc
Printer-friendly Version Interactive Discussion
Discussion
P
a
per
|
Dis
cussion
P
a
per
|
Discussion
P
a
per
|
Discussio
n
P
a
per
2.4.2 Soil water characteristics
Soil water characteristics (volumetric water content at field capacity and saturation) were determined using the intact cores. The maximum volumetric water content achieved when the soil was saturated was designated as the total porosity (refer to Table 1). The field capacity was taken as the volumetric water content 2 days after 5
drainage (removal of tape). These measurements allowed for an estimation of water-filled pore space (WFPS), a measure of water content allowing better comparisons among sites of similar soil texture. The intact soil pore network of these cores allow for little alteration of natural aggregate dynamics and therefore it is reasonable to use porosity estimates derived from saturation water content to normalize volumetric water 10
content (Reichstein et al., 2005). Volumetric water contents from the TDR probes were converted into WFPS using experimentally determined porosity, such that:
WFPS= θρ (1)
whereθis the volumetric water content andρis the soil porosity.
For the purpose of data analysis, moisture conditions were considered to fall under 15
a rewetting (RW) or steady-state (SS) classification, depending on their recent wetting history. Samples that were wet within 5 days were classified as RW, whereas any samples that had not been wet within 5 days were classified as SS.
2.4.3 Monitoring of CO2flux
Measurements of CO2flux were taken daily when the air temperatures were equivalent
20
in the constant and diurnal treatments. CO2flux was measured immediately following each wetting on a subset of the samples. High frequency CO2 flux measurements
BGD
8, 1369–1409, 2011Moisture and temperature
sensitivity
C. E. Gabriel and L. Kellman
Title Page
Abstract Introduction
Conclusions References
Tables Figures
◭ ◮
◭ ◮
Back Close
Full Screen / Esc
Printer-friendly Version Interactive Discussion
Discussion
P
a
per
|
Dis
cussion
P
a
per
|
Discussion
P
a
per
|
Discussio
n
P
a
per
|
2.5 Data analysis
In order to facilitate comparisons amongst soil core replicates, flux data was normal-ized by dividing by the initial rates after temperature equilibration, allowing for detection of changes in relative fluxes. When considering the effect of soil moisture on SOM de-composition, CO2flux data was binned according to soil moisture ranges, where mean
5
fluxes were calculated for bin widths of 0.1 WFPS. This approach was used instead of calculating mean flux on each sampling day because soil moisture was not always the same among the microcosms, despite efforts to ensure that the sample moisture levels increased at the same rate.
All CO2flux data was fitted to a two-parameter exponential model with temperature, 10
such that SOM decomposition as CO2flux, or soil respiration,Rh:
Rh=aebT (2)
whereaandbare constants (van’t Hoff, 1884). The temperature sensitivity,Q10, could then be generated from thebparameter, such that:
Q10=e10b (3)
15
Q10 was also calculated from all daily flux data when the chamber air temperature was raised by 10◦C near the end of the experiment (after 90 days). Since the soil temperature did not differ by exactly 10◦C, a modified van’t Ho
ffrelationship (Davidson et al., 2006a) was used to generateQ10 values at two temperatures,T1andT2, where:
Q10= RhT
2
RhT
1
T2−T1
10
(4) 20
BGD
8, 1369–1409, 2011Moisture and temperature
sensitivity
C. E. Gabriel and L. Kellman
Title Page
Abstract Introduction
Conclusions References
Tables Figures
◭ ◮
◭ ◮
Back Close
Full Screen / Esc
Printer-friendly Version Interactive Discussion
Discussion
P
a
per
|
Dis
cussion
P
a
per
|
Discussion
P
a
per
|
Discussio
n
P
a
per
3 Results
3.1 Soil temperature and moisture
During the bulk of the experimental temperature period in the constant room, soil tem-perature at 5 cm remained relatively constant with a mean of 18.5◦
C, fluctuating sys-tematically over the day between 18◦C and 19◦C. In the diurnal chamber air tempera-5
ture cycled with an amplitude of 10◦C, from 13.5 to 23.5◦C which typically resulted in a soil temperature shift at 5 cm of 5◦
C and at 15 cm of 3◦
C diurnally.
Surface soil moisture, as measured by 5 cm probes, responded quickly to moisture additions, but recorded profile soil moistures rose only after 2–3 days of consecutive wettings. Soil moisture decreased gradually over time in microcosms without moisture 10
adjustments.
3.2 Soil CO2flux – general patterns
Shallow soil fluxes ranged from 0.8 to 4.5 µmol m−2s−1 once the climate chambers’ temperatures were regulated to a mean of 18.5◦C. CO
2 flux adjusted quickly to the
temperature cycles, with stable fluxes in both constant and diurnal samples. Deep 15
soil fluxes were in the range of 0.05 to 0.3 µmol m−2s−1, about an order of magnitude smaller than shallow soils.
The mean cumulative mass of C respired over a 48 day period for all samples in the shallow constant temperature treatment was 41.5 g C (SE=3.53,n=12) with shallow diurnal samples respiring 31.3 g C (SE=3.80, n=12). The deep soils respired much 20
less (mean 5.1 g C, SE=0.38, n=12). Thus the shallow constant temperature incu-bation was 714% greater and shallow diurnal was 514% greater than the deep soils over a similar time period. Adjusted for C content (Table 1), the contribution from the shallow constant and shallow diurnal would become only 210% and 134% higher, or three times and two times as high as the deep, respectively.
BGD
8, 1369–1409, 2011Moisture and temperature
sensitivity
C. E. Gabriel and L. Kellman
Title Page
Abstract Introduction
Conclusions References
Tables Figures
◭ ◮
◭ ◮
Back Close
Full Screen / Esc
Printer-friendly Version Interactive Discussion
Discussion
P
a
per
|
Dis
cussion
P
a
per
|
Discussion
P
a
per
|
Discussio
n
P
a
per
|
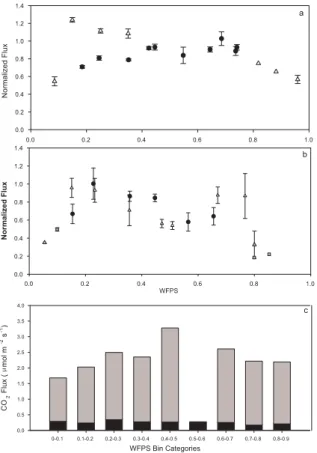
3.3 CO2flux across a range of soil moisture conditions
CO2fluxes under steady-state conditions (no wetting events within 5 days) were diff
er-entiated from rewetting fluxes. Figure 2a and b demonstrate the relationship between CO2flux and WFPS for rewetting (RW) and steady-state (SS) conditions from shallow
and deep soil under constant temperature conditions. In shallow soils, a temporary 5
elevated flux response is seen after wetting until 0.4 WFPS. After this point up until 0.6 WFPS, normalized fluxes are variable but similar for both RW and SS conditions. Above a WFPS of 0.60, the flux rates for both RW and SS conditions drop. Except for the initial rewetting, enhanced respiration with rewetting as measured by flux was not observed in the deep samples (Fig. 2b). Deep samples showed no discernable pattern 10
with WFPS, with a range of normalized flux values across the moisture range. Deep microcosm contributions to total profile flux were less variable than shallow, represent-ing generally less than 10% of the combined total flux from both soil layers across the moisture range (Fig. 2c).
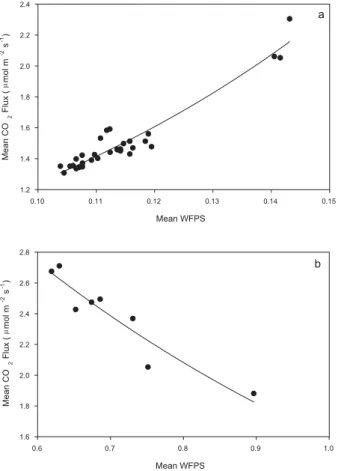
Segments of the data where changes in the moisture flux relationship were evident 15
occurred for<0.20 WFPS, 0.20 to 0.60 WFPS and>0.60 WFPS. The relationship be-tween CO2 flux and moisture once average moisture was below 0.20 WFPS shows
a significant exponential relationship between mean flux and mean WFPS (r2=0.92) (Fig. 3a). When soil moisture was above 0.60 WFPS (Fig. 3b), the decline in fluxes was best described by an exponential decline (r2=0.88,P <0.001) between flux and 20
soil moisture.
3.4 The influence of temperature on CO2flux
Clear exponential relationships were observed between CO2 flux rates and temper-ature at 5 cm depth for samples over the course of a diurnal air tempertemper-ature cycle across moisture contents ranging from 0.11 to 0.58 WFPS (Fig. 4). The magnitude of 25
BGD
8, 1369–1409, 2011Moisture and temperature
sensitivity
C. E. Gabriel and L. Kellman
Title Page
Abstract Introduction
Conclusions References
Tables Figures
◭ ◮
◭ ◮
Back Close
Full Screen / Esc
Printer-friendly Version Interactive Discussion
Discussion
P
a
per
|
Dis
cussion
P
a
per
|
Discussion
P
a
per
|
Discussio
n
P
a
per
a much higher increase in CO2flux with a change in temperature then the steady-state conditions (0.11 SS), and respired on par with rewet soils at a higher moisture content (0.34 RW). If a soil was wet to above 0.40 WFPS, the flux-temperature relationships followed an intermediate trajectory that did not depend on wetting status (i.e. 0.42 RW and SS). If the soil was very wet (0.54 WFPS), flux-temperature relationships were in 5
the same range as those for dry SS soil. Results from regression fits with Eq. (2) for the plots in Fig. 4 are listed in Table 2. All flux temperature relationships were significant at
P <0.0001.
A general estimate of temperature sensitivity, Q10, for all samples (constant, diur-nal and deep) was calculated from fluxes before and after a 10◦C rise in the climate 10
chamber air temperature using Eq. (3) and were related to the sample WFPS (Fig. 5). No significant difference inQ10 (overall mean=2.19, n=12, SE=0.07) for any of the samples and treatments across moisture was observed (one way ANOVA, P >0.05) for a range ofQ10 values from 1.73 to 2.66 (constant), 1.88 to 2.68 (diurnal) and 1.29 to 3.23 (deep).
15
3.5 In situ respiration-temperature relationships
A total of 159 surface CO2flux measurements were taken at the field site root exclusion plots in 2007 and 2008 (combined).
Surface CO2 fluxes for 2007 ranged from 0.96 µmol m− 2
s−1 to 8.82 µmol m−2s−1, with a mean of 3.98 µmol m−2s−1 (SE
=0.4) and a median of 3.16 µmol m−2s−1. Sur-20
face CO2flux for 2008 ranged from 0.61 µmol m−2s−1to 5.34 µmol m−2s−1with a mean of 2.1 µmol m−2
s−1
(SE=0.1) and a median of 1.78 µmol m−2 s−1
.
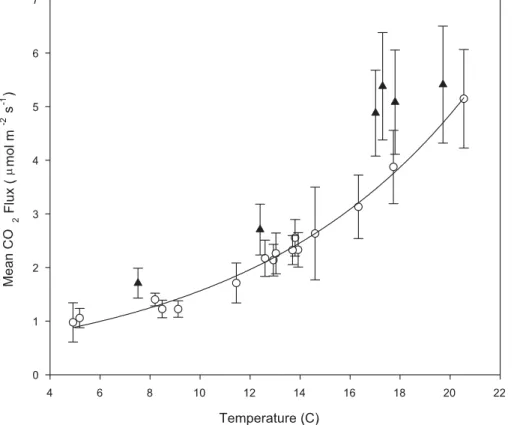
Temperature was the main factor controlling CO2 at the root exclusion plots. Field
CO2surface flux temperature relationships from the root exclusion plots show exponen-tial relationships (Fig. 6) through the 2007 and 2008 growing seasons with a correlation 25
BGD
8, 1369–1409, 2011Moisture and temperature
sensitivity
C. E. Gabriel and L. Kellman
Title Page
Abstract Introduction
Conclusions References
Tables Figures
◭ ◮
◭ ◮
Back Close
Full Screen / Esc
Printer-friendly Version Interactive Discussion
Discussion
P
a
per
|
Dis
cussion
P
a
per
|
Discussion
P
a
per
|
Discussio
n
P
a
per
|
days within 5 days of a rainfall event (classified as RW) were removed from the re-gression, the exponential relationship between mean flux and mean soil temperature improved to anr2of 0.99 (P <0.0001). TheQ10(calculated using Eq. 2) changed little (from 3.06 to 3.10) with the RW samples removed.
4 Discussion
5
4.1 Moisture sensitivity of SOM decomposition in shallow soil cores
The challenge in decoupling temperature and moisture-driven CO2flux responses was dealt with by employing an incubation approach that held one variable constant while varying the other(s). Overall, the results of this study support the general consensus that the optimal soil moisture for heterotrophic respiration exists at intermediate water 10
contents, which represents a balance between solute diffusion through continuous soil water films on the lower end and limits upon rates of gas transport on the upper end of the moisture spectrum (Skopp et al., 1990; Howard and Howard, 1993). Based on the results from Figs. 2–6, the optimum moisture level for soil respiration under steady-state moisture conditions for the studied soils generally ranged from 0.20 to 15
0.60 WFPS. Within this intermediate range, a plateau of CO2flux was observed (Fig. 2). These results are consistent with those of Schjonning et al. (2003); Pumpanen et al. (2003) and Schindlbacher et al. (2008) who identified a range of 25 to 45% volumetric water content as optimal for microbial activity. Not all studies identify such a broad optimal moisture range, though. Optimum soil moisture for microbial processes for a 20
BGD
8, 1369–1409, 2011Moisture and temperature
sensitivity
C. E. Gabriel and L. Kellman
Title Page
Abstract Introduction
Conclusions References
Tables Figures
◭ ◮
◭ ◮
Back Close
Full Screen / Esc
Printer-friendly Version Interactive Discussion
Discussion
P
a
per
|
Dis
cussion
P
a
per
|
Discussion
P
a
per
|
Discussio
n
P
a
per
inconsistencies among studies; this suggests that reported optimal moisture contents are site- and study-specific.
Under the experimental conditions of this study, the relationship between CO2
sur-face flux and water content for shallow soils displayed threshold behaviour. Below a lower and above an upper threshold, CO2 flux is dependent on moisture, while within 5
an intermediate moisture range, soil water content was no longer the dominant factor controlling of respiration, and instead, variation in CO2 flux depended mainly on
tem-perature. Recent studies have documented similar results (Liu et al., 2002; Xu et al., 2004; Rey et al., 2005; Ball et al., 2009). A threshold type relationship is consistent with the nature of soil spatio-temporal dynamics (Di Domenico et al., 2007); according 10
to the analytical model of (Manzoni et al., 2004), a change in the system dynamics as the system changes from dry to adequately watered, and then again when the soil is saturated.
In soils drier than the optimum range, heterotrophic respiration under steady-state conditions decreases with soil moisture, such that below 0.20 WFPS, CO2flux is
cor-15
related exponentially with moisture (Fig. 3). Respiration has been observed in other studies to decrease in incubated soils (in both mineral and organic horizons) with in-creasing water potential (Orchard and Cook, 1983; Skopp et al., 1990). Studies sug-gest that as soils dry, a decrease in microbial biomass is correlated with the length of drying, and this would reduce heterotrophic soil respiration (Schimel et al., 1999). A 20
lower threshold in a similar range (below 0.20 WFPS) has been identified in field stud-ies; Knohl et al. (2008) found that once soil moisture dropped below 23% VWC in a beech forest water limitations were apparent, and Rey et al. (2002) observed a lower threshold of 20% VWC. Others have found it to be near 15% VWC (Xu and Qi, 2001a; Yuste et al., 2003; Xu et al., 2004; Inclan et al., 2007; Almagro et al., 2009) or even 25
BGD
8, 1369–1409, 2011Moisture and temperature
sensitivity
C. E. Gabriel and L. Kellman
Title Page
Abstract Introduction
Conclusions References
Tables Figures
◭ ◮
◭ ◮
Back Close
Full Screen / Esc
Printer-friendly Version Interactive Discussion
Discussion
P
a
per
|
Dis
cussion
P
a
per
|
Discussion
P
a
per
|
Discussio
n
P
a
per
|
discontinuous and solute diffusion is thought to cease (Schjonning et al., 2003). This point is thought to represent a moisture level in the soil at which WFPS within the soil matrix suddenly becomes disconnected (Moldrup et al., 2001).
As the soils were wetted above the optimum range, CO2 flux declined rapidly. This upper threshold of 0.60 WFPS represents the field capacity for these soils, and thus 5
is a point beyond which water begins to impede gaseous transport. Above the opti-mum range, water fills pores between aggregates and air-filled pore space becomes discontinuous. In situ, observed rapid declines in diffusivity near saturation have been suggested to be the result of preferential recruitment of large pores for diffusion (Risk et al., 2008a). Maintaining the natural soil structure in this study (with intact cores) 10
meant that the pore network remained largely unaltered from in situ conditions, and could explain why we observed such sharp changes near threshold moisture contents.
4.2 Moisture sensitivity of SOM decomposition in deep soil cores
In contrast to shallow soils, CO2flux from deep soil cores was an order of magnitude lower (Fig. 2b). A lower and upper threshold at 0.20 and 0.60 WFPS (Fig. 2–4) was 15
observed, but the differences in flux within the optimum range were not significant. This may be attributed to different controls on heterotrophic respiration for surface and subsurface soil horizons; Davidson et al. (2006b) found that the water content was a predictor of CO2 production only in the organic horizon of sandy loam soil in a mixed
deciduous forest, and below this depth, flux did not vary significantly with water content. 20
Similarly, Fierer et al. (2003a) found that surface soils were more sensitive to drought, while the subsurface was controlled by temperature and nutrient inputs.
The decline in flux rates after extraction was more pronounced for deep than shallow soil cores, as also observed by Reichstein et al. (2005) in their intact soil core incu-bations. In our study, the deep soils would not have contained labile decaying root 25
BGD
8, 1369–1409, 2011Moisture and temperature
sensitivity
C. E. Gabriel and L. Kellman
Title Page
Abstract Introduction
Conclusions References
Tables Figures
◭ ◮
◭ ◮
Back Close
Full Screen / Esc
Printer-friendly Version Interactive Discussion
Discussion
P
a
per
|
Dis
cussion
P
a
per
|
Discussion
P
a
per
|
Discussio
n
P
a
per
which dipped below 0.06 WFPS in most samples during this equilibration period before moisture adjustment. Without data on the microbial biomass, however, it is difficult to ascertain whether this contributed to the decline in CO2flux rates.
It has been observed that SOM in deep soils can be spatially heterogenous and in-accessible (von Lutzow et al., 2006; Chabbi et al., 2009), making this SOM unavailable 5
for microbial processing, regardless of the soil moisture status. Furthermore, deep SOM is generally thought to be dominated by lower quality substrate which requires more energy to decompose (Bosatta and Agren, 1999; Paul and Clark, 1996). Per-haps substrate availability was a clear controlling factor in deep soils: it is known that SOM in deeper layers are mostly associated with the organomineral fraction (Diochon 10
and Kellman, 2008), a less bioavailable C pool due to strong mineral interactions with organic matter. Recent evidence demonstrates that SOM in deep soil is indeed pro-tected from decomposition by a suite of physical factors, which may be more important than inherent substrate quality (Gillabel et al., 2010; Risk et al., 2008b; Xiang et al., 2008). A lack of response from the deep soil could also be related to the nature of 15
the moisture inputs. In situ inputs would have been leachate from rainfall events at the surface with dissolved organic matter (DOM), but recent evidence points to enhanced decomposition of deep soil C with inputs of labile C (Fontaine et al., 2007), and water itself may not be capable of stimulating microbial activity (Salome et al., 2009), espe-cially if nutrient status and substrate quality are also limiting factors. It is possible that 20
the moisture sensitivity cannot be adequately detected with this experimental setup for deep SOM, especially since CO2fluxes were low. Further work in this area is required.
4.3 CO2flux-temperature relationships
Results from analysis of high frequency CO2 flux data (every 15 min) of surface soils under a diurnal temperature regime demonstrate a high correlation between CO2 flux
25
BGD
8, 1369–1409, 2011Moisture and temperature
sensitivity
C. E. Gabriel and L. Kellman
Title Page
Abstract Introduction
Conclusions References
Tables Figures
◭ ◮
◭ ◮
Back Close
Full Screen / Esc
Printer-friendly Version Interactive Discussion
Discussion
P
a
per
|
Dis
cussion
P
a
per
|
Discussion
P
a
per
|
Discussio
n
P
a
per
|
similarly. For soils in steady-state below 0.20 WFPS, and above 0.60 WFPS, the magni-tude of the flux response to temperature was lower than at intermediate water contents. The observed flux magnitude depended on soil moisture content, and this was consis-tent with the results summarized in Fig. 2 for soils at constant temperature. The CO2 flux-temperature relationship can thus be influenced by soil moisture in two ways: the 5
moisture content and the wetting history.
Despite extended drying, we did not observe the expected decoupling of fluxes from temperature at low moisture contents reported by some studies (Davidson et al., 1998; Lavigne et al., 2004; Jassal et al., 2008). Even though we observed a drastic reduction in moisture and a clear relationship between moisture and flux, the daily pattern in res-10
piration rates at low moisture contents were still driven by diurnal temperature changes (data not shown). Shallow soils of coniferous forests are populated by fungi and actino-mycetes, which are indeed better adapted to drought conditions than bacteria (Orchard and Cook, 1983; Fritze et al., 2000), and so perhaps the microbial communities of these soils are able to tolerate extended drought stress. In addition, water vapour moves 15
through soil diurnally with temperature, and this moisture could have been enough to sustain a low level of microbial activity. For instance, Dirks et al. (2010) found that in chronically dry soils, water vapour movement determines the daily variation in flux.
Temperature sensitivity
This study isolated the temperature sensitivity of SOM decomposition in the absence 20
of confounding disturbance effects. While the methodology does not entirely reproduce field conditions (i.e. no constant supply of readily decomposable substrate), the use of intact soil cores allowed for a more realistic examination than incubations of processed soil.
The temperature sensitivity estimates calculated from these results were generally 25
BGD
8, 1369–1409, 2011Moisture and temperature
sensitivity
C. E. Gabriel and L. Kellman
Title Page
Abstract Introduction
Conclusions References
Tables Figures
◭ ◮
◭ ◮
Back Close
Full Screen / Esc
Printer-friendly Version Interactive Discussion
Discussion
P
a
per
|
Dis
cussion
P
a
per
|
Discussion
P
a
per
|
Discussio
n
P
a
per
Values ofQ10 determined here were also lower than those found in other studies at the ecosystem scale (Raich and Schlesinger, 1992; Xu and Qi, 2001b) and in other laboratory studies (Kirschbaum, 2000; Reichstein et al., 2000; Fierer et al., 2005; Fang and Moncrieff, 2001). Indeed, factors that influence substrate availability, such as phys-ical disturbance and substrate accessibility (Davidson et al., 2006a), are purported to 5
create apparent responses instead of a true temperature sensitivity.
Low temperature sensitivity values (near 2) across a full range of soil moisture con-tents was also unexpected. Soils are thought to be less sensitive to temperature at low moistures (Yuste et al., 2007), with temperature sensitivity increasing up to an in-termediate optimum moisture range and then decreasing again at higher moistures 10
(Craine and Gelderman, 2011; Illeris et al., 2004; Jassal et al., 2008). However, some other studies found little to no change inQ10 with soil moisture for incubated samples (Reichstein et al., 2005; Rey et al., 2005). Perhaps factors other than soil moisture af-fected the incubated soils’ response to temperature that differed from field studies. For instance, many in situ temperature sensitivity estimates would have included the contri-15
bution from roots, which respond to covarying temperature and moisture changes, and affect readily decomposable substrate supply through root exudate delivery. It is likely that the isolated heterotrophic response to temperature as determined from root-free soil cores is distinct from the response from in situ temperature sensitivity estimates: indeed, this experiment may have successfully separated the temperature sensitivity 20
from factors that create an apparent response.
Although deep soils did not exhibit the responses to moisture additions observed in shallow soils, a relationship was observed between temperature and flux for deep soils. Small daily temperature shifts in the constant temperature chamber resulted in no observable change in flux, but the 10◦C shift at the end of the experiment produced 25
BGD
8, 1369–1409, 2011Moisture and temperature
sensitivity
C. E. Gabriel and L. Kellman
Title Page
Abstract Introduction
Conclusions References
Tables Figures
◭ ◮
◭ ◮
Back Close
Full Screen / Esc
Printer-friendly Version Interactive Discussion
Discussion
P
a
per
|
Dis
cussion
P
a
per
|
Discussion
P
a
per
|
Discussio
n
P
a
per
|
and Janssens, 2006), to be greater for subsurface soils than shallow horizons (Liski et al., 1999; Fierer et al., 2003a). In many experimental observations, however, it has been found to be lower than (Gillabel et al., 2010) or similar to that of surface soils (Fang and Moncrieff, 2005; Reichstein et al., 2005). Certainly, it has been found that theQ10
increases for subsurface soils due to the differing sensitivity of the microbial community 5
through depth to temperature changes (Fierer et al., 2003b). However, Conant et al. (2008) and Reichstein et al. (2005) observed that soils which were more depleted in organic matter, such as deep soils, were more sensitive to temperature. This trend was not, however, noted in these soils under the experimental conditions employed.
Many reasons can be suggested for the low temperature sensitivity of deep soil mi-10
crocosms. Deep soil contains a much higher proportion of recalcitrant substrates, such as humic acids, with a lower substrate availability, and so according to enzyme theory, the temperature sensitivity should be high, as long as substrate release itself is tem-perature sensitive (Larionova et al., 2007; Gershenson et al., 2009). However, other factors can control substrate availability: coniferous soils contain a high proportion of 15
waxy OM which have lower C/N ratios (Gleixner, 2005) and can become water-repellent upon drying, thus reducing availability (Borken and Matzner, 2009). Rewetting did not seem to improve substrate availability for deep soils, and if SOM was hydrophobic, wa-ter additions could not have mobilized substrate in the manner proposed by Xiang et al. (2008). Another possible reason for insensitivity to temperature is nutrient limitations 20
at depth: Fierer et al. (2003a) noted that the addition of N or P increased respiration rates by 450%. Finally, the role of physical protection in attenuating responses of SOM decomposition to temperature, as discussed in Section 4.2, must be considered as a key factor controlling subsoil C dynamics.
4.4 Comparing field and microcosm CO2flux
25
Soil CO2fluxes from the microcosm experiment were in the same range as those from
the field site. Initial respiration rates were slightly higher than the field fluxes, but this difference could be explained by higher temperatures (by 10◦
BGD
8, 1369–1409, 2011Moisture and temperature
sensitivity
C. E. Gabriel and L. Kellman
Title Page
Abstract Introduction
Conclusions References
Tables Figures
◭ ◮
◭ ◮
Back Close
Full Screen / Esc
Printer-friendly Version Interactive Discussion
Discussion
P
a
per
|
Dis
cussion
P
a
per
|
Discussion
P
a
per
|
Discussio
n
P
a
per
and by the contribution by decaying root structures to the labile C pool (Reichstein et al., 2005).
Fluxes decreased quickly over a period of 20 days, leveling offover time, in a manner that could not be explained by temperature or moisture. After that initial large decay during the equilibration period, any declines in flux could be accounted for by changes 5
in moisture levels. This trend has been observed in other studies with intact cores and has been attributed to the rapid decomposition of severed fine root structures (labile C) in organic horizons (O’Connell, 1990; Reichstein et al., 2005). After this equilibration period, the response of flux can be assumed to be primarily from native SOM instead of substrate released as a result of extraction artifacts. Overall, the similarity in fluxes 10
between field and lab points to minimal disturbance incurred from the extraction. The seasonal temperature sensitivity estimate,Q10 (calculated with Eq. 3), for root exclusion plots was 3.10 (with rewetting events removed from the data), but the tem-perature sensitivity estimates determined from the climate-controlled chamber were close to 2. While temperature sensitivity estimates from field root exclusion sites are 15
higher, the surface CO2 fluxes from these field sites are in the same range as the
in-cubations. We interpret this to mean that the observed temperature sensitivity of SOM decomposition is artificially inflated due to processes that are functioning only in situ. Temperature-related processes that control substrate accessibility should be consid-ered (Davidson et al., 2006a), including the activity of soil fauna, and other biological 20
processes that influence nutrient turnover. For instance, perhaps the small amount of ground vegetation and associated fungi on the surface of the root exclusion plots, while absent directly under the PVC collar where CO2 flux was measured, played a role in altering the response of SOM decomposition to temperature. If incubated soil cores consistently underestimate the temperature sensitivity of root exclusion plot soils, this 25
BGD
8, 1369–1409, 2011Moisture and temperature
sensitivity
C. E. Gabriel and L. Kellman
Title Page
Abstract Introduction
Conclusions References
Tables Figures
◭ ◮
◭ ◮
Back Close
Full Screen / Esc
Printer-friendly Version Interactive Discussion
Discussion
P
a
per
|
Dis
cussion
P
a
per
|
Discussion
P
a
per
|
Discussio
n
P
a
per
|
Relevance to in situ processes
Rewetting of the shallow soil surface layers results in a higher soil flux for up to 5 days. Fluxes from trenched and clear cut soils, which likely experience surface drying and high subsurface moisture due to decreased root uptake, can be susceptible to a higher dependency on water content, since high pulses of CO2result from rainfall events, and
5
very low or negative fluxes can result from saturation of the soil profile. This should be taken into account for ecosystem modelling along forest landscape gradients, and more work should be performed to quantify rewetting effects. Throughout the year these forest soils will be within the optimum moisture range, with only surface soils possibly dropping below the lower moisture threshold. This was apparent from the relationship 10
between soil respiration and temperature (Fig. 7). The removal of points immediately after rainfall events improved the fit for exponential flux temperature relationships.
5 Conclusions
Overall, this study demonstrates that for soil moisture conditions experienced by most sites in this region, flux-temperature relationships alone can be used to reasonably 15
estimate heterotrophic respiration. It is only at extremes that moisture exerts a more important control upon soil respiration.
This incubation approach is a valid intermediate between field root exclusion plots and standard laboratory soil incubations. Heterotrophic respiration from soil cores are consistent with the surface flux observed at the field sites, yet allow for the controlled 20
manipulation of a single variable at a time. Soil cores retain the intact soil structure and thus mimic realistic physical controls on SOM decomposition, a factor which is particularly important for obtaining realistic estimates from deep soils.
BGD
8, 1369–1409, 2011Moisture and temperature
sensitivity
C. E. Gabriel and L. Kellman
Title Page
Abstract Introduction
Conclusions References
Tables Figures
◭ ◮
◭ ◮
Back Close
Full Screen / Esc
Printer-friendly Version Interactive Discussion
Discussion
P
a
per
|
Dis
cussion
P
a
per
|
Discussion
P
a
per
|
Discussio
n
P
a
per
intensive, this approach is recommended for those trying to understand soil processes that might be altered by the conditions of standard laboratory incubations.
Acknowledgements. We would like to acknowledge and thank the Natural Sciences and Engi-neering Research Council (NSERC), Canada Research Chairs (CRC), the Canadian Founda-tion for Climate and Atmospheric Sciences (CFCAS), and the Atlantic InnovaFounda-tions Fund (AIF)
5
for their support in financing this study. Thanks is extended to P. Romkey and the staff at the K.C. Irving Environmental Science Centre, and to M. Lavigne of Canada Forest Service, NB. Many thanks to everyone at the Environmental Sciences Research Centre (ESRC) for their tremendous help. In particular, we would like to recognize J. MacDonald, A. Diochon, H. Beltrami, and D. Risk for lending their support, advice and technical expertise to this project.
10
Thanks to A. Diochon for thoughtful comments on this manuscript.
References
Agren, G. and Bosatta, E.: Reconciling differences in predictions of temperature response of soil organic matter, Soil Biol. Biochem., 34, 129–132, 2002. 1371
Almagro, M., Lopez, J., Querejeta, J., and Martinez-Mena, M.: Temperature dependence of soil
15
CO2 efflux is strongly modulated by seasonal patterns of moisture availability in a Mediter-ranean ecosystem, Soil Biol. Biochem., 41, 594–605, 2009. 1386
Baldocchi, D., Tang, J., and Xu, L.: How switches and lags in biophysical regulators affect spatial-temporal variation of soil respiration in an oak-grass savanna, J. Geophys. Res.-Biogeo., 111, G02008, doi:10.1029/2005JG000063, 2006. 1373
20
Ball, B., Virginia, R., Barrett, J., Parsons, A., and Wall, D.: Interactions between physical and biotic factors influence CO2flux in Antarctic dry valley soils, Soil Biol. Biochem., 41, 1510– 1517, 2009. 1386
Batjes, N.: Total carbon and nitrogen in the soils of the world, Eur. J. Soil Sci., 47, 151–163, 1996. 1371
25
Beare, M., Gregorich, E., and St-Georges, P.: Compaction effects on CO2and N2O production during drying and rewetting of soil, Soil Biol. Biochem., 41, 611–621, 2009. 1373
BGD
8, 1369–1409, 2011Moisture and temperature
sensitivity
C. E. Gabriel and L. Kellman
Title Page
Abstract Introduction
Conclusions References
Tables Figures
◭ ◮
◭ ◮
Back Close
Full Screen / Esc
Printer-friendly Version Interactive Discussion
Discussion
P
a
per
|
Dis
cussion
P
a
per
|
Discussion
P
a
per
|
Discussio
n
P
a
per
|
Borken, W. and Matzner, E.: Reappraisal of drying and wetting effects on C and N mineraliza-tion and fluxes in soils, Glob. Change Biol., 15, 808–824, 2009. 1391
Bosatta, E. and Agren, G.: Soil organic matter quality interpreted thermodynamically, Soil Biol. Biochem., 31, 1889–1891, 1999. 1388
Chabbi, A., Kogel-Knabner, I., and Rumpel, C.: Stabilised carbon in subsoil horizons is located
5
in spatially distinct parts of the soil profile, Soil Biol. Biochem., 41, 256–261, 2009. 1388 Conant, R., Steinweg, J., Haddix, M., Paul, E., Plante, A., and Six, J.: Experimental warming
shows that decomposition temperature sensitivity increases with soil organic matter recalci-trance, Ecology, 89, 2384–2391, 2008. 1391
Craine, J. and Gelderman, T.: Soil moisture controls on temperature sensitivity of soil organic
10
carbon decomposition for a mesic grassland, Soil Biol. Biochem., 43, 455–457, 2011. 1390 Davidson, E. and Janssens, I.: Temperature sensitivity of soil carbon decomposition and
feed-backs to climate change, Nature, 440, 165–173, 2006. 1390
Davidson, E., Belk, E., and Boone, R.: Soil water content and temperature as independent or confounded factors controlling soil respiration in a temperate mixed hardwood forest, Glob.
15
Change Biol., 4, 217–227, 1998. 1372, 1386, 1389
Davidson, E., Janssens, I., and Luo, Y.: On the variability of respiration in terrestrial ecosys-tems: moving beyond Q(10), Glob. Change Biol., 12, 154–164, 2006a. 1371, 1372, 1381, 1390, 1392
Davidson, E., Savage, K., Trumbore, S., and Borken, W.: Vertical partitioning of CO2 production
20
within a temperate forest soil, Glob. Change Biol., 12, 944–956, 2006b. 1387
Denef, K., Six, J., Paustian, K., and Merckx, R.: Importance of macroaggregate dynamics in controlling soil carbon stabilization: short-term effects of physical disturbance induced by dry-wet cycles, Soil Biol. Biochem., 33, 2145–2153, 2001. 1371
Di Domenico, A., Laguardia, G., and Fiorentino, M.: Capturing critical behaviour in soil moisture
25
spatio-temporal dynamics, Adv. Water Resour., 30, 2145–2153, 2007. 1386
Diochon, A.: The Size, Structure, and Mineralization Potential of the Soil Organic Carbon Pool in a Managed Red Spruce (Picea rubens Sarg.) Forest Chronosequence, Doctoral, Dal-housie University, 2009. 1402
Diochon, A. and Kellman, L.: Natural abundance measurements of C-13 indicate increased
30
deep soil carbon mineralization after forest disturbance, Geophys. Res. Lett., 35, L14402, doi:10.1029/2008GL034795, 2008. 1375, 1388
BGD
8, 1369–1409, 2011Moisture and temperature
sensitivity
C. E. Gabriel and L. Kellman
Title Page
Abstract Introduction
Conclusions References
Tables Figures
◭ ◮
◭ ◮
Back Close
Full Screen / Esc
Printer-friendly Version Interactive Discussion
Discussion
P
a
per
|
Dis
cussion
P
a
per
|
Discussion
P
a
per
|
Discussio
n
P
a
per
of deep soil carbon following harvesting of a temperate coniferous forest, J. Geophys. Res.-Biogeo., 114, G01016, doi:10.1029/2008JG000844, 2009. 1375
Diochon, A., Kellman, L., and Beltrami, H.: Looking deeper: An investigation of soil carbon losses following harvesting from a managed northeastern red spruce (Picea rubens Sarg.) forest chronosequence, Forest Ecol. Manag., 257, 413–420, 2009. 1375
5
Dirks, I., Navon, Y., Kanas, D., Dumbur, R., and Grunzweig, J.: Atmospheric water vapor as driver of litter decomposition in Mediterranean shrubland and grassland during rainless seasons, Glob. Change Biol., 16, 2799–2812, 2010. 1389
Fang, C. and Moncrieff, J.: The dependence of soil CO2 efflux on temperature, Soil Biol. Biochem., 33, 155–165, 2001. 1372, 1373, 1390
10
Fang, C. and Moncrieff, J.: The variation of soil microbial respiration with depth in relation to soil carbon composition, Plant Soil, 268, 243–253, 2005. 1371, 1391
Fierer, N., Allen, A., Schimel, J., and Holden, P.: Controls on microbial CO2 production: a comparison of surface and subsurface soil horizons, Glob. Change Biol., 9, 1322–1332, 2003a. 1372, 1387, 1391
15
Fierer, N., Schimel, J., and Holden, P.: Variations in microbial community composition through two soil depth profiles, Soil Biol. Biochem., 35, 167–176, 2003b. 1391
Fierer, N., Craine, J., McLauchlan, K., and Schimel, J.: Litter quality and the temperature sensitivity of decomposition, Ecology, 86, 320–326, 2005. 1390
Fontaine, S., Barot, S., Barre, P., Bdioui, N., Mary, B., and Rumpel, C.: Stability of organic
20
carbon in deep soil layers controlled by fresh carbon supply, Nature, 450, 277–280, 2007. 1388
Fritze, H., Pietikainen, J., and Pennanen, T.: Distribution of microbial biomass and phospholipid fatty acids in Podzol profiles under coniferous forest, Eur. J. Soil Sci., 51, 565–573, 2000. 1389
25
Gershenson, A., Bader, N., and Cheng, W.: Effects of substrate availability on the temperature sensitivity of soil organic matter decomposition, Glob. Change Biol., 15, 176–183, 2009. 1391
Giardina, C. and Ryan, M.: Evidence that decomposition rates of organic carbon in mineral soil do not vary with temperature, Nature, 404, 858–861, 2000. 1371
30