! "# $ % # &
' ()* + ' ,-* * . / / 0/1)2
, -$2)2/1 . / */( 03
1School of Engineering, Taylor’s University, Taylor's Lakeside Campus,
No. 1 Jalan Taylor's, 47500, Subang Jaya, Selangor DE, Malaysia 2
Center of Excellence on Lightning Protection (CELP)
Department of Electrical and Electronics Engineering, Universiti Putra Malaysia
3
Institute of High Voltage & High Current (IVAT), UTM, Malaysia *Corresponding Author: [email protected]
Abstract
Backfill materials like Bentonite and cement are effective in lowering grounding resistance of electrodes for a considerable period. During lightning, switching impulses and earth fault occurrences in medium and high voltage networks, the grounding system needs to handle extremely high currents either for a short duration or prolonged period respectively. This paper investigates the behaviour of bentonite, cement and sand under impulse and alternating high voltage (50Hz) conditions. Fulguritic;formation was observed in all materials under alternating high voltage. The findings reveal that performance of grounding systems under high voltage conditions may significantly change from the outcomes anticipated at design stage.
Keywords: Grounding, Backfill materials, Bentonite, High voltage experiment, resistance, Fulgurites.
1. Introduction
Abbreviations
AHV Alternating High Voltage FF
HV MV
Fulguritic Formation High Voltage Medium Voltage
OPC Ordinary Portland Cement RH Relative Humidity TBD Time to Breakdown VBD Voltage at Breakdown
soil stability and thus the strength of the foundation of buildings. In the latter, it is to lower the contact resistance between the grounding electrode and the surrounding earth masses. It is desired not only to lower grounding resistance but to maintain the achieved low values for a long time without much fluctuation [1].
Electrical grounding systems are designed to dissipate unwanted electrical charges as efficiently as possible [2]. The targeted destination of such charges is usually the surrounding soil. Therefore the ideal soil can be said to resemble a “natural capacitor” which has infinite charging capacity and zero discharging capability. In grounding systems designed to cater for lightning protection, considerably large amount of lightning;brought charge has to be dispersed by the grounding system within micro;second time scale. Failure to do such may lead to hazardous effects such as ground potential rise that leads to surface arcing and back;flashover which are deleterious to human safety and integrity of power systems. The opposition to an effective discharge of impulse charge to the ground is quantified by the magnitude of grounding impedance. Simply said, soil with high grounding impedance is not as efficient as soil with low grounding impedance when it comes to distributing transient charge into the soil mass.
In the above backdrop, researchers during the past several decades have started to explore the suitability of using backfill materials to minimise grounding resistance and impedance of electrical grounding systems. For many years, only the effect of backfill materials on grounding resistance was considered. However, with the development of more accessible impulse generators, researchers have realised that the investigation of grounding impedance is essential and vital as such parameter predominantly control the performance of the grounding system in the event of transient currents. Unfortunately, although the significance of understanding impulse behaviour of backfill materials is well known and realised, there is still no extensive research done with regard to such.
3
grounding impedance [5]. Since both soil and backfill materials are significant components of grounding systems, investigation of the behaviour of backfill materials under AHV at 50 Hz and impulse conditions is of great importance in the design engineering of grounding systems.
The need for the investigation of these backfill materials is further justified by the fact that in Ufer ground systems which were widely used in many parts of the world, especially under troubled environments, bentonite, sand and cement are used as major components of the special concrete mixers [2], [6;7].
Another point of concern that comes under the studies of backfill materials in electrical circuits is the formation of solid tubular structures similar to fulgurites in soil. Fulgurite, a term which has been derived from the Latin world fulgur for thunderbolt, is a type of mineral termed mineraloid lechatelierite. Typically they are developed when lightning currents that enter the soil, rapidly melt silica which in turn fuses to a crystalline form as the temperature drops. These crystalline structures are mostly found in quartz sand and silica soil in the hollow tubular form [8]. It has been estimated that fulgurites are formed when the lightning current raises the temperature of soil above 1,800 °C [9]. In the event of lightning current forming fulgurites, the process will take several hundred milliseconds up to few seconds [10]. Lightning currents with large peak current and duration may form long enough fulgurites that may indicate the path of lightning current to some extent [11].
Large leakage current may flow into the ground in the event of a power system fault at MV and HV installations such as substations, power transmission towers or power generation plants. Formation of structures similar to fulgurites has also been reported in the literature [12], in the surrounding soil, where fault current enters. It has been reported in Vanessa et al. [5] that in laboratory experiments conducted with high voltage application, fulgurites or fulgurites;like structures are formed when both sand and backfill materials are subjected to prolonged currents [5].
By strict definition fulgurites are lightning current caused, tubular or dendrite structures formed in soil that contain high amount of silica;quartz. In this sense it is erroneous to call the solidified structures formed under Alternating High Voltage (AHV) in backfill materials used in this study as fulgurites. Hence, until the structures are properly baptised, we will use the term Fulguritic;formation (FF) for these structures.
Although not much work has been done on FF, one can anticipate larger resistivity of these structures due to the high content of fused silica. Furthermore such FF may adversely affect the compactness of the soil increasing the grounding resistance of the electrode further.
Therefore, the warranted motivation to conduct this research work is to investigate the breakdown characteristics and property change of several backfill materials under HV conditions in a detailed manner.
2. Experimental Procedures
4
characteristics of different bentonite types. Physical and chemical properties of these bentonite materials are given in Table 1 [1]. Further details of these two types of bentonite can be found in literature [1]. These materials are chosen as they are the most common backfill materials for electrical grounding purpose. Bentonite is a purposely introduced backfill material which have been regarded as good grounding resistance reducing agent [4]. For the last decade, several grounding system manufacturers have been using bentonite and to a relatively less extent, cement due to the positive outcome of research done on them. There is slight variation of types of bentonite available in the industry as well [1]. Therefore, a part of this work was also devoted to investigate whether there is any significant difference in the impulse behaviour of 2 different types of bentonite namely B1 and B2.
Table 1. Physical Properties of Bentonite [1].
Type of Bentonite Dry density (kg/m3 ) Absorption capability (%) Swelling capacity (%) Hydrated density (kg/m3 )
B1 1000 160 220 1295
B2 1000 130 180 1194
B1 was specified by manufacturer as sodium bentonite whereas B2 was unknown. Upon performing Energy Dispersive X;ray spectroscopy, it was found that both B1 and B2 predominantly consists of O, Na, Mg, Al, Si, Cl, Ti and Fe elements but with different weight percentages. Hence both are identified as sodium bentonite due to the presence of sodium (Na) elements [1]. This has caused a significant difference in their resistivity which can be found in [1]. However it remains to be investigated whether there will be significant difference in their behaviour under HV impulse condition.
Ordinary Portland Cement (OPC) produced in Malaysia was chosen as it is the commonest type of cement used in the concrete industry. It is mainly consist of Ca, O, Si elements. As aforementioned, concrete is the main component of Ufer ground and its electrical properties are largely determined by the characteristic of cement. A typical concrete consist of three main phases namely the aggregate phase (sand and gravel), mortar phase (hydrated cement) and the transition phase (the boundary of mortar and aggregate phase). Large portion of current will flow through the mortar phase which is of the least impedance. Therefore study of cement’s behaviour under HV impulse condition is highly justified.
Fine river sand was used in this experiment. Sand is largely consists of Si and O elements. The sand was dried for a week prior to the experiment because typical sand obtained from the vendors is usually exposed to rain. Any small gravel mixed with the sand was carefully filtered off.
was monitored by averaging the readings of two RH;meters of different models. These two parameters and the atmospheric pressure in the lab (approximated as 101.3kPa) were used in the calculations of the breakdown voltage of the materials.
Experimental setup was arranged as shown in Figs. 1 and 2. For the part of impulse testing 1.2/50 µs lightning impulses with positive polarity were planned to be applied by the Marx generator to a 50 mm gap. It is done for the reasons of comparison as most previous work has been done on positive polarity. Up and down method was used with 5 kV increments to determine the 50% breakdown voltage of the air gap. The 50 mm gap was then filled with backfill material and the experiment was repeated. The filling of materials into the stainless steel container was done in the following manner.
Fig. 1. HV Impulse Experimental Setup.
Fig. 2. Configuration of Setup for HV Impulse.
electrode is carefully adjusted so that the tip of it just touches the bentonite powder at the center. This is to ensure that the gap is precisely 50 mm. This 50 mm gap was maintained throughout the entire experiment.
The experiments were repeated by replacing impulse generator with an AHV at 50 Hz generator as described below. The term Alternating High Voltage was deemed more appropriate compared to the conventional High Voltage Alternating Current as it is high voltage with alternating polarity which is generated and injected to the specimen and not high current with alternating polarity. In fact, the waveforms acquired and to be analysed in later sections are voltage waveforms instead of current waveforms.
A cylindrical container of 50 cm diameter and 50 cm depth was filled with the backfill materials of interest up to 15 cm as shown in Figs. 3 and 4. Then, Alternative high voltage HV was applied until breakdown starting from 4 kV with gradual increments. 4kV was the minimum voltage that could be generated by the instrument. The upper limit of voltage was decided based on the material and its status (wet or dry). Relative humidity and temperature of the lab was noted down. Only sand and Bentonite were tested as it was reported that cement does not undergo any significant physical changes upon application of AHV in the work done by Laverde et al [5]. After each increment, AHV was applied constantly at the material for 10 seconds. The corresponding temperature at the surface of the materials was measured using Fluke 62 Mini Infrared Thermometer. The laser pointer of the thermometer was pointed to the spot at which the conductors of the AHV electrode made contact with the material. In addition, any physical changes to the materials were observed. The voltage source was automatically tripped once breakdown occurred and the corresponding breakdown voltage was recorded.
Fig. 3. Experimental Setup.
5
3.Results and Discussion
The impulse and AHV response of backfill materials are analysed in this paper.
3.1. Impulse test
3.1.1. Breakdown characteristics of materials
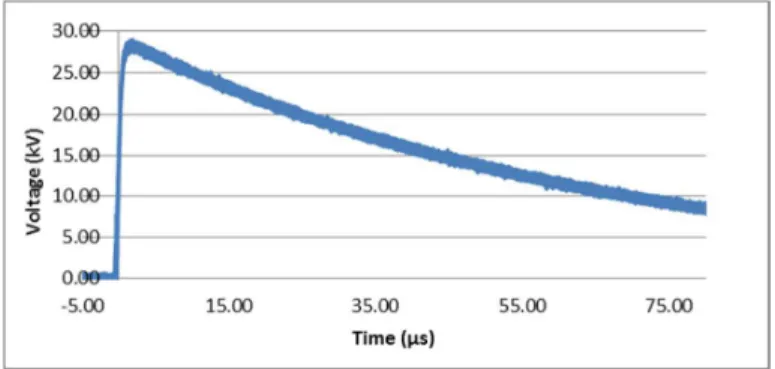
Breakdown characteristics of air gap were treated as the reference for breakdown characteristics of bentonite, cement and sand. Figure 5 shows the standard waveform of impulse generator which can be characterised approximately as a 1.2/50 µs wave profile. This waveform typically represents the expected standard lightning impulse voltage profile although there are several field measurements done in the literature which indicated the true profile is not as regular as this [13].
Fig. 5. Non3breakdown Characteristic of Air.
Figure 6 shows the breakdown characteristic of air when subjected to 50 kV impulses. There is an oscillation of rise and fall of voltage with declining amplitudes as time progresses. This is most likely due to reflections of impulse voltage due to impedance mismatching in the grounding path. In other words, the voltage is reflected because impedance of air is much higher than impedance of ground.
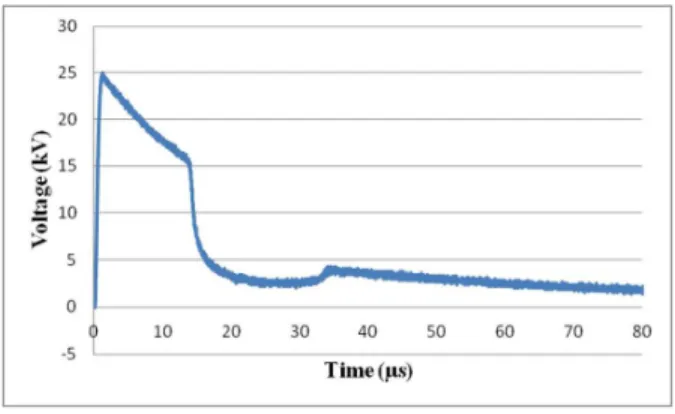
Figure 7 shows the breakdown characteristic of B1 subjected to 30 kV. It is interesting to note that the voltage cuts off at 25 kV instead of close to 30 kV. Similar observations were noted for other breakdown occasions of B1 and B2. This phenomenon is unlike those of air, sand and cement whereby it cuts off at a voltage very close to the injected voltage as seen in Figs. 6, 8;9. The breakdown characteristic of B2 was not shown as there is no noticeable difference between the two based on the voltage profile alone. However as pointed out in [1], different types of bentonite exhibit different physical properties and low frequency electrical properties. As will be discussed in coming section, there is indeed a significant difference in their voltage at breakdown characteristic. Unlike the breakdown profile of air, there is no under;damped oscillation (indicated by the absence of reflections) as in Fig. 6. This is understandable as the impedance of bentonite is much lower than air which means that the issue of impedance of mismatching is reasonably resolved.
Fig. 7. Breakdown Characteristic of Dry B1.
Figure 8 shows the breakdown characteristic of dry cement when subjected to 55 kV. The profile is similar with that of bentonite in Fig. 7 and again there is absence of oscillations as exhibited by air.
Fig. 8. Breakdown Characteristic of Dry Cement.
6
under breakdown condition. This is understandable as sand is coarser and less compact compared to bentonite and cement. Hence, the density of air voids should be higher in sand. This oscillation of voltage also occurred albeit several times more in air suggesting the significance of amount of air voids inside sand which influence its breakdown characteristic to be of closer resemblance to air compared to bentonite and cement.
Fig. 9. Breakdown Characteristic of Dry Sand.
3.1.2. Analysis of data obtained in Up and Down method
Up and Down analysis was done to determine the 50% breakdown voltage of the materials of interest here. The analysis was done based on the methods proposed by Campos [14]. Table 2 shows the respective 50% breakdown voltages. For each material, 25 shots of impulse were fired during the Up and Down method to determine the 50% breakdown voltage. Due to fluctuating nature humidity and temperature of the atmospheric condition in Malaysia which is a tropical country, the lab was air;conditioned throughout the experiment to preserve the temperature and humidity. The ambient temperature and relative humidity in the laboratory ranged from 27.75°C to 28.30°C and from 33;35% respectively. Room pressure was taken as 101.3kPa throughout the experiment.
Table 2. 50% Breakdown Voltage of the Backfill Materials.
Test Materials 50% Breakdown Voltage (kV) Standard Deviation (kV)
Air 47.77 4.6
B1 30.33 4.59
B2 29.5 1.78
Sand 37.83 1.42
Cement 56.67 3.24
constituent materials of cement (gypsum, lime etc.) and cement as an end product to discover the reason behind this unexpected result.
Among the backfill materials under dry condition, dry cement has the highest breakdown voltage followed by dry sand. Dry Bentonite has the lowest breakdown voltage among the 3 types of materials. Among the 2 types of bentonite investigated here namely B1 and B2, there is a slight difference of breakdown strength of less than 1 kV. Low breakdown voltage is a good property from the perspective of performance of backfill materials. Backfill material with low breakdown voltage means that they are relatively easier to undergo breakdown or ionisation thus temporarily raising their conductivity in the event of lightning strike.
3.1.3. Time to breakdown and Voltage at breakdown
Two more important information that can be derived from the impulse tests are the voltage at breakdown and time to breakdown for each backfill material experimented. 50% breakdown voltage is different from voltage at breakdown in the sense that the former defines the required applied impulse voltage in order to sustain 50% chance of electrical breakdown whereas the latter is the potential developed at the material at the event of a breakdown. As aforementioned, 25 shots were fired to each backfill materials when performing the Up and Down Analysis. For each breakdown occasion, the time taken to breakdown as well as the voltage at breakdown were noted and tabulated in Table 3.
Table 3. Time to Breakdown and Voltage at Breakdown.
Material (dry)
Average BD time T1 (µs)
Standard deviation (µs)
Lag/Lead Average
VBD (kV)
Standard deviation (kV)
Air 1.96 0.38 Lag 42.49 2.14
B1 4.03 3.31 Lag 21.04 2.49
B2 5.80 1.24 Lag 17.19 1.31
Cement 1.28 0.28 Lag 51.31 2.70
Sand 1.42 0.29 Lag 37.63 0.99
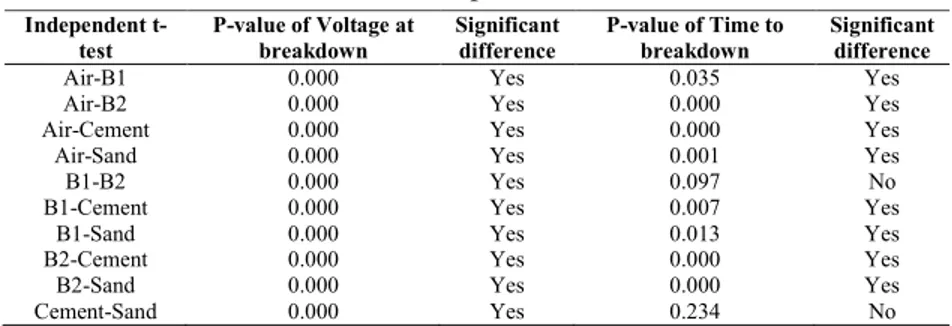
Table 4. Independent t3test.
Independent t3 test
P3value of Voltage at breakdown
Significant difference
P3value of Time to breakdown
Significant difference
Air;B1 0.000 Yes 0.035 Yes
Air;B2 0.000 Yes 0.000 Yes
Air;Cement 0.000 Yes 0.000 Yes
Air;Sand 0.000 Yes 0.001 Yes
B1;B2 0.000 Yes 0.097 No
B1;Cement 0.000 Yes 0.007 Yes
B1;Sand 0.000 Yes 0.013 Yes
B2;Cement 0.000 Yes 0.000 Yes
B2;Sand 0.000 Yes 0.000 Yes
Cement;Sand 0.000 Yes 0.234 No
combinations air;B1, air;B2, air;cement, air;sand, B1;B2, B1;cement, B1;sand, B2;cement, B2;sand and cement;sand as shown in table. The confidence interval was set at 95% which means that there is a statistical significant difference between the materials when the computed P;value is less than 0.05. The given P; values in Table 4 are the gauge used in determining whether the samples have statistically critical difference.
There are several interesting observations that can be made from Table 3. Firstly, the average breakdown time of all materials denoted as T1 and depicted in Fig. 10 falls under the “lag” category. However cement exhibits an average time to breakdown close to the standard rise time. The time T1 is taken as the time at which there is a sudden immense drop in voltage. Lag is defined when the material breakdown at a time later than the standard rise time of 1.2µs. On the other hand, the material is classified as exhibiting “lead” behaviour when it breakdowns before the time of 1.2µs. This typical “lag” behaviour is understandable because the energy from the impulse needs to reach certain level before complete ionisation of air voids within the test specimens occurs. The energy is basically the integral area under the impulse curves. This explanation is further verified by the existence of several “lead” occasions in cement and sand. These “lead” occasions occurred when the highest impulse voltage (among all of the impulse voltage which resulted in breakdown) were applied. This means that when impulse voltage with higher amplitude was applied, time taken for breakdown would be reduced as the energy required to breakdown each material should be constant throughout the experiment. For B1 and B2, breakdown occurs much later after the standard rise time.
In addition, based on Table 4, there are statistically significant difference of the time to breakdown for all possible pairings with the exception of sand;cement and B1;B2. Thus far, B1 and B2 seem to exhibit similar 50% breakdown voltage as well as time to breakdown characteristics.
The other major observation is the voltages developed across bentonite under breakdown conditions are significantly lower than cement and sand. The voltage at breakdown is significantly different between B1 and B2. This trend was further validated by the P;values in Table 4 which indicated that there are statistically significant difference of voltage at breakdown between bentonite with air, sand and cement respectively. In an ideal grounding system under the event of lightning strike, the lightning charges should be neutralised immediately by the soil mass. As backfill materials form the bridges between the grounding electrodes and the soil mass, they have to offer a low impedance path so that ground potential rise could be minimised. The average VBD of the materials shown in Table 3 are analogous to the expected ground potential rise in real case. Therefore, bentonite is again the best backfill material as supported by this argument. Figure 10 shows the expanded graph of behaviour of bentonite B1 under breakdown condition.
breakdown behaviour of bentonite however should not be of major concern in this context of discussion.
Fig. 10. Breakdown time of bentonite
3.2. AHV behaviour of backfill material
The motivation behind this study is to predict what would happen to the characteristic of backfill material used in grounding practices in the event of ground fault or leakage current.
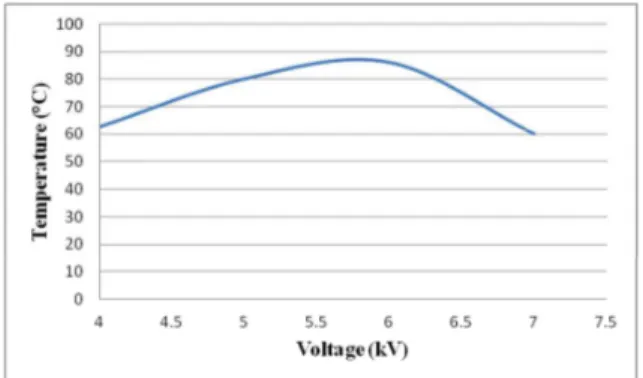
As aforementioned, 4 kV was the minimum AC voltage producible by the generator. Figure 11 depicted the temperature variation of dry bentonite with applied AC voltage. There was a gradual increment of temperature up to 6 kV with a pre;breakdown temperature gradient of 11.7 °C/kV. A crater was formed at the center of the powder mass due to the puffing off bentonite to the air during the gradual increment of voltage.
Fig. 11. Temperature Variation with Applied AC Voltage to Dry Bentonite.
3
due to a fault in the tripping circuit of the generator [5]. AHV experiment on wet bentonite was not conducted as it is expected that breakdown would occur instantly because of its extremely low resistivity at 0.9 Ωm [1].The chemical properties of the material were not known at the moment.
Figure 12 illustrated the temperature variation of dry sand when being subjected to increasing AHV. Similar with bentonite, there was a gradual increment of temperature with increasingly applied AHV up to 40 kV. The pre; breakdown temperature gradient was 2.5°C/kV. However the temperature shot up to 184 °C as it breakdowns at 41.5 kV which is totally the opposite phenomena of breakdown of bentonite. This value is approximately 4 times higher than the 10.5 kV reported in [5]. This seems to suggest that the sand sample used was not completely dry in [5]. Another contradicting result is the absence of fulgurites throughout the experiment with dry sand. In the experiments of Vanessa et al. [5], a project that has been completed by the same research group to whom the authors of this paper belong, a large amounts of FF were formed as the AHV generator did not switch off automatically, possibly due to fault of the tripping circuit. Therefore the generator in [5] could continuously send an increasing value of AC although breakdown has occurred across the material thus resulting in continuous fusion of sands producing more FF as shown in Fig. 14.
Fig. 12. Temperature Variation with Applied AC Voltage to Dry Sand.
Fig. 13. Fulgurites Formed in Bentonite(left) and in Wet Sand (right).
4
poured into the sand and mixed uniformly. Formation of fulgurites in the event of breakdown of sand is confirmed and they can be formed even at voltage much lower than in [5] provided that the sand is wet. The FF in sand as shown in Fig. 13 is more whitish in colour as opposed to black;gray colour of FF found in bentonite. The material crystallizes as it dries off.
In our experiments we have not observed the formation of FF under impulse conditions, most probably due to the short duration low amplitude current impulse injected into the material. Note that we have not measured the wave profile or amplitude of the current in this experiment.
It is of interest to find both the intrinsic resistivity of FF and the bulk resistance of a mass of background material after FF is formed. This information will be published in a separate paper as the experiments are now under way.
Fig. 14. Fulgurites Formed in Bentonite (left) and Sand (right) [5].
4. Conclusions
This work has been carried out in order to find the behaviour of various backfill materials and sand under high voltage conditions. Such information is greatly needed in determining the materials to be used in electrical earthing systems. A summary of our findings is given below.
Sand, two types of bentonite and cement have been tested under alternating high voltage waveforms and impulse current waveforms. For reference purpose, the characteristics of a rod;plane gap of length similar to that of the material layer have also been found.
Under the application of impulse voltage and AHV the following observations were done:
• All tested materials exhibited the breakdown in the lagging edge of the waveform. This is especially true for bentonite.
• Sand exhibit breakdown characteristics similar to air up to a certain extent. It has V50% and voltage at breakdown of approximately 21% and 12% lower than air respectively.
• The two types of bentonite exhibited slightly different values of voltage at breakdown but have similar 50% breakdown voltage and statistically similar time to breakdown. Such observations lead to the conclusion that breakdown properties of bentonite under HV conditions are hardly dependent on the type of bentonite.
• The voltage at breakdown for dry bentonite is the lowest of the materials which suggests that it will give rise to the lowest ground potential rise when implemented in real application as backfill material.
• AHV breakdown strength of bentonite is less than that of sand.
• Bentonite dissipates heat at rate greater than that of sand in the event of breakdown under AHV.
• Fulgurites can be formed at bentonite and sand but the latter is possible at much lower AHV in the presence of moisture.
The work of this paper thus suggests that bentonite is a good backfill material among the selected specimens under dry condition. Future work should be done regarding impulse behaviour of moistened cement, bentonite and sand. It would be of interest to investigate the physical and chemical properties of the fulgurites formed by bentonite and sand respectively. Also, negative polarity impulse should be attempted in order to draw possibly useful comparison with the results obtained here.
Acknowledgements
Authors would like to thank CELP, Universiti Putra Malaysia, IVAT, Universiti Teknologi Malaysia and TNBR for their immense support in making this investigation a success.
References
1. Lim, S.C.; Gomes, C.; and Kadir, M.Z.A.A. (2013). Characterizing of bentonite with chemical, physical and electrical perspectives for improvement of electrical grounding systems.
, 8(9), 11429;11447.
2. Lim, S.C.; Gomes, C.; and Kadir, M.Z.A.A. (2013). Electrical earthing in troubled environment.
, 47, 117;128.
3. Cooray, V.; Zitnik, M.; Manyahi, M.; Montano, R.; Rahman, M.; and Liu, Y. (2004). Physical model of surge;current characteristics of buried vertical rods in the presence of soil ionisation. , 60(2;4), 193;202. 4. Gomes, C.; Lalitha, C.; Lim, S.C.; and Kadir, M.Z.A.A. (2014). Industrial
wastes and natural substances for improving electrical earthing systems. , 21(2), 39;47.
5. Laverde, V.; Kadir, M.Z.A.A.; and Gomes, C. (2012). Performance of backfill materials under impulse and AC testings.
6. Gomes, C.; and Diego, A.G. (2011). Lightning protection scenarios of communication tower sites; human hazards and equipment damage.
, 49(10), 1355;1364.
7. Lim, S.C.; Gomes, C.; Buba, S.D.; Kadir, M.Z.A.A.; and Jasni, J. (2012). Preliminary results of the performance of grounding electrodes encased in
bentonite;mixed concrete. ,1;5.
8. Codding, P.W. (1998).
. Springer, 27.
9. Ege, C. (2005). ? Utah
Geological Survey, 37.
10. Grapes, R.H. (2006). . Springer Science, 28.
11. Uman, M.A. (2008). ! . Cambridge.
12. Rakov, V.A. (1999). Lightning makes glass. 29 "
# " .
13. Sharma, S.R.; Fernando, M.; and Gomes, C. (2005). Signatures of electric field pulses generated by cloud flashes. "
! , 67(4), 413;422.
14. Campos, R. (1995). # .
![Table 1. Physical Properties of Bentonite [1].](https://thumb-eu.123doks.com/thumbv2/123dok_br/16461093.198288/4.918.158.639.317.385/table-physical-properties-of-bentonite.webp)


![Fig. 14. Fulgurites Formed in Bentonite (left) and Sand (right) [5].](https://thumb-eu.123doks.com/thumbv2/123dok_br/16461093.198288/14.918.240.562.340.496/fig-fulgurites-formed-bentonite-left-and-sand-right.webp)
