ANALYSIS OF THE OPERATION OF A MICROGRID WITH RENEWABLE
DISTRIBUTED GENERATION
Thematic topic 2: Smart grids / Smart Measurement / Microgrids
Vicente Leite
1,2, Ângela Ferreira
1,2, José Batista
1and José Couto
11Polytechnic Institute of Bragança, School of Technology and Management, Campus de Santa Apolónia, Apartado 1134, 5301-857
Bragança, Portugal, {avtl, apf, jbatista}@ipb.pt and [email protected]
2CISE - Electromechatronic Systems Research Centre, UBI, Covilhã, Portugal
ABSTRACT
This article reports the ongoing research on the performance assessment of an experimental microgrid which integrates various renewable energy sources. The microgrid is based on a modular commercial solution, up to a rated power of 5 kW, integrating storage devices, a backup diesel generator and various renewable energy sources and also distributed energy sources developed under ongoing R&D projects, such as the integration of a pico hydropower plant with an interface able to perform power factor compensation of the microgrid, which is introduced briefly. The performance assessment of this microgrid is conducted through a characterization of different operational states and also a preliminary energy balance of the microgrid during a time span of 4 days.
Keywords: Microgrids, Distributed Generation, Self-Sustainable Systems.
1.
INTRODUCTION
Microgrids are considered a basic feature of future active distribution networks, able to take full advantage of distributed energy resources (DERs), if coordinated and operated efficiently. They offer a potential solution for sustainable, energy-efficient power supply, providing a solution for increasing load growth and grid expansion deferral. In addition, they are a viable solution to electrification of remote areas, generation of clean power and reduction of carbon emissions, thereby contributing to the commitments of most developed countries to meet their greenhouse gas emissions targets or, otherwise, substantially reduce their carbon footprints. They also implement the presence of generation close to demand which can increase the power quality and reliability of electricity delivered to sensitive end uses.
From the main grid’s perspective, a microgrid may be seen as a cluster of DERs, controlled locally in a cooperative approach that behaves as a single producer or consumer. In addition, the microgrid must be able to operate safely and efficiently in islanding mode.
The integration of DERs based on renewable sources creates a daunting challenge for the safe and efficient operation control. The non-dispatchable characteristic of most renewable sources requires considerable operational control capabilities and storage devices. Storage is used to smooth the output and variability of renewable sources, such as solar and wind energy. Recent advances in battery technologies and mass production for electric vehicle applications, may provide additional energy storage systems, under the Vehicle-to-Grid (V2G) and Grid-to-Vehicle (G2V) concept (Yilmaz, Krein, 2013).
(Leite, et al., 2012a; Leite, et al., 2013b). This small microgrid has been developed as a research platform and also for demonstration purposes in the context of an university campus, as part of a wider project named VERCampus – Live Campus of Renewable Energies. This project integrates a set of technologies, infrastructures, and initiatives carried out in the university Campus of the Polytechnic Institute of Bragança (IPB) regarding the renewable energies technologies and distributed power generation systems promotion and dissemination for IPB students, stakeholders and all community in general (Leite, et al., 2012a).
The focus of this work is the performance analysis of the microgrid in islanding and grid connected modes, through the characterization of the power flow in different operational states of the microgrid. It is also reported the energy balance for a given time period in order to evaluate the energy efficiency.
The paper is organized as follows: section 2 presents briefly the microgrid, its components and also the experimental setup which has been used to emulate a pico hydropower plant; section 3 describes the performance of the microgrid through the analysis of different operating states selected by their relevance and also discusses the energy balance into the microgrid and finally, section 4 summarizes the main conclusions.
2.
DESCRIPTION OF THE MICROGRID
2.1. The IPB Microgrid Project
The IPB microgrid is based on a bi-directional converter which is responsible for establishing a single-phase system with stable voltage and frequency (230 V, 50 Hz), thus enabling the use of conventional loads, providing energy to end users without noticing any difference between the islanding and grid connected modes. It integrates several DERs based on renewable sources (photovoltaic, wind, hydro, etc.), to generate electrical energy. Microgrids typically use a battery bank as the main storage device, even though other energy storage elements can be integrated, as the batteries of electric vehicles. This solution has been proposed as a viable solution in the context of V2G and G2V (Ferdowsi, 2007; Tuttle, Baldick, 2012; Yilmaz, Krein, 2013).
The operation of the microgrid, in general terms, can be described as follows. When energy from distributed sources is higher than the consumption, the bi-directional inverter allows the charge of the battery bank and when the availability of the primary resources are not enough for load following, it provides the necessary energy from the batteries. In a scenario where the energy requested by users is excessive, load shedding can be performed and when consumption is low and the batteries are fully charged, surplus production can be dissipated on heating or ventilation. In cases when the consumption is excessive and load shedding cannot be accomplished, the inverter can automatically start a backup generator based on fossil fuel. Indeed, the off-grid system should use, with priority, renewable energy sources such as photovoltaic, wind, hydro or other renewable energy resources. In alternative to conventional fuel, biodiesel, which may be produced locally, conveys to an augmented sustainable solution.
This modular system can be easily expanded for grid reinforcement by using inverters in parallel or by creating a three-phase grid, with an inverter per phase and other microgeneration units can be connected directly to the microgrid. This possibility of expanding the grid can be used due to the characteristics of flexibility and modularity of the technology. Thus, it is possible, at any time, move from one house to the electrification of a building or a small isolated village.
The IPB microgrid, presented in Figure 1, has been implemented in a laboratory of the School of Technology and Management of IPB, for isolated and self-sustainable systems up to a rated power of 5 kW, integrating renewable energy sources with the purpose of being a demonstration platform in terms of technology transfer and applied research.
Figure 1.- The microgrid laboratory facilities.
Even a small microgrid like this one, can integrate several distributed power systems and energy storage elements. Brief details of the commercial distributed energy systems integrated in this microgrid are given below (Leite, et al., 2012a):
-
A small 1,4 kWp wind turbine Passaat WT from Fortis, with a protection box and an inverter WB 1700 from SMA;-
A solar tracker with a photovoltaic (PV) string of 16 PV modules 190GHT-2 from Kyocera, with a peak power of 3 kWp. This PV string is connected to the microgrid through the PV inverter SB 3000 from SMA;-
A PV string installed on the roof of the laboratory which consists of nine PV modules FTS-220P from Fluitecnik, with a peak power of 2 kWp. The PV string is connected to the microgrid through the PV inverter SB 2100TL from SMA;-
A photovoltaic glass facade integrated in the Library of the School of Technology and Management of IPB, where 29 of the existing glasses were replaced by PV glasses. Each one of the PV glass is composed by a set of 24 PV cells connected which account for a peak power of 46,3 Wp and, therefore, the total power of the glass facade is 1 343 Wp;-
A 5 kW electric generator which uses a percentage of biodiesel produced from wasted oils in the biofuels laboratory. The generator is connected to and controlled by the SI 5048.Additional distributed generation systems developed under ongoing research and development (R&D) projects are also being integrated into the microgrid, namely:
-
An electric vehicle using state-of-the-art electric propulsion system based on a high performance controller, an axial permanent magnet synchronous motor and a lithium battery (Leite, et al., 2013a). This electric vehicle is integrated with the microgrid as an additional energy storage element, through a bi-directional power electronic converter, under the context of V2G and G2V (Leite, et al., 2014a; Leite, et al., 2014b)-
A pico run-of-river hydropower plant (Leite, et al., 2012b) with a 1,4 kW permanent magnet synchronous generator which interfaces the microgrid through a rectifier bridge, a DC-DC converter and a voltage source inverter. Prior to its implementation, an emulation platform of the prime mover is carried out, as described in the following section.inv
i
g
2.2. Pico hydropower plant emulation platform
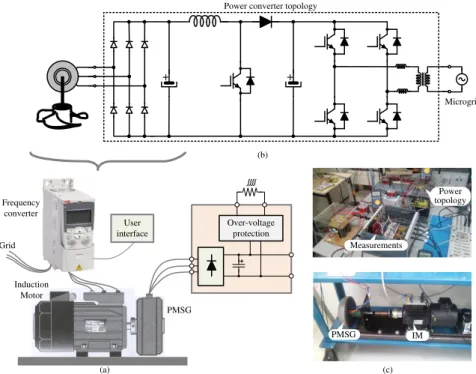
The pico hydropower plant is emulated in laboratory through a prime mover based on an induction motor controlled by a frequency converter (Figure 2 (a)). The permanent magnet synchronous generator (PMSG) interfaces with the microgrid through a power converter, whose topology integrates a rectifier bridge, a DC/DC converter and a voltage source inverter (VSI), as shown in Figure 2 (b). The emulated prime mover and power converter experimental setups are presented in Figure 2 (c).
Over-voltage protection Frequency
converter
Induction Motor
PMSG
Microgrid
Grid
+ +
User interface
Power converter topology
Power topology
Measurements
IM PMSG
(a)
(b)
(c)
Figure 2.- Pico hydro power plant emulation platform: (a) schematic and (c) experimental platform. (b) Power converter topology.
The experimental developed setup of the power converter is based on MATLAB with Simulink and the dSPACE ACE kit based on the 1103 controller board. The VSI was implemented with the intelligent power module (IPM) PM75RLA120 from Powerex. This is a power module with a three-phase 1200 V IGBT VSI plus an IGBT break. The interface circuit BP7B was used for isolation between the IPM and the controller board connector panel. One leg of the IPM was used for the DC/DC converter and the other two legs were used to implement the single-phase VSI. The VSI controls the DC-Link voltage as well as the active and reactive power injected into the grid. The control scheme of the VSI is based on Voltage Oriented Control (VOC) (Samerchur,
et al., 2011).
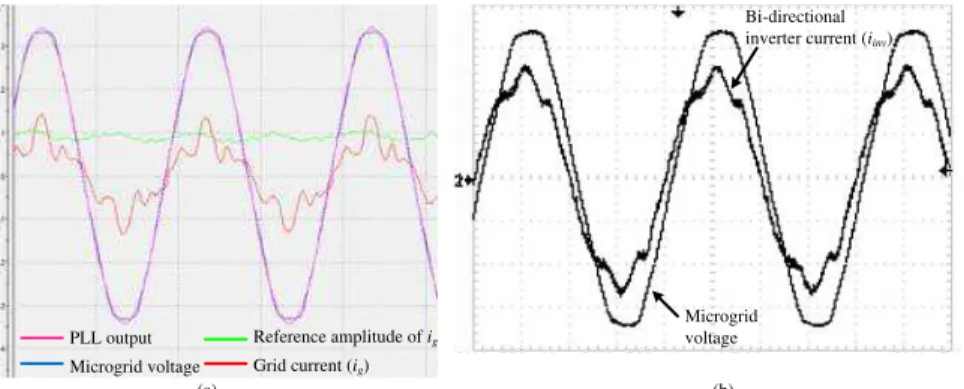
The power converter topology and its control scheme provides complementary reactive power control into the microgrid, additional to the one performed by the main bi-directional inverter. Experimental tests were carried out in order to demonstrate this ability. The analysis is performed through the microgrid voltage and current waveforms in the output of the pico hydropower converter (ig) and in the input AC1 of the bi-directional
inverter (iinv) (cf. Figure 1). The microgrid is set to grid connected mode and feeds a varying power factor load.
PLL output Microgrid voltage
Microgrid voltage
Bi-directional
inverter current (iinv)
Reference amplitude of ig
Grid current (ig)
(a) (b)
Figure 3.- Microgrid voltage and current waveforms in (a) the output of the pico hydropower converter and (b) in the input AC1 of the bi-directional inverter, with lagging power factor load and reactive power reference of
the VSI set to 0 var.
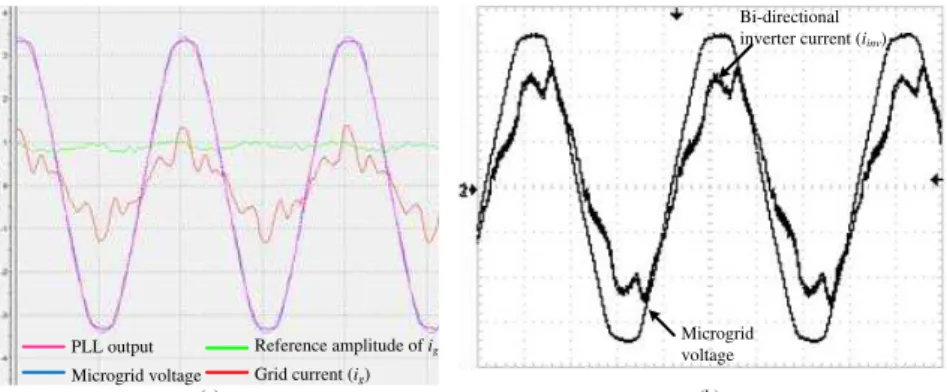
With the same loading conditions, setting up the reactive power reference of the VSI to 400 var, the waveforms assume the phase shifts shown in Figure 4. As shown in Figure 4 (a) the injected current by the pico hydropower converter lags the voltage, performing the required power factor compensation, from which the bi-directional inverter current is now in phase with the voltage (Figure 4 (b)).
Microgrid voltage
(a) (b)
Bi-directional
inverter current (iinv)
PLL output Microgrid voltage
Reference amplitude of ig
Grid current (ig)
Figure 4.- Microgrid voltage and current waveforms in (a) the output of the pico hydropower converter and (b) in the input AC1 of the bi-directional inverter, with lagging power factor load and reactive power reference of
the VSI set to 400 var.
Similar tests with leading power factor load are carried out (Figures 5 and 6). Figures 5 (a) and 6 (a) show the voltage and current waveforms with the pico hydropower converter reactive power reference set to 0 and set to -450 var, respectively. The corresponding current waveforms of the bi-directional inverter (Figures 5 (b) and 6 (b)) demonstrate that in the first case, the power factor compensation is performed by the bi-directional inverter, whilst, in the second case, as the power factor compensation is performed by the pico hydropower converter (since the current leads the microgrid voltage), the current in the bi-directional inverter becomes in phase with the voltage.
Microgrid voltage
Bi-directional
inverter current (iinv)
(a) (b)
PLL output
Microgrid voltage
Reference amplitude of ig
Grid current (ig)
Figure 5.- Microgrid voltage and current waveforms in (a) the output of the pico hydropower converter and (b) in the input AC1 of the bi-directional inverter, with leading power factor load and reactive power reference of
the VSI set to 0 var.
Microgrid voltage
Bi-directional inverter current (iinv)
(b) (a)
PLL output Microgrid voltage
Reference amplitude of ig
Grid current (ig)
Figure 6.- Microgrid voltage and current waveforms in (a) the output of the pico hydropower converter and (b) in the input AC1 of the bi-directional inverter, with leading power factor load and reactive power reference of
the VSI set to -450 var.
3.
ANALYSIS OF THE MICROGRID OPERATION
The analysis of the operation of the microgrid is achieved through the characterization of the active power flow of relevant operating states, in islanding and grid connected modes, and also the energy balance for a given time period, based on monitored data.
As regards the characterization of operational states, it is addressed for several operating time instants during four different days, considering the input power of the renewable energy sources, the exchanged power with external sources and also with the main battery bank. Loads of the microgrid consist in two lighting circuits, with a unit power factor profile. Table 1 reports the ambient temperature (Tamb) and solar radiation for
the time instants in the different days, which relates obviously with the converted power from photovoltaic systems.
The microgrid operating state in each time instant is characterized by the battery bank state of charge (SOC), the diesel generator state (GENset),the active power injected into the microgrid from renewable sources based on the photovoltaic systems and wind turbine (PV and WT, respectively), the active power exchanged with the bi-directional inverter to charge or discharge the battery bank (INV) and with the external sources
(EXT), the main grid or the diesel generator. According to the “generator criterion”, power values are
some entries, which may be explained by different accuracies of load and remote monitoring measurement systems and also, due to possible lack of precise synchronization between them. Nevertheless, the operating state analysis of the microgrid is not compromised by the error margin.
Table 1.- Ambient temperature and solar radiation of different operational states of the microgrid.
Day Hour (h:min) Tamb(ºC) Solar Radiation (W/m2)
1
11:45 15,9 82
13:10 18,9 418,4
14:10 18,7 145,1
22:00 15,4 0
2
09:00 8,8 106,9
11:00 10,4 206
14:00 15,4 842,8
16:00 14,3 648,4
3
10:15 13,5 115,2
11:30 13,7 53,5
14:45 19,3 439,4
17:00 15,6 7,8
4
14:15 19,1 870,8
14:35 24,2 892,3
14:45 21,9 804,7
15:40 22,5 912,3
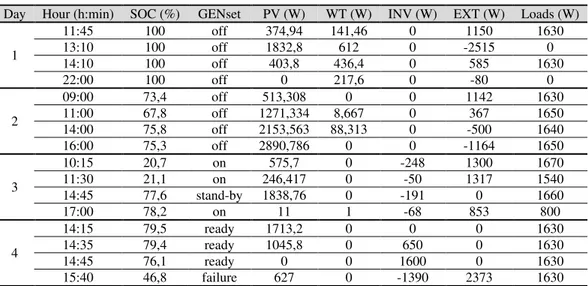
Table 2.- Power flow of different operational states of the microgrid.
Day Hour (h:min) SOC (%) GENset PV (W) WT (W) INV (W) EXT (W) Loads (W)
1
11:45 100 off 374,94 141,46 0 1150 1630
13:10 100 off 1832,8 612 0 -2515 0
14:10 100 off 403,8 436,4 0 585 1630
22:00 100 off 0 217,6 0 -80 0
2
09:00 73,4 off 513,308 0 0 1142 1630
11:00 67,8 off 1271,334 8,667 0 367 1650
14:00 75,8 off 2153,563 88,313 0 -500 1640
16:00 75,3 off 2890,786 0 0 -1164 1650
3
10:15 20,7 on 575,7 0 -248 1300 1670
11:30 21,1 on 246,417 0 -50 1317 1540
14:45 77,6 stand-by 1838,76 0 -191 0 1660
17:00 78,2 on 11 1 -68 853 800
4
14:15 79,5 ready 1713,2 0 0 0 1630
14:35 79,4 ready 1045,8 0 650 0 1630
14:45 76,1 ready 0 0 1600 0 1630
15:40 46,8 failure 627 0 -1390 2373 1630
The microgrid is explored in grid connected mode during days 1 and 2 whilst in days 3 and 4, it is in islanding mode. The commutation between the two modes is set manually.
In grid connected mode, diesel generator is off and the SOC of the battery bank may vary due to prior operating conditions. Power flows from the main grid to the microgrid as long as the renewable sources are not able to generate enough power to feed the load (for instance, at 11:45 on day 1). On the other hand, when there is no load or the power from renewable sources exceeds the load consumption (13:10 on day 1 and 16:00 on day 2, e.g.), power generated into the microgrid is injected in the main grid.
meaning that the power flows from the microgrid to the battery. At 14:45 on day 3, it can be found an operating state where the photovoltaic sources are able to generate enough power to feed the load and the differential is used to charge the batteries, being the generator set to stand-by. The by-directional inverter implements charging and discharging rates of the battery bank in function of its internal impedance in order to optimize the performance and the life span of the batteries. Charging and discharging rates are also function of the available sources, in order to maximize the stored energy from renewable sources (SMA, 2007).
On day 4, at 14:35, since the battery bank has an high SOC, it provides the differential power between loads and renewable sources, thereby the power flow in the by-directional inverter is positive, i.e., it flows from the battery bank to the microgrid. In order to gather further assessments of the microgrid performance, some components system outages have been tested. For instance, at 14:45, after the forced outage of the renewable sources, total power required from the system (loads, losses and internal consumption of the devices) is provided by the battery bank. At 15:40, simulating a failure in the ATS connection of the diesel generator and whit the SOC of the battery bank lower than 50%, the external source is commutated to the main grid, which provides the power required by the loads and also the power used in the charging process of the battery bank.
Regarding voltage and frequency limits, they are monitored and controlled in the microgrid by the bi-directional inverter. In grid connected mode, as long as the voltage and frequency of the main grid is within the predefined permissible range, i.e., in the absence of a grid fault, the frequency and voltage of both grids (main and micro) are the same. In case of a grid fault detected by a deviation of the voltage and/or frequency, the bi-directional inverter forces the islanding mode.
In islanding mode, to synchronize the backup generator with the microgrid, the generator output voltage and frequency must comply with parameterized limits. During this mode, the system voltage depends on the generator voltage when it is running. With regard to the frequency, the bi-directional inverter implements an automatic frequency adjustment in order to prevent malfunction of frequency-sensitive loads (SMA, 2007). In addition, the output power of other source devices may be individually limited in case the upper and lower frequency limits are not complied. This kind of situation arises, for instance, when the battery bank is fully charged and the power from available renewable sources exceeds the power required by the loads. To prevent the overcharging of the battery, the bi-directional inverter changes the microgrid frequency. This frequency adjustment is monitored by the inverters of the distributed generation systems and, as soon as the grid frequency increases beyond a 51 Hz, they decrease their output power linearly in order to bring the frequency back to the rated frequency of the grid. This process, called “Frequency-Shift Power Control”, ends whenever the microgrid frequency reaches 52 Hz (SMA, -). The inverters become inactive, i.e., are disconnected from the microgrid, if the frequency outranges the 50 Hz ±4,5 Hz.
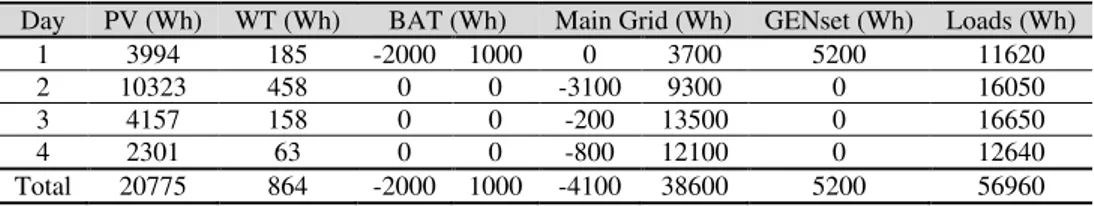
In addition to the characterization of relevant operational states, the active energy balance of the microgrid has also been evaluated. To implement this evaluation, the energy flow has been recorded during a time span of 4 consecutive days, according to Table 3. During part of day 1 the microgrid has been set in islanding mode and in the following days it has been operating in grid connected mode.
Energy exchanges of different sources are considered positive when delivered to the microgrid and negative in the opposite way. From the obtained results, it is possible to make a rough estimation of the energy efficiency of the overall system, which ranges from 93% till 97%.
Table 3.- Energy flow through the microgrid.
Day PV (Wh) WT (Wh) BAT (Wh) Main Grid (Wh) GENset (Wh) Loads (Wh)
1 3994 185 -2000 1000 0 3700 5200 11620
2 10323 458 0 0 -3100 9300 0 16050
3 4157 158 0 0 -200 13500 0 16650
4 2301 63 0 0 -800 12100 0 12640
4.
CONCLUSIONS
Microgrids may be seen as a cluster of DERs, controlled locally in a cooperative approach, able to dampen energy demand from the main grid and to promote widespread access to electricity. When integrating renewable energy sources, as photovoltaic, wind and hydro, microgrids are a key solution on the necessary energy mix to enhance sustainable energy solutions, generate clean power and reduce carbon emissions.
This paper presented a description of an experimental microgrid platform that has been implemented in the IPB facilities, which integrates commercial renewable energy sources and also distributed energy sources developed under ongoing R&D projects, such as the integration of an electric vehicle as an additional energy storage element, in the context of V2G and G2V and the integration of a pico hydropower plant with an interface able to perform power factor compensation into the microgrid.
The performance assessment of this microgrid has been analysed through a characterization of different operational states and also an energy balance of the microgrid during a time span of 4 days. The different operational states allowed a comprehensive analysis on the functioning of the microgrid and its components. From the performed energy balance, a rough estimation of the energy efficiency points out values in a range from 93% to 97%.
ACKNOWLEDGEMENTS
The authors would like to acknowledge the financial support provided by the European Regional Development Fund, under the Interreg Project 0128_PROBIOENER_2_E.