www.ann-geophys.net/25/2029/2007/ © European Geosciences Union 2007
Annales
Geophysicae
The measurements of light high-energy ions in NINA-2 experiment
A. Leonov1,2, M. Cyamukungu1, J. Cabrera1, P. Leleux1, Gh. Gr´egoire1, S. Benck1, V. Mikhailov2, A. Bakaldin2, A. Galper2, S. Koldashov2, S. Voronov2, M. Casolino3, M. P. De Pascale3, P. Picozza3, R. Sparvoli3, and M. Ricci4
1Center for Space Radiations (CSR); Chemin du Cyclotron 2, 1348 Louvain-la-Neuve, Belgium
2Moscow Engineering PHysics Institute (MEPHI), state university; Kashirskoe shosse 31, 115409 Moscow, Russia
3Istituto Nazionale di Fisica Nucleare sezione di Roma2, University of Rome “Tor Vergata”, Via della Ricerca Scientifica 1,
00133 Rome, Italy
4Istituto Nazionale di Fisica Nucleare, Laboratori Nazionali di Frascati, Via Enrico Fermi 40, 00044 Frascati, Italy
Received: 5 Mai 2006 – Revised: 19 June 2007 – Accepted: 31 July 2007 – Published: 2 October 2007
Abstract. The flux of energetic light ions at low altitude is both an important input and output for self-consistent cal-culations of albedo particles resulting from the interaction of trapped and cosmic ray particles, with the upper atmo-sphere. In addition, data on the flux of light ions are needed to evaluate radiation damages on space-borne instruments and on space mission crews. In spite of that, sources of data on the flux of energetic ions at LEO are roughly lim-ited to the AP-8 model, CREME/CREME96 codes and the SAMPEX, NOAA/TIROS satellites. The existing and oper-ational European SAC-C/ICARE and PROBA-1/SREM in-struments could also be potential sources for proton data at LEO. Although AP-8 and SAMPEX/PSB97 may be pub-licly accessed through the SPENVIS, they exhibit an order of magnitude difference in low altitude proton fluxes and they do not contain helium fluxes. Therefore, improved light ion radiation models are still needed.
In this paper we present a procedure to identify and mea-sure the energy of ions that are not stopped in the NINA-2 instrument. Moreover, problems related to particles that cross the instrument in the opposite direction are addressed and shown to be a possible cause of particle misidentifica-tion. Measuring fluxes of low abundance elements like en-ergetic helium ions requires a good characterisation of all possible sources of backgrounds in the detector. Hints to de-termine the several contributions to the background are pre-sented herein and may be applied to extract an order of mag-nitude of energetic ions fluxes from existing data sets, while waiting for dedicated high performance instruments. Keywords. Interplanetary physics (Cosmic rays; Energetic particles; Instruments and techniques)
Correspondence to:A. Leonov ([email protected])
1 Introduction
The second flight model of the New Instrument for Nuclear Analysis (NINA-2) was launched on board the Italian satel-lite MITA (Minisatelsatel-lite Italiano a Tecnologia Avanzata) on 15 July 2000. The MITA satellite is the first platform built by the Italian Space Agency (ASI) for a low cost, near-Earth satellite of 170 Kg in total mass and 30 Kg in payload mass. Its mass memory is 64 Mbytes and the payload power budget is 40 W.
The main objective of the first MITA mission was the in-flight validation of the platform itself, whereas the scientific payload NINA-2 was set up to survey charged particles in-cluding galactic and solar cosmic rays along a circular po-lar orbit with 87.3 degrees inclination at 450 km altitude. A sample of a NINA-2 data set was provided to the Center for Space Radiations (CSR) to help in a preliminary study aimed at solving the following questions.
LEO. These recent flux measurements need to be validated using new proton and alpha-particle flux data acquired by high performance instruments like NINA-2. A confirmation would invalidate the atmospheric models, the nuclear cross-section tables or the particle tracking codes.
The second problem is related to disagreements found be-tween AP8-based predictions of Single Event Upset (SEU) rates from CREME/CREME96 (Tylka et al., 1997; Adams et al., 1981) and in-flight SEU rate measurements. Pro-ton induced nuclear reactions are considered to be the main source of Single Event Upsets observed in electronic com-ponents in the space environment. Accurate predictions of SEU rates are possible for mission planning, provided that the flux of the protons along the orbit is known and that the transport of protons through the component shielding is properly performed. In addition, the component SEU cross section for energetic protons must be well known and this is usually accurately achieved by laboratory measurements on a set of components. While Petersen et al. (1997) have observed a factor two difference between predicted and ob-served SEU rates, the order of magnitude of the discrepancies that would result from large flux underestimates by AP8 is not frequently reported in the literature. Only accurate mea-surements of charged particle fluxes at MITA altitude would provide valuable input data to validate either the AP8 inac-curacies or the code used to track energetic protons and its secondary ions through the shielding. Moreover, measure-ments and modelling of the flux of energetic alpha-particles would help to assess their direct or indirect contribution to SEU production in sensitive electronic devices at LEO (Dodd and Massengill, 2003). This kind of measurement would be complemented by data acquired on board the International Space Station (ISS).
The third problem is that the AP8 needs to be replaced by new probabilistic models based on comprehensive sets of en-ergetic particle measurements continuously collected in all regions of the magnetosphere and at all phases of the solar cycle. Therefore, the long-term aim of this study is to con-tribute the data needed to accurately model energetic charged particles (electrons, protons and alpha-particles) at low alti-tude. This paper contains the first results on energetic ion fluxes deduced from the NINA-2 data during the maximum phase of solar activity.
For the nuclei stopped in the sensor material, referred to hereafter as the contained particles, the particle and energy classification were performed according to dE/dx-Etot
meth-ods (Bidoli et al., 2001, and Bidoli et al., 2003). In this pa-per we also present the adapted dE/dx method to identify the species of nuclei that completely pass through the sensor, re-ferred to as long-range particles, and to obtain their energy spectra.
The article starts with a brief description of the NINA-2 telescope presented in Sect. 2. The adapted dE/dx method, used to identify the long-range particles, is described in Sect. 3. Experimental results for long-range helium and
hy-drogen nuclei of galactic origin, as well as upper limits for the flux of long-range helium of trapped origin are presented in Sect. 4. Section 5 contains the conclusions.
2 NINA-2 instrument
The MITA satellite is three-axes stabilized, and NINA-2 measurements were carried out in two different modes: zenith orientation (axis of the instrument towards the zenith) and Sun orientation (axis of the instrument pointing to the Sun) (Casolino et al., 1999, 2001). The last data from MITA were obtained in August, 2001.
NINA-2 is the sole scientific payload of the MITA mis-sion: it is a follow-up of the first NINA telescope, launched in 1998 on board the Russian RESURS-01 N◦4 satellite. The design of NINA-2 is identical to this first detector. However, the use of the extensive computer and telemetry capabilities of MITA allowed an improved data acquisition. Due to dif-ferent operational modes NINA-2 could detect charged cos-mic ray particles in the energy range from 10 to 200 MeV/n for contained particles and up to approximately 1 GeV/n for long-range ones.
The NINA-2 detector is composed of 16 X-Y planes, with each plane consisting of two n-type silicon detectors, 60×60 mm2, divided into 16 strips and connected to a
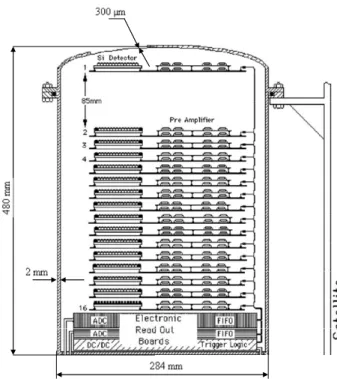
sup-porting ceramic frame under lateral strips (1 and 16). The adjacent detectors in each plane are mounted back-to-back with orthogonal orientations of the strips, in order to mea-sure the X and Y coordinates of the particle. The strip pitch is 3.6 mm. The geometric factor of the instrument ranges from 8.6 cm2sr for low energy particles to 1 cm2sr for par-ticles crossing the whole detector. The thickness of a plane is (2×150±15)µm for the first one, and (2×380±15)µm for the remaining 15 planes. The active part thus amounts to a total thickness of 11.7 mm of silicon. It is operated like a miniature calorimeter. The interplanar distance is 1.4 cm for planes 2–16 and 8.5 cm for plane 1–2, in order to improve the determination of the particle incident angle. The signals from the strips are sent through the preamplifiers to a 12-bit ADC. The ADC dynamic range corresponds to about 300 MeV of released energy; the resolution is 73 KeV/channel. The whole structure is surrounded by a cylindrical aluminum ves-sel of 284 mm in diameter and 480 mm in height and 2 mm in thick, except for a window above the first plane, where it is reduced to 300µm (Fig. 1).
The main operating trigger of the data acquisition system requires a particle to reach at least the top side (X) of the second detector plane. The veto is performed by setting in anticoincidence strips 1 and 16 of the planes from 2 up to 15 (lateral anticoincidence) and all the strips of plane 16 (bottom coincidence).
possible shifts in the detector pedestals or gain variations of the amplification chain. Depending on the trigger configura-tion, the detector can vary its characteristics in order to focus the acquisition of different particles and energy ranges. The configuration of the trigger could be modified by telecom-mands sent from the ground. It can also be automatically adjusted to cope with increased particle flux.
The instrument had two different modes of particle de-tection: low-threshold (LT) and high-threshold (HT) mode. Figure 2 presents the energy losses of hydrogen and helium nuclei in the first instrument plane expressed in ADC chan-nels as a function of the initial kinetic energy. The scale co-efficient is 0.22: (1E)planeADC=0.22× dE
dx
[MeV/cm]. The lower horizontal solid line corresponds to a low threshold (LT mode) and the upper line to a high threshold (HT mode). The vertical line shows the NINA-2 observation limit. In the low-threshold mode the telescope could detect hydrogen nuclei in the energy range from 10 to 50 MeV/nucleon for contained particles and from 50 to approximately 80 MeV/nucleon for long-range particles. Helium nuclei, detected in the LT mode, have energies from 10 to 50 MeV/nucleon for con-tained particles and from 50 to 800 MeV/nucleon for long-range particles. Heavier nuclei with charge valueZ up to 26 were registered in LT mode with energies from 10 to 200 MeV/nucleon and from 200 MeV/nucleon up to several GeV/nucleon for contained and long-range particles, respec-tively. In the high-threshold mode it was possible to detect hydrogen isotopes only in a narrow energy range 11–16 MeV, and helium long-range nuclei from 50 to 75 MeV/nucleon. More than 50% of the measurements acquired by NINA-2 within the MITA mission lifetime were carried out in the low-threshold mode.
3 Data analysis
The segmented nature of the detector allows for a very pre-cise measurement of the Bragg curve of the incoming par-ticle. In this way it is possible not only to perform particle and energy classification using the dE/dx-E methods for par-ticles stopped in the calorimeter, but it is also possible also to identify long-range particles in the operational mode with the bottom anticoincidence system switched off.
The experimental measurements for contained particles of solar, galactic and trapped origin were presented in Bakaldin et al. (2002b), Bidoli et al. (2001) and Bakaldin et al. (2002a), respectively. In this section we present the adapted dE/dx-E methods to recognize long-range particle species and to determine their energy spectrum.
The off-line track selection algorithm implemented for NINA-2 long-range flight data, applies the following rejec-tion criteria:
1. The events with either holes in the particle track or an absence of the hit in any of the last four bottom planes
Fig.1. A sketch of the NINA instrument assembly.
Fig. 1.A sketch of the NINA instrument assembly.
101 102 103 104
1 10 100
NINA-2 observation limit LT
HT
ADC channales
MeV/n
protons He
Fig.2. The energy losses of protons (dashed) and helium (dotted) nuclei in the firs
Fig. 2. The energy losses of protons (dashed) and helium (dotted) nuclei in the first plane of silicon in the corresponding channels of ADC, as a function of kinetic energy. The upper horizontal solid line corresponds to the threshold in the HT mode and the lower line to the threshold in LT mode. The vertical line shows the NINA-2 observation limit.
were rejected, in order to distinguish between long-range and contained particles, and to reduce the num-ber of particles that leave the detector through the space between planes.
10 20 40 60 80100 10-3
10-2 10-1 100 101
10 100 1000
a)
(cm
2 sr)
MeV
contained protons long-range protons
b)
MeV/n
contained helium long-range helium
Fig. 3. The product of the geometrical factor and the efficiency of the particle identification method as a function of the initial energy for long-range and contained protons(a)and helium (b)in low-threshold mode.
Ecluster(i)=sum of the energies released in the strip with
the maximum energy deposit in the two nearest strips. Enoise(i)=sum of the energies released in the other strips
of the silicon layer. If Enoise(i)>K×Ecluster(i), for any
of the crossed layer i, the event was rejected. The best efficiency optimization was achieved for K=0.01 (Bidoli et al., 2001).
As it can be seen from the experimental events that survived the track selection algorithm, the long-range tracks accom-panied by nuclear interactions are practically absent. The chargeZ and initial energyEinit of the particle were
deter-mined by minimizing the following function:
F (Z, Einit)= 32
X
i=1
h Wi
1Eireal−1Eitheori2, (1)
where 1Eireal is the energy released by the particle in the ith layer, 1Etheori is the corresponding expected value computed for each time (1Etheori =f Z, Einit, Eirest
,
Eirest=Einit− i−1
P
j=1
1Ejreal),Wi is the weight for every differ-enceWi=1/1Eireal, and the sum is extended to the 32 silicon layers activated by the long-range particle. In order to build such a function, it is necessary to follow step-by-step the par-ticle’s path, calculating the scattering angles at every layer. This method also takes into account the energy losses in dead layers, thus preventing systematic shifts in the reconstructed energy. For each event the valueF was calculated as a func-tion ofEinitfor givenZ (forZ=1÷26)and for each known
isotope. Then the minimum value ofF was chosen and the corresponding values of the chargeZand initial energyEinit
were ascribed to the particle considered. The incident energy
of the particle was obtained by adding the energy losses in the aluminum cover toEinit.
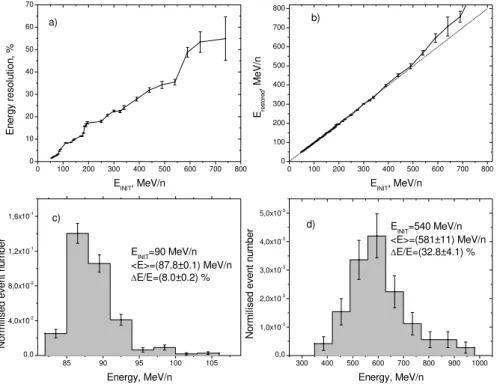
The detection efficiency of the instrument was calculated by means of Monte Carlo simulations based on the CERN-GEANT 3 code (Brun et al., 1994). The mass model of the instrument used for simulations included an aluminum cover and 32 silicon planes. The isotropic flux was simulated on the upper aluminum cover and the described track selection and charge-energy identification algorithm were applied to obtain the particle classification. The influence of the parti-cle entry from the rear of the instrument is rejected by the criteria discussed later on. Figure 3 shows the product of the geometrical factor and the selection method’s efficiency, as a function of incident particle energy for contained and long-range protons (a) and helium (b) in low-threshold mode. The high energy tails are due to the Landau probability distribu-tion of energy losses in the thin silicon planes. The energy resolution of the described method for long-range helium (a), the dependence of reconstructed energy from the initial en-ergy of incident helium (b) and some examples of enen-ergy dis-tribution for different initial energies obtained using GEANT simulations (c, d) are shown in Fig. 4. Figure 5 represents the dependence of reconstructed energy from initial energy of incident proton (a) and energy distribution for 70 MeV of proton initial energy. Figure 6 shows the efficiency of the identification method for protons (a) and helium (b) and the contamination induced by misidentified proton in helium channel (a) and induced by helium in hydrogen and lithium channels (b). This efficiency was taken into account while plotting Fig. 3. In the NINA-2 experimental data the fraction of the events identified as lithium is less than 20%, compared to helium: as a consequence these lithium events could be due to misidentified helium particles. This becomes partic-ularly important in the energy range 80÷200 MeV/n for
he-lium (Fig. 6b). Because of the small amount of lithium ions in cosmic rays the main problem is to distinguish hydrogen and helium nuclei. As expected, the ability of our method to assign charge and energy to a long-range particle becomes poor when the energy increases, because the difference in en-ergy release for different types of high enen-ergy particles does not vary significantly among the detector planes.
0 100 200 300 400 500 600 700 800 0 10 20 30 40 50 60 70
0 100 200 300 400 500 600 700 800
0 100 200 300 400 500 600 700 800
85 90 95 100 105
0,0 4,0x10⁻²
8,0x10⁻²
1,2x10⁻¹
1,6x10⁻¹
300 400 500 600 700 800 900 1000 0,0 1,0x10⁻³ 2,0x10⁻³ 3,0x10⁻³ 4,0x10⁻³ 5,0x10⁻³ a) E n er gy r e sol u ti on , %
EINIT, MeV/n
b) Eres tor ed , M e V /n
EINIT, MeV/n
c) N o rm ilis e d e v e n t n u m b e r Energy, MeV/n E
INIT=90 MeV/n
<E>=(87.8±0.1) MeV/n
ΔE/E=(8.0±0.2) %
d) Nor m ili s ed even t n u m ber Energy, MeV/n
EINIT=540 MeV/n
<E>=(581±11) MeV/n
ΔE/E=(32.8±4.1) %
Fig.4. The energy resolution for long-range helium (a); the dependence of the
Fig. 4.The energy resolution for long-range helium(a); the dependence of the reconstructed energy from initial energy of incident helium
(b), for clarity the line with slope 450 is also shown; the reconstructed energy distributions for helium nuclei with initial energies 90 MeV/n
(c)and 540 MeV/n(d)obtained using GEANT simulations.
50 60 70 80 90 100
50 60 70 80 90 100
66 68 70 72 74
0,00 0,05 0,10 0,15 0,20 0,25 0,30 0,35 a) Eres tor ed , MeV
EINIT, MeV
b) No rma lise d even t n u mb er Energy, MeV
EINIT=70 MeV
<E>=(69,9±0,1) MeV ∆E/E=(4,5±0,5)%
Fig.5. The dependence of the reconstructed energy from initial energy of incide
Fig. 5.The dependence of the reconstructed energy from the initial energy of incident protons(a), for clarity the line with slope 45◦is also shown; the reconstructed energy distribution for protons with initial energy 70 MeV(b)obtained using GEANT simulations.
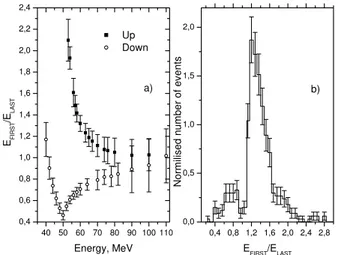
half (planes 1–8) and last half (planes 9–16) of the detector for down- and (long-range) up-going protons obtained using GEANT 3 simulation. It is visible that up- and down-going hydrogen nuclei are distinguished at least up to 80 MeV. For higher energies the detection efficiency of hydrogen is very low, since the average energy release in a silicon layer is
50 60 70 80 90 100
0,0 0,1 0,2 0,3 0,4 0,5 0,6 0,7 0,8 0,9 1,0
60 80 100 200 400 600 8001000
a)
Energy of protons, MeV protons He b) Efficie n cy
Energy of He nuclear, MeV/n He Li H
)
Fig. 6.The efficiency of the identification method for protons (solid squares) and the contamination induced by misidentified proton in helium (open squares) channel(a). The efficiency of the identifi-cation method for helium (solid triangles) and the contamination induced by misidentified helium in hydrogen (open circles) and lithium (open squares) channels(b).
40 50 60 70 80 90 100 110 0,4
0,6 0,8 1,0 1,2 1,4 1,6 1,8 2,0 2,2 2,4
0,4 0,8 1,2 1,6 2,0 2,4 2,8 0,0
0,5 1,0 1,5 2,0
a)
EFI
RS
T
/ELAST
Energy, MeV Up Down
b)
No
rm
ilised
nu
m
be
r of
ev
e
nts
EFIRST/ELAST
Fig.7. (a) The ratio of energy deposits in the first part E (planes 1-8)
Fig. 7. (a)The ratio of energy deposits in the first part EFIRST (planes 1–8) and the last part ELAST (planes 9–16) of the de-tector for down- and long-range up-going protons obtained using GEANT simulation. (b)The experimental distribution of the ratio
EFIRST/ELASTfor hydrogen nuclei.
-150 -100 -50 0 50 100 150 -80
-60 -40 -20 0 20 40 60 80
-150 -100 -50 0 50 100 150 a)
la
ti
tu
d
e
lo ngitude
contained events
b)
long-range events
Fig.8. The geographical distributions for contained (a) and long-range (b) detected
Fig. 8. The geographical distributions for contained(a)and long-range(b)detected particles.
4 Experimental results
We used the data from 4 February 2001 till 12 March 2001 in zenith orientation of the spectrometer for the quiet solar pe-riod to determine the differential spectra of long-range parti-cles. The total amount of the events recorded by the NINA-2 instrument during this period of time is 1027 for long-range particles and 8651 for contained particles. The total expo-sure time lasts 489 820 s (∼6 days). This exposure time over
a period of 5 weeks is relatively limited, so the short-term variability of the environment may have effects on the flux results from galactic origin, while in the inner radiation belt the fluxes of high-energy protons and helium are more stable for such a time scale (Selesnick and Mewaldt, 1996).
At first a rough estimate of the contribution of helium nu-clei in a selected channel was assumed. Only events with a total energy deposit between 50 and 200 MeV were selected. These energy deposit values correspond to initial energies of helium nuclei equal to 600 and 200 MeV, respectively. The number of selected events on the basis of this criterion is 152. This value can be considered as an upper limit of the num-ber of helium nuclei with an initial energy in the range from 200 to 600 MeV, because Monte-Carlo simulations show that the energy lost by protons is always less than 50 MeV, and only heavier ions may contribute in this channel. Applying the more complex method (1) to all events, the number of nuclei identified as helium was 28 for energy deposits from 50 to 200 MeV and with an initial energy between 200 and 600 MeV. The fit method (Eq. 1) result thus falls within the limits determined by the rough upper limit estimate given above.
4.1 Measurements of hydrogen and helium nuclei from galactic origin
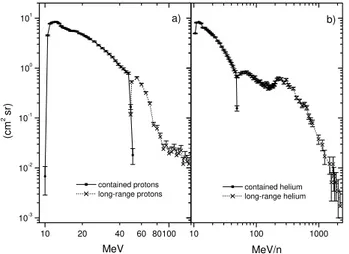
Figure 8 presents the geographical distributions for contained (a) and long-range (b) particles. The different origins of the collected events are visible. To sort the particles of galac-tic origin from the experimental data bank only high-energy events registered at L>6 were selected, because for such L values the influence of the geomagnetic field on the galac-tic pargalac-ticle fluxes in NINA-2 energy range along the MITA satellite orbit is negligible. The method described in Sect. 3 was used to determine the particle charge and energy. The efficiency functions shown in Fig. 3 were applied to convert count rates of species into fluxes. The energy spectra of cos-mic hydrogen and helium isotopes, detected by the NINA-2 instrument, are shown in Figs. 9a and b, respectively. The flux of cosmic ray helium obtained during the same period in ACE experiment (http://www.srl.caltech.edu/ACE) is also shown in Fig. 9b. A good agreement between the data of NINA-2 and ACE experiments is found.
4.2 Measurements of geomagnetically trapped hydrogen and helium nuclei
As can be noticed from Fig. 8a the NINA-2 instrument could detect particles of trapped origin, as reported by Bakaldin et al. (2002a) in the South Atlantic Anomaly (SAA). But for long-range events in the SAA (Fig. 8b) the up-going sec-ondary particles form the dominant background produced by interactions of trapped particles with the payload at the near side of NINA-2 instrument. Using NINA-2 long-range data obtained in the SAA for zenith orientation it was not possible to extract any significant amount of trapped helium nuclei.
10 20 40 60 80 10-3
10-2
10-1
100
10 100
a)
In
ten
s
it
y,
(
m
2 s s
r M
e
v/n )
-1
MeV contained protons upper limit long-range hydrogen
b)
MeV/n NINA-2, contained helium NINA-2, long-range helium ACE
Fig.9. The energetic spectra of galactic (L > 6) hydrogen(a) and helium isotopes (b),
Fig. 9.The energetic spectra of galactic (L>6) hydrogen(a)and he-lium isotopes(b), detected by NINA-2 instrument from 4 February 2001 till 12 March 2001 in the zenith orientation of the spectrometer and during the solar quiet period. Galactic helium obtained during the same period in ACE experiment (b).
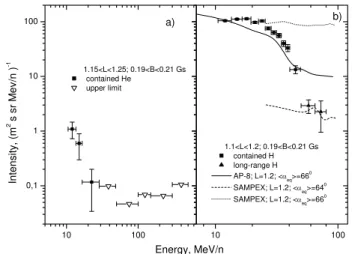
are shown in Fig. 10 (a) in the [1.15–1.25] L interval. The flux level and the spectral shape are in agreement with the secondary nature of trapped high-energy helium at the inner edge of the radiation belt (Selesnick and Mewaldt, 1996 and Galper et al., 2003). The lack of long-range trapped helium in the NINA-2 experiment is indirectly confirmed by the ab-sence of incorrectly identified lithium ions, which are also shown in Fig. 6b. The energy spectrum for contained and long-range trapped hydrogen in the L range [1.1–1.2] is pre-sented in Fig. 10b. The AP8 max prediction is also shown for L=1.2 and an equator pitch angle 66◦
(http://spenvis.oma.be), which corresponds to the values measured in the NINA-2 ex-periment in the inner radiation belt. The discrepancy for the highest energy ranges can be explained of the fact that NINA-2 measurements, shown in the Fig. 10b, were fulfilled for L values less than 1.2, where the flux value is decreased more sharply with trapped particles’ energy increasing. Besides, the value of the trapped proton flux at L∼1.2 (Leonov et al.,
2005) is varied with equator pitch-angle more than an or-der of magnitude near the loss cone. It could be seen from the SAMPEX PSB97 (Heynderickx et al., 1999) model data fluxes at L=1.2 for the equator pitch angle values 64◦ and 66◦, which are also shown in Fig. 10b.
5 Conclusions
The adapted dE/dx-E methods, used to reconstruct the long-range events, were presented to separate proton and helium nuclei and to determine their initial energy in the ranges 50÷80 MeV and 50÷700 MeV/n, respectively. Further
de-velopment of this algorithm, in view of better identification between proton and helium species, can be used to analyze
10 100
0,1 1 10 100
10 100
a)
In
te
n
s
it
y
, (
m
2 s s
r M
e
v
/n
)
-1
Energy, MeV/n
1.15<L<1.25; 0.19<B<0.21 Gs contained He
upper limit
b)
1.1<L<1.2; 0.19<B<0.21 Gs contained H long-range H AP-8; L=1.2; <αeq>=66
0
SAMPEX; L=1.2; <αeq>=64 0
SAMPEX; L=1.2; <αeq>=66 0
Fig.10. (a) The energy spectra for contained helium in the SAA and upper limits for
Fig. 10. (a)The energy spectra for contained helium in the SAA and upper limits for long-range trapped helium. (b)The energy spec-trum for contained and long-range trapped hydrogen. The AP8 max prediction is also shown (solid line) for L=1.2 and equator pitch angle 66◦. The proton flux data at L=1.2 and equator pitch angle values 64◦and 66◦from SAMPEX PSB97 model are presented by dashed and dotted lines, respectively.
the long-range data from similar detectors, such as the PET on SAMPEX and to process the NINA-2 data obtained dur-ing SEP and to study their variation in space and time.
The results presented in this work show that if the flux of trapped helium with energies above several tens MeV/n in the inner radiation belt exists, then its value is below the sensitivity of the instrument. The upper limit for the inten-sity of trapped helium nuclei in an L-shell range is smaller than 1.3, and for energies above 40 MeV/n, is∼0.1 (m2s sr
MeV/n)−1. This result is in agreement with the secondary nature of trapped high energy helium ions at the inner edge of the radiation belt. The comparison between the hydro-gen fluxes detected by the NINA-2 instrument and from AP8 shows good agreement (within factor of two) for energies less than 50 MeV and larger a discrepancy for the higher en-ergy. The presented proton data also do not contradict with SAMPEX PSB97 model.
Acknowledgements. We acknowledge the International Association
formed by the European Community, European Union’s Member states (INTAS), for its support of A. Leonov’s work through the Young Scientist Fellowship grant 03-55-1126. Also we wish to thank J. Lemaire (IASB) for editing the manuscript.
Topical Editor I. A. Daglis thanks P. Nieminen and another anonymous referee for their help in evaluating this paper.
References
Bakaldin, A., Galper, A., Koldashov, S., et al.: Geomagnetically trapped light isotopes observed with the detector NINA, J. Geo-phys. Res., 107, A8, 81, 2002a.
Bakaldin, A., Galper, A., Koldashov, S., et al.: Light isotope abun-dances in solar energetic particles measured by the space instru-ment NINA, The Astrophysical J., 577, 513–523, 2002b. Bourdarie, S., Boscher, D., Nieminen, P., et al.: Radiation
Environment Research from Multiple Monitors (RERMM) – ESA/ESTEC Contract No.16709/02/NL/EC – FINAL REPORT – Issue 1.0 – February 2006.
Bidoli, V., Canestro, A., Casolino, M., et al.: In-orbit performances of the space telescope NINA and GCR flux measurements, As-trophys. J. Suppl. Ser., 132, 365–375, 2001.
Bidoli, V., Casolino, M., De Pascale, M., et al.: Isotope compo-sition of secondary hydrogen and helium above the atmosphere measured by the NINA and NINA-2, J. Geophys. Res., 108(A5), 1211, doi:10.1029/2002JA009684, 2003.
Brun, R., Carminati, F., Giani, S., et al.: GEANT detector descrip-tion and simuladescrip-tion tool, W5014, Comput. And Networks Div., CERN, Geneva, Switzerland, 1994.
Cabrera, J., Cyamukungu, M., Stauning, P., et al.: Fluxes of ener-getic protons and electrons measured on board the Oersted satel-lite, Ann. Geophys., 23, 2975–2982, 2005,
http://www.ann-geophys.net/23/2975/2005/.
Casolino, M., Bidoli, V., Canestro, A., et al.: Continuation of the mission NINA: NINA-2 experiment on MITA satellite, Proceed-ing 26 ICRC (Salt Lake City), 5, 136–139, 1999.
Casolino, Bidoli, V., De Pascale, M., et al.: Launch in orbit of the NINA-2 apparatus aboard the satellite MITA, Proceeding 27 ICRC (Hamburg), 6, 2314–2317, 2001.
Dodd, P. E. and Massengill, L. W.: Basic mechanisms and modeling of Single-Event Upset in digital microelectronics, IEEE Trans. Nucl. Sci., 50(3), 583–602, 2003.
Galper, A. and Dmitrenko, V.: Experiment “Gamma-background”, J. Earth and Universe, 1(30), (in Russian), 30–38, 1980. Galper, A. M., Kodashov, S. V., Leonov, A. A., et al.: Light isotopes
generation in the earth radiation belt, Izvestiy RAN. Ser. Phys., 67(4), 524–526, (in Russian), 2003.
Heynderickx, D., Kruglanski, M., Pierrard, V., et al.: A low alti-tude trapped proton model for solar minimum conditions based on SAMPEX/PET data, IEEE Trans. Nucl. Sci., 46, 1475–1480, 1999.
Leonov, A., Cyamukungu, M., Cabrera, J., et al.: Pitch angle dis-tribution of trapped energetic protons and helium isotope nuclei measured along the Resurs-01 No. 4 LEO satellite, Ann. Geo-phys., 23, 1–5, 2005,
http://www.ann-geophys.net/23/1/2005/.
Petersen, E. L.: Predictions and observations of SEU rates in space, IEEE Trans. Nucl. Sci., 44(6), 2174–2187, 1997.
Selesnick, R. S. and Mewaldt, R. A.: Atmospheric production of radiation belt light isotopes, J. Geophys. Res., 101(9), 19 745– 19 758, 1996.
Tylka, A. J., Adams Jr., J. H., Boberg, P. R., et al.: CREME96: A Revision of the Cosmic Ray Effects on Micro-Electronics Code, IEEE Trans. Nucl. Sci. NS-44, 2150–2160, 1997.