OSD
12, 2899–2930, 2015Imprint of external climate forcing on coastal upwelling in
past and future climate
N. Tim et al.
Title Page
Abstract Introduction
Conclusions References
Tables Figures
◭ ◮
◭ ◮
Back Close
Full Screen / Esc
Printer-friendly Version
Interactive Discussion
Discussion
P
a
per
|
Discussion
P
a
per
|
Discussion
P
a
per
|
Discussion
P
a
per
|
Ocean Sci. Discuss., 12, 2899–2930, 2015 www.ocean-sci-discuss.net/12/2899/2015/ doi:10.5194/osd-12-2899-2015
© Author(s) 2015. CC Attribution 3.0 License.
This discussion paper is/has been under review for the journal Ocean Science (OS). Please refer to the corresponding final paper in OS if available.
Imprint of external climate forcing on
coastal upwelling in past and future
climate
N. Tim1, E. Zorita1, B. Hünicke1, X. Yi1, and K.-C. Emeis1,2
1
Helmholtz-Zentrum Geesthacht, Institute of Coastal Research, Max-Planck-Strasse 1, 21502 Geesthacht, Germany
2
University of Hamburg, Institute of Geology, Bundesstrasse 55, 20146 Hamburg, Germany
Received: 27 October 2015 – Accepted: 4 November 2015 – Published: 23 November 2015
Correspondence to: N. Tim ([email protected])
OSD
12, 2899–2930, 2015Imprint of external climate forcing on coastal upwelling in
past and future climate
N. Tim et al.
Title Page
Abstract Introduction
Conclusions References
Tables Figures
◭ ◮
◭ ◮
Back Close
Full Screen / Esc
Printer-friendly Version
Interactive Discussion
Discussion
P
a
per
|
Discussion
P
a
per
|
Discussion
P
a
per
|
Discussion
P
a
per
|
Abstract
The Eastern Boundary Upwelling Systems are the major coastal upwelling regions. The trade winds are driving these upwelling regimes located in the subtropics at the eastern boundary of the Atlantic and Pacific Ocean. Here we analyse the impact of the external climate forcing, e.g. the greenhouse gas concentration, solar activity and
vol-5
cano eruptions, on these upwelling systems in simulations of ensembles of two Earth System Models. The ensembles contain three simulations for each time period which cover the past millennium (900–1850), the 20th century (1850–2005) and the near fu-ture (2006–2100). Using a set of simulations, differing only in their initial conditions, enables us to detect whether the variability is driven internally or externally. Our
analy-10
sis shows that the variability of the simulated upwelling is to the most driven internally and that there are no significant trends except for the scenario with the most dramatic increase of greenhouse gas concentrations.
1 Introduction
Eastern Boundary Upwelling Systems (EBUs) are highly productive coastal ocean
ar-15
eas where nutrient rich, cold water upwells by the action of favourable winds. The link between external climate forcing, such as greenhouse gases and solar activity, and coastal upwelling has primarily been framed by the theoretical considerations put for-ward by Bakun (1990). Surface temperature over land should warm faster than over the oceans under increased radiative forcing, leading to an intensification of the subtropical
20
continental lows and the oceanic highs and a strengthening the upwelling-favourable winds (Bakun, 1990). Some observations over the 20th century (Narayan et al., 2010) and simulations of the 21st century (Wang et al., 2015) have been interpreted as indica-tive of upwelling intensification due to stronger external climate forcing. Also, coastal sediment records covering the past millennium and indicative of upwelling (McGregor
25
cli-OSD
12, 2899–2930, 2015Imprint of external climate forcing on coastal upwelling in
past and future climate
N. Tim et al.
Title Page
Abstract Introduction
Conclusions References
Tables Figures
◭ ◮
◭ ◮
Back Close
Full Screen / Esc
Printer-friendly Version
Interactive Discussion
Discussion
P
a
per
|
Discussion
P
a
per
|
Discussion
P
a
per
|
Discussion
P
a
per
|
mate forcing, mainly solar irradiance and volcanism. However, the empirical evidence for a long-term intensification of coastal upwelling over the 20th century is not clear-cut. A meta-data analysis has found a significant intensification of wind stress in only three of the four major coastal upwelling systems (California, Benguela, and Humboldt but not Canary) (Sydeman et al., 2014). Previous studies have detected increasing
up-5
welling intensity over the past century (Di Lorenzo et al., 2005; Gutíerrez et al., 2011; Santos et al., 2012), but others have not (Rykaczewski et al., 2010; Pardo et al., 2011). A possible cause may lie on insufficient data homogeneity in long-term wind station records and in meteorological reanalysis, which may blur the identification of long-term trends (Sydeman et al., 2014). Also, other long-term records of upwelling intensity are
10
indirect, and sometimes even based on wind records themselves (Bakun et al., 2010). The direct evidence for upwelling intensification is, therefore, still not conclusive. For instance, the Benguela upwelling system does not exhibit a long-term intensification in the recent decades (Bakun et al., 2010). This has been explained by the counteracting influence of El Niño-Southern Oscillation (ENSO) on humidity in the Peru and Benguela
15
EBUs regions, which would also influence the regional radiative forcing and modulate the land-ocean thermal contrast (Bakun et al., 2010). According to this explanation, the upwelling trend due to stronger external radiative forcing would be biased by a changing frequency of ENSO events in the recent past.
The effect of increasing greenhouse gas concentrations on upwelling regimes in
fu-20
ture scenarios has been investigated by Wang et al. (2015). They analysed the simu-lated trend of upwelling in several simulations included in the Climate Model Intercom-parison Project (CMIP5) (Taylor et al., 2012) driven by the Representative Concentra-tion Pathways (rcp) 8.5 scenario, a scenario with an increase of the globally averaged external radiative forcing of 8.5 Wm−2by the year 2100. They found that in most of the
25
EBUs models tend to simulate an intensified upwelling and longer upwelling seasons under climate change.
OSD
12, 2899–2930, 2015Imprint of external climate forcing on coastal upwelling in
past and future climate
N. Tim et al.
Title Page
Abstract Introduction
Conclusions References
Tables Figures
◭ ◮
◭ ◮
Back Close
Full Screen / Esc
Printer-friendly Version
Interactive Discussion
Discussion
P
a
per
|
Discussion
P
a
per
|
Discussion
P
a
per
|
Discussion
P
a
per
|
cores, but rather indirectly indicated on the basis of the water temperatures, assuming that cooler temperatures are indicative of stronger upwelling. This assumption could lead to a missinterpretation because temperature changes could have other origins than upwelling, for instance due to variations in the external forcing.
The verification of Bakun’s hypothesis in the recent past is critical to establish its
5
validity for the future. Even if Bakun’s hypothesis is correct, it is not clear whether past variations in external forcing have been strong enough to drive upwelling intensity beyond the range of variations caused by internal chaotic climate variability. Hence, an apparent agreement between the predicted and observed trend could just occur by chance. The analysis of the recently available ensemble of climate simulations with
10
CMIP5 models over the recent past can shed light on this question. If the upwelling is mainly externally driven, all simulations should show approximately the same time evolution of upwelling.
A recent paper by Small et al. (2015) investigated the relevance of model resolu-tion for the quesresolu-tion of the warm bias that global climate models usually display in the
15
Eastern ocean basins (Richter, 2015). This bias may be related to the simulated up-welling intensity. Their analysis indicate that a high atmospheric horizontal resolution is of larger importance than the horizontal resolution of the ocean model. The most realistic wind stress curl and upwelling was simulated with a high resolution nested regional atmospheric model coupled with an eddy-resolving ocean model, resulting in
20
more intense values of wind stress and shifted towards the coast. Restoring the SST of Benguela further reduce the typical warm bias in these upwelling regions because the model improvement also impact the shortwave radiation.
2 Data and methods
We analyse here ensembles comprising three simulations of two different Earth System
25
OSD
12, 2899–2930, 2015Imprint of external climate forcing on coastal upwelling in
past and future climate
N. Tim et al.
Title Page
Abstract Introduction
Conclusions References
Tables Figures
◭ ◮
◭ ◮
Back Close
Full Screen / Esc
Printer-friendly Version
Interactive Discussion
Discussion
P
a
per
|
Discussion
P
a
per
|
Discussion
P
a
per
|
Discussion
P
a
per
|
The simulations with the MPI-ESM, a model developed by the Max Planck Insti-tute for Meteorology in Hamburg (Giorgetta et al., 2013), cover the periods 900–1850 (past1000), 1850–2005 (historical), and 2006–2100 (future). For the future, we anal-yse here three scenarios with different strength in greenhouse gas forcing, rcp2.6, rcp4.5, and rcp8.5, where the numbers indicate the anthropogenic radiative forcing
5
in Wm−2 reached by the year 2100 (Fig. 1). The climate model MPI-ESM partici-pated in the CMIP5 project (Giorgetta et al., 2013), contributing three simulations to the historical ensemble, three simulations to the future ensemble and one simula-tion for the past1000 period. These data can be downloaded from the CMIP5 web site (http://cmip-pcmdi.llnl.gov/cmip5/). Two additional past1000 simulations were later
10
conducted with the MPI-ESM and were kindly provided by the Max Planck Institute for Meteorology.
The simulations in each ensemble were driven by almost identical external forcing (only the width of the probability distribution of the volcanic aerosol size slightly differs in the last two past1000 simulations). The forcings (Schmidt et al., 2011) prescribed
15
in the past1000 and historical simulations include the orbital forcing, variability in so-lar irradiance (Vieira et al., 2011), seasonally varying natural tropospheric aerosols, stratospheric aerosols from volcano eruptions (Crowley et al., 2008), and five well-mixed greenhouse gases: CO2, CH4. N2O CFC-11, and CFC-12, as well as O3,
an-thropogenic sulphate aerosols, and changes due to anan-thropogenic land use (Pongratz
20
et al., 2009). In the scenario simulations, only changes in anthropogenic forcing were prescribed according to the Representative Concentration Pathways (rcp) scenarios.
Within each ensemble of simulations (past1000, historical, and future), the simula-tions differ in their initial state. Thus, a coherent evolution of upwelling in all simula-tions with an ensemble would suggest a quantifiable influence of the external forcing,
25
whereas a lack of correlation among the simulations would clearly indicate a prepon-derance of internal dynamics.
OSD
12, 2899–2930, 2015Imprint of external climate forcing on coastal upwelling in
past and future climate
N. Tim et al.
Title Page
Abstract Introduction
Conclusions References
Tables Figures
◭ ◮
◭ ◮
Back Close
Full Screen / Esc
Printer-friendly Version
Interactive Discussion
Discussion
P
a
per
|
Discussion
P
a
per
|
Discussion
P
a
per
|
Discussion
P
a
per
|
the CMIP5 project was closed. The CESM-CAM5 ensemble comprises a large amount of simulations with different configurations of the external forcing and different initial conditions. Here, we analyse simulations driven by all external forgings, natural and an-thropogenic (denoted as “all-forcings” in the CESM-CAM5 Last Millennium ensemble project Otto-Bliesner et al., 2015 (https://www2.cesm.ucar.edu/models/experiments/
5
LME). The CESM-CAM5 covers the period 850 to 2005 with a horizontal resolution of the ocean of 1◦ (Otto-Bliesner et al., 2015). These simulations were driven by the same set of external forcings as used in the MPI-ESM simulations. Unfortunately, no future simulations with this model are publicly available (Kay et al., 2015).
The horizontal resolution of the atmospheric model of the MPI-ESM is about 1.9◦
10
(spatially varying) with 95 levels for the historical period and 47 levels for the past1000 and future period, whereas the ocean model resolution is approximately 1◦ (past1000 and future) and 0.4◦(historical), including 40 ocean layers. These resolutions are simi-lar to the resolution of the CMIP5 models used by Wang et al. (2015). Although ocean processes of spatial scales of a few kilometres are only imperfectly resolved, this
res-15
olution should be fine enough to realistically represent the basic relationship between upwelling dynamics and the large-scale wind forcing, including the shoreline-parallel winds and the wind stress curl.
Upwelling intensity in each of the four upwelling regions is defined by the vertical mass transport (wmo) at the ocean model layer at 52 m (MPI-ESM) and the
verti-20
cal velocity (wvel) at 50 m (CESM-CAM5) (close to the modelled mixed layer depth), and averaged over each of the upwelling regions: Benguela (8–30◦E, 15–28◦S), Peru (80–70◦W, 20–10◦S), California (130–110◦W, 20–50◦N), and Morocco (20–10◦W, 20– 34◦N). Upwelling indices are here defined as the seasonal means over the main up-welling season in each region. In the MPI-ESM past1000 and historical simulations,
25
OSD
12, 2899–2930, 2015Imprint of external climate forcing on coastal upwelling in
past and future climate
N. Tim et al.
Title Page
Abstract Introduction
Conclusions References
Tables Figures
◭ ◮
◭ ◮
Back Close
Full Screen / Esc
Printer-friendly Version
Interactive Discussion
Discussion
P
a
per
|
Discussion
P
a
per
|
Discussion
P
a
per
|
Discussion
P
a
per
|
season is September–November in Benguela and Peru and June–August in California and Morocco.
If it is not explicitly stated, all correlations have been calculated with long-term de-trended series.
Here, we show results from three of the available simulations from the CESM-CAM5
5
ensemble, as three simulations already confirm the results obtained with the MPI-ESM model. These two models used here are the only ones that provided an ensemble of simulations with basically the same forcing and with different the initial conditions, thus being suitable to detect the possible imprint of external forcing.
After assessing the realism of the connection between atmospheric drivers and
sim-10
ulated upwelling, we further evaluate whether the upwelling intensity in these regions displays any imprint of the external climate forcing. To estimate the ratio of forced vari-ability to total varivari-ability we build a simple model of the variations of a climate record that decomposes its variability into a sum of a forced component, proportional to the ex-ternal climate forcing, and an inex-ternal component caused by the non-linear interactions
15
within the climate system:
y=yf(t)+yi(t) (1)
The same model can be applied to describe climate records simulated in two climate simulations driven by the same forcing and started with different and random initial conditions:
20
y1(t)=yf(t)+y1i(t) (2)
y2(t)=yf(t)+y2i(t) (3)
where the forced components are by construction equal in both simulations and the internal components are uncorrelated in time. The ratio between the variance of yf
and the variance ofy1, equal to the variance ofy2, can be shown to be equal to the 25
correlation betweeny1andy2
OSD
12, 2899–2930, 2015Imprint of external climate forcing on coastal upwelling in
past and future climate
N. Tim et al.
Title Page
Abstract Introduction
Conclusions References
Tables Figures
◭ ◮
◭ ◮
Back Close
Full Screen / Esc
Printer-friendly Version
Interactive Discussion
Discussion
P
a
per
|
Discussion
P
a
per
|
Discussion
P
a
per
|
Discussion
P
a
per
|
wherehx,yi=Ptx(t)y(t)
3 Representations of upwelling and its drivers in the model
The patterns of long-term mean sea surface temperature (SST) (June–August, main upwelling season in three of the four regions) display depressed values in the areas of upwelling relative to the zonal SST mean at the same latitude, although the fine
5
spatial structure appears smoothed due to the model resolution (Fig. 2a). The shape of the modelled seasonal cycle of upwelling generally agrees with what is known from observations (Fig. 2b and c), with upwelling being more intense in the boreal warm half-year. The mean upwelling is, however, about a factor two more intense in the lower resolution past1000 simulations, indicating that ocean model resolution is important to
10
simulate the correct mean upwelling intensity, which may be relevant for the SST bias in the EBUs simulated by many climate models (Wang et al., 2014).
The link between each upwelling index and wind stress, calculated as the patterns of correlations between the index and wind stress in each model grid-cell (not shown), is also very realistic, displaying in each case a characteristic alongshore wind stress that
15
favours Ekman transport, the main mechanism causing coastal upwelling (Tomczak and Godfrey, 2003). The correlation patterns between each upwelling index and the sea level pressure (SLP) realistically show regions with negative correlations over land and positive correlations off-shore (Fig. 3), indicating that the across-coastline SLP gradient is conductive for alongshore wind stress through the geostrophic relation.
20
4 Imprint of external forcing on coastal upwelling
4.1 Past1000 and historical simulations
OSD
12, 2899–2930, 2015Imprint of external climate forcing on coastal upwelling in
past and future climate
N. Tim et al.
Title Page
Abstract Introduction
Conclusions References
Tables Figures
◭ ◮
◭ ◮
Back Close
Full Screen / Esc
Printer-friendly Version
Interactive Discussion
Discussion
P
a
per
|
Discussion
P
a
per
|
Discussion
P
a
per
|
Discussion
P
a
per
|
greenhouse gases, and land-use changes (Hegerl et al., 2006) and at millennium time-scale the slowly varying orbital configuration of the Earth (Laskar et al., 2004). These forcings had an effect on the global mean surface temperatures, both in climate simu-lations driven by these forcings as in proxy-based climate reconstructions (Fernández-Donado et al., 2013). There was a period of relatively high temperatures, the Medieval
5
Warm Period with its maximum at around 1000–1300 A.D. These high temperatures were caused by high solar and low volcanic activity. The Medieval Warm Period was followed by the Little Ice Age, a period of low temperatures caused by low solar and high volcanic activity. After the Little Ice Age, global mean temperatures rose mainly as result of higher concentration of greenhouse gases (Fernández-Donado et al., 2013).
10
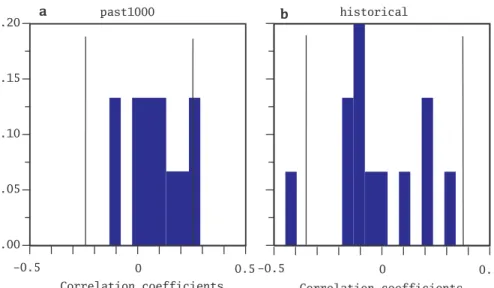
For both ensembles of simulation of the past, the decadally smoothed time series of regional upwelling extracted from each of the three simulations display different time evolutions (Fig. 4) and do not show a centennial evolution comparable to the global mean temperatures or the global mean external forcing as just described. The correla-tions between these series for each region are correspondingly low (Table 1, Fig. 5) and
15
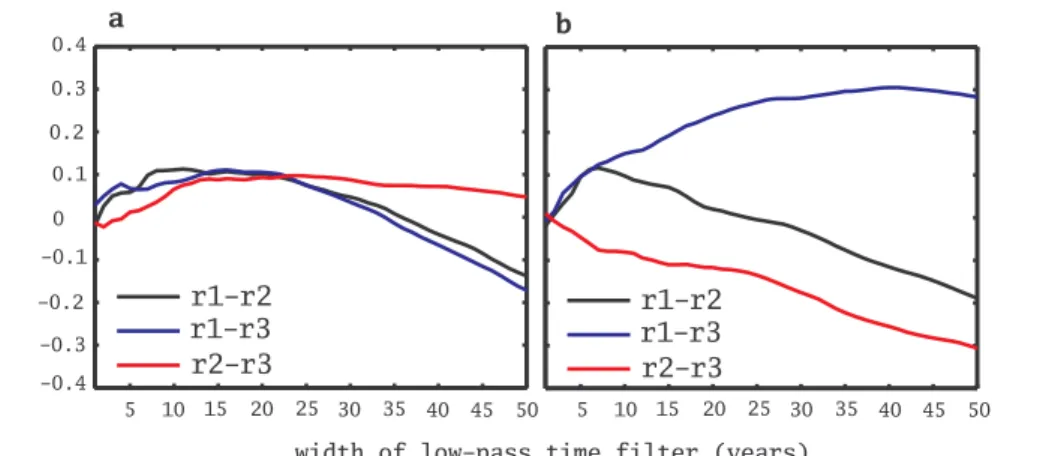
mostly statistically not significant. These correlations remain low and non-significant for stronger low-pass time filtering up to 50 years (Fig. 6a). This indicates that the up-welling variance shared by all simulations, which could only be due to the common external forcing, is also small. These simulations, therefore, do not support any signifi-cant imprint of the external forcing on upwelling in any of the EBUs up to multidecadal
20
timescales over the past millennium.
This finding supports previous studies derived from observed records, that identi-fied a strong influence of the Pacific North American pattern on California upwelling. The Pacific North America pattern is a well-known mode of internal climate variability, probably linked to the dynamics of the Tropical and mid-latitude Pacific Ocean (Macías
25
et al., 2012).
OSD
12, 2899–2930, 2015Imprint of external climate forcing on coastal upwelling in
past and future climate
N. Tim et al.
Title Page
Abstract Introduction
Conclusions References
Tables Figures
◭ ◮
◭ ◮
Back Close
Full Screen / Esc
Printer-friendly Version
Interactive Discussion
Discussion
P
a
per
|
Discussion
P
a
per
|
Discussion
P
a
per
|
Discussion
P
a
per
|
than the variations in the forcing prescribed in the past1000 simulations. For instance, the amplitude of decadal variations of the preindustrial external forcing is of the order of 0.3 Wm−2(Schmidt et al., 2011), whereas the increase in the external forcing over the past 250 years is 1.6 Wm−2(Myhre et al., 2013).
Thus, the long-term influence of the external forcing – the strongest being
anthro-5
pogenic greenhouse gases in the historical simulations – could be more easily detected in the form of common long-term upwelling trends. However, the simulated trends are small, mostly statistically not significant, and generally display opposite signs in the different simulations (Fig. 4). The two exceptions here are California and Morocco in the historical simulations, in which all members exhibit a negative trend (opposite to the
10
expected strengthening), of which only two trends of the California upwelling region are statistically significant. Analysing the imprint of external forcing on upwelling with the CESM-CAM5 confirms the results with the MPI-ESM. The simulated upwelling velocity in three simulations are weakly correlated with each other (Fig. 7) and the trends are either not coherent in the simulations or are not statistically significant.
15
4.2 Scenarios
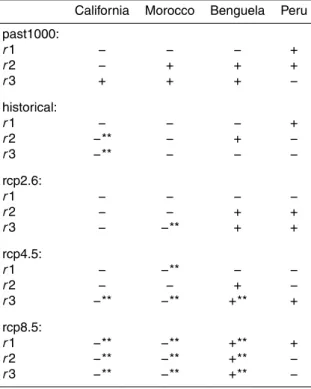
Looking at the future development of the upwelling in the EBUs, we analyse the future simulations conducted with the MPI-ESM model under three different emission scenar-ios. An effect of the external forcing should be reflected in consistent centennial trends in upwelling in all members of each ensemble. Consistent significant trends in all three
20
simulations of an ensemble only occur in the rcp8.5 scenario, the one with the strongest external forcing (Table 2, Fig. 8). The trends are negative in California and Morocco and positive only in Benguela. In Peru no significant trends can been seen. This support our results obtained for the past millennium, indicating that the external forcing has not been intense enough in the past to force the upwelling significantly. Furthermore,
25
OSD
12, 2899–2930, 2015Imprint of external climate forcing on coastal upwelling in
past and future climate
N. Tim et al.
Title Page
Abstract Introduction
Conclusions References
Tables Figures
◭ ◮
◭ ◮
Back Close
Full Screen / Esc
Printer-friendly Version
Interactive Discussion
Discussion
P
a
per
|
Discussion
P
a
per
|
Discussion
P
a
per
|
Discussion
P
a
per
|
the rcp8.5 scenario. They concluded that a clear connection between external forcing and upwelling could be find. However, when analysing the trends simulated in other scenarios, it turns out that in the weaker greenhouse gas scenarios this link is weaker, and it cannot be easily identified.
5 Imprint of external forcing on the drivers of upwelling
5
Upwelling in all four investigated regions is mainly driven by the wind stress curl that modulates upwelling in offshore regions and by the alongshore wind stress that drives the coastal upwelling. The latter is related to the SLP gradient between land and ocean (Tomczak and Godfrey, 2003; Mackas et al., 2006). We investigate whether the time evolution of this SLP gradient is consistent across the simulations and whether the
10
lack of correlations between the upwelling indices across the ensemble may be due to a weak influence of the external forcing on wind stress and on the SLP gradient. The across-coastline SLP gradients in the simulations are calculated by subtracting the averaged air pressure over land from the averaged pressure over ocean in the regions identified as most closely correlated to the upwelling indices (Fig. 3).
15
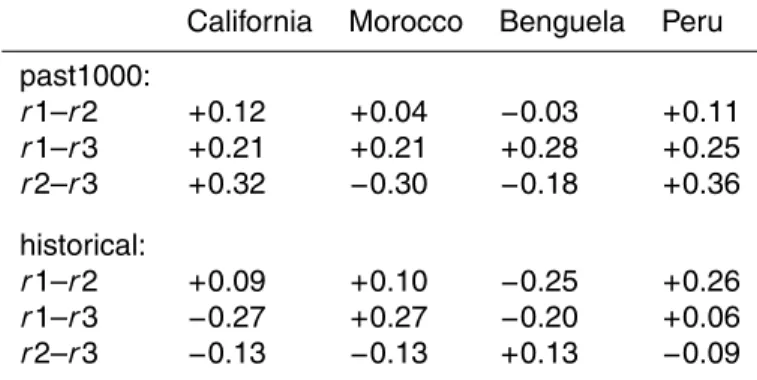
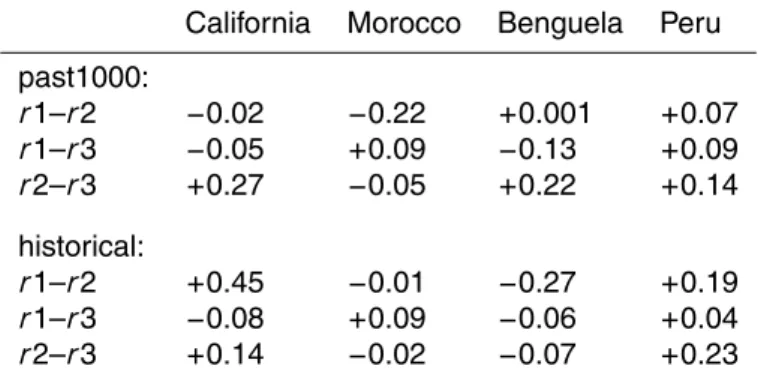
As in the case of the upwelling indices, the correlations between the time series of wind stress and SLP gradients across the simulations in the ensemble are all low (Tables 3 and 4). These correlations also remain low regardless of the time filtering (Fig. 6b). Regarding the longest time scales captured in the simulations, the long-term trends of the wind stress and of the SLP gradient within each ensemble have either
20
inconsistent signs, or are not statistically significant, or are incompatible with the ex-pected effect of the external forcing varying at centennial timescales. These expected trends are negative in past1000 due to the long-term orbital forcing and positive in his-torical due to the increase in greenhouse gas forcing. Therefore, even if the connection between the atmospheric drivers and upwelling were not totally realistic in the Earth
25
simula-OSD
12, 2899–2930, 2015Imprint of external climate forcing on coastal upwelling in
past and future climate
N. Tim et al.
Title Page
Abstract Introduction
Conclusions References
Tables Figures
◭ ◮
◭ ◮
Back Close
Full Screen / Esc
Printer-friendly Version
Interactive Discussion
Discussion
P
a
per
|
Discussion
P
a
per
|
Discussion
P
a
per
|
Discussion
P
a
per
|
tions do not support a discernible influence of the external forcing on the atmospheric drivers of upwelling over the last centuries. This implies that such an influence could not have been found even if the ocean model perfectly represented the real upwelling dynamics.
6 Imprint of external forcing on stratification
5
Another possible mechanism by which the external climate forcing could influence up-welling involves the stratification of the water column. In periods with a stronger external forcing, the temperatures at the surface should warm more rapidly than in the deeper layers, increasing the stability of the water column, and hindering the mechanical ef-fect of the alongshore wind stress (Hsueh and Kenny, 1972). The amount of variability
10
in the SST that can be attributed to the variations in the external forcing can also be estimated by the correlation between the grid-cell SST series simulated in each mem-bers of the simulation ensemble (Fig. 9). The correlation patterns indicate that the SST variability is more strongly driven by the external forcing in the tropical belt and tends to the weaker in the mid and high latitudes. This occurs despite the strongest response
15
of high latitudes to external radiative forcing, known as the Arctic amplification. The reason is that at high latitudes the internal variability is also larger than at low latitudes. The ratio between both, external forcing signal and internal variability, which is encap-sulated by the correlation patterns show in Fig. 9, is therefore highest in the tropics, a feature which has been so far overlooked but that has been found in previous
analy-20
OSD
12, 2899–2930, 2015Imprint of external climate forcing on coastal upwelling in
past and future climate
N. Tim et al.
Title Page
Abstract Introduction
Conclusions References
Tables Figures
◭ ◮
◭ ◮
Back Close
Full Screen / Esc
Printer-friendly Version
Interactive Discussion
Discussion
P
a
per
|
Discussion
P
a
per
|
Discussion
P
a
per
|
Discussion
P
a
per
|
7 Discussion and conclusions
The analysis of three simulation ensembles with the Earth System Model MPI-ESM over the past millennium and the future are in contrast with the hypothesis of a dis-cernible influence of the external forcing on coastal upwelling intensity. Uncertainties still remain. For instance, the magnitude of the external forcing variations over the past
5
millennium is still not well established (Schmidt et al., 2011), and larger variations than hitherto assumed may cause a tighter connection between forcing and upwelling. Over the past 150 years, however, the trends in external climate forcings are much more cer-tain and over this period the historical simulations do not show any consistent sign of intensification or weakening.
10
For the future, the effect of external forcing on the EBUs can be identified when greenhouse gas concentrations are assumed to follow the strongest scenario, rcp8.5, among the three Representative Concentration Paths analysed here. All three simu-lation in the ensemble display consistent trends, but these trends are not always con-sistent with the expected intensification of upwelling, with some regions showing an
15
intensification but others showing a weakening.
The definition of the upwelling index can be sensitive to the region over which the vertical velocities are averaged. Redefining the subregions of the Eastern Boundary Upwelling Systems (EBUs) (Canary (18.5–10.5◦W, 16.5–42.5◦N), South Benguela (8– 30◦E, 28–40◦S), Chile (80–70◦W, 20–40.5◦S)) does not change the main results of
20
this study. The correlation between the three simulations remains low, for upwelling as well as for wind stress. Significant trends with the same sign in all three simulations do not occur, neither in the simulations of past periods nor in the future simulations.
Our results generally agree with the ones obtained by Wang et al. (2015) on the influence of a strongly increased future greenhouse gas forcing on upwelling
inten-25
evo-OSD
12, 2899–2930, 2015Imprint of external climate forcing on coastal upwelling in
past and future climate
N. Tim et al.
Title Page
Abstract Introduction
Conclusions References
Tables Figures
◭ ◮
◭ ◮
Back Close
Full Screen / Esc
Printer-friendly Version
Interactive Discussion
Discussion
P
a
per
|
Discussion
P
a
per
|
Discussion
P
a
per
|
Discussion
P
a
per
|
lution of upwelling over the past millennium. The same can be said on the study of Rykaczewski et al. (2015) where again only the upwelling in the EBUs in the rcp8.5 scenario is analysed. They found significant positive trends in the upwelling-favourable winds in the Canary, Humboldt and Benguela systems and negative trends in the Cal-ifornia system. These results agree partly with our findings, underline the differences
5
between the upwelling regions, and indicate the complexity of the upwelling by the dif-ferent results depending on the analysed model – but stress the impact of the external forcing on upwelling in the rcp8.5 scenario.
It has to kept in mind that our results are based on the realism of the analysed Earth System Models. The relatively low model resolution of the atmosphere and of the ocean
10
components could result in an unrealistic representation of the upwelling itself and/or its drivers. As stated by Small et al. (2015), especially the resolution of the atmospheric model has the strongest influence on the simulated coastal upwelling. Furthermore, the current global coupled climate models still display a strong SST bias in the EBUs. The cause of this bias is not completely understood, it may be related to a deficient
15
representation of coastal upwelling but it may have other causes, for instance related to biases in the climate clouds (Richter, 2015). This caveat, nevertheless, also affects the recent studies by Rykaczewski et al. (2015) and Wang et al. (2015), since they are also based on the CMIP5 models.
Analysing ensembles of simulation of the Earth System Model CESM-CAM5 over
20
the past millennium supports the results of the MPI-ESM.
Thus, the circumstantial evidence linking the recent observed trends in EBUs up-welling to external climate forcing is in conflict with state-of-the art climate simulations.
Acknowledgements. The German Federal Ministry of Education and Research (BMBF, Germany) supported this study as part of the Geochemistry and Ecology of the Namibian
25
Upwelling System (GENUS) project. This research also benefited from frequent discus-sions in the Cluster of Excellence Integrated Climate System Analysis and Prediction (CliSAP). The Max-Planck-Institute for Meteorology kindly provided the model data. There is no potential conflict of interest of the authors. We thank Dennis Bray for his editorial assistance.
OSD
12, 2899–2930, 2015Imprint of external climate forcing on coastal upwelling in
past and future climate
N. Tim et al.
Title Page
Abstract Introduction
Conclusions References
Tables Figures
◭ ◮
◭ ◮
Back Close
Full Screen / Esc
Printer-friendly Version
Interactive Discussion
Discussion
P
a
per
|
Discussion
P
a
per
|
Discussion
P
a
per
|
Discussion
P
a
per
|
The article processing charges for this open-access publication were covered by a Research Centre of the Helmholtz Association.
References
Bakun, A.: Global climate change and intensification of coastal ocean upwelling, Science, 247, 198–201, doi:10.1126/science.247.4939.198, 1990. 2900
5
Bakun, A., Field, D. B., Redondo-Rodriguez, A., and Weeks, S. J.: Greenhouse gas,upwelling-favorable winds, and the future of coastal ocean upwelling ecosystems, Glob. Change Biol., 16, 1213–1228, doi:10.1111/j.1365-2486.2009.02094.x, 2010. 2901
Crowley, T. J., Zielinski, G., Vinther, B., Udisti, R., Kreutz, K., Cole-Dai, J., and Castellano, E.: Volcanism and the little ice age, PAGES News, 16, 22–23, 2008. 2903
10
Di Lorenzo, E., Miller, A. J., Schneider, N., Williams, J. C.: The warming of the california current system: dynamics and ecosystem implications, J. Phys. Oceanogr., 35, 336–362, doi:10.1175/JPO-2690.1, 2005. 2901
Fernández-Donado, L., González-Rouco, J. F., Raible, C. C., Ammann, C. M., Barriopedro, D., García-Bustamante, E., Jungclaus, J. H., Lorenz, S. J., Luterbacher, J., Phipps, S. J.,
Ser-15
vonnat, J., Swingedouw, D., Tett, S. F. B., Wagner, S., Yiou, P., and Zorita, E.: Large-scale temperature response to external forcing in simulations and reconstructions of the last mil-lennium, Clim. Past, 9, 393–421, doi:10.5194/cp-9-393-2013, 2013. 2907
Giorgetta, M. A., Jungclaus, J., Reick, C. H., Legutke, S., Bader, J., Böttinger, M., Brovkin, V., Crueger, T., Esch, M., Fieg, K., Dlushak, K., Gayler, V., Haak, H., Hollweg, H.-D., Ilyina, T.,
20
Kinne, S., Kornblueh, L., Matei, D., Mauritsen, T., Mikolajewiez, U., Mueller, W., Notz, D., Pi-than, F., Raddatz, T., Rast, S., Redler, R., Roeckner, E., Schmidt, H., Schnur, R., Segschnei-der, J., Six, K. D., Stockhause, M., Timmreck, C., Wegner, J., Widmann, H., Wieners, K.-H., Claussen, M., Marotzke, J., and Stevens, B.: Climate and carbon cycle changes from 1850 to 2100 in MPI-ESM simulations for the Coupled Model Intercomparison Project phase 5, J.
25
Adv. Model. Earth Syst., 5, 572–597, doi:10.1002/jame.20038, 2013. 2903
Gutíerrez D., Bouloubassi, I., Sifeddine, A., Purca, S., Goubanova, K., Graco, M., Field, D., Me-janelle, L., Velazco, F., Lorre, A., Salvattcci, R., Quispc, D., Vargas, G., Dewitte, B., and
OSD
12, 2899–2930, 2015Imprint of external climate forcing on coastal upwelling in
past and future climate
N. Tim et al.
Title Page
Abstract Introduction
Conclusions References
Tables Figures
◭ ◮
◭ ◮
Back Close
Full Screen / Esc
Printer-friendly Version
Interactive Discussion
Discussion
P
a
per
|
Discussion
P
a
per
|
Discussion
P
a
per
|
Discussion
P
a
per
|
the mid-twentieth century, Geophys. Res. Lett., 38, L07603, doi:10.1029/2010GL046324, 2011. 2901
Hegerl, G. C., Crowley, T. J., Hyde, W. T., and Frame, D. J.: Climate sensitivity constrained by temperature reconstructions over the past seven centuries, Nature, 440, 1029–1032, doi:10.1038/nature04679, 2006. 2907
5
Hsueh, Y. and Kenny III, R. N.: Steady coastal upwelling in a continuously stratified ocean, J. Phys. Oceanogr., 2, 27–33, doi:10.1175/1520-0485(1972)002<0027:SCUIAC>2.0.CO;2, 1972. 2910
Kay, J. E., Deser, C., Phillips, A., Mai, A., Hannay, C., Strand, G., Arblaster, J. M., Bates, S. C., Danabasoglu, G., Edwards, J., Holland, M., Kushner, P., Lamarque, J.-F., Lawrence, D.,
Lind-10
say, K., Middleton, A., Munoz, E., Neale, R., Oleson, K., Polvani, L., and Vertenstein, M.: The Community Earth System Model (CESM) Large Ensemble Project: a community resource for studying climate change in the presence of internal climate variability, B. Am. Meteorol. Soc., 96, 1333–1349, 2015. 2904
Laskar, J., Robutel, R., Joutel, F., Gastineau, M., Correia, A. C. M., and Levrard, B.: A
long-15
term numerical solution for the insolation quantities of the Earth, Astron. Astrophys., 428, ArXiv:1103.4958v2, 261–285, 2005. 2907
Macías, D., Landry, M. R., Gershunov, A., Miller, A. J., and Franks, P. J. S.: Climate control of upwelling variability along the Western North-American coast, PlosOne, 7, e3436, 1–13, 2012. 2907
20
Mackas, D. L., Strub, P. T., Thomas, A., and Montecino, V.: Eastern ocean boundaries pan-regional overview, in: The Sea. The Global Coastal Ocean: Interdisciplinary Regional Studies and Syntheses, edited by: Robinson, A. R. and Brink, K. H., Harvard Press, Cambridge, MA, USA, 21–59, 2006. 2909
McGregor, H. V., Dima, M., Fischer, H. W., and Mulitza, S.: Rapid 20th-century
25
increase in coastal upwelling off northwest Africa, Science, 315, 637–639,
doi:10.1126/science.1134839, 2007. 2900, 2901
Myhre, G., Shindell, D., Bréon, F.-M., Collins, W., Fuglestvedt, J., Huang, J., Koch, D., Lamar-que, J.-F., Lee, D., Mendoza, B., Nakajima, T., Robock, A., Stephens, G., Takemura, T., and Zhang, H.: Anthropogenic and natural radiative forcing, in: Climate Change 2013: The
Phys-30
G.-OSD
12, 2899–2930, 2015Imprint of external climate forcing on coastal upwelling in
past and future climate
N. Tim et al.
Title Page
Abstract Introduction
Conclusions References
Tables Figures
◭ ◮
◭ ◮
Back Close
Full Screen / Esc
Printer-friendly Version
Interactive Discussion
Discussion
P
a
per
|
Discussion
P
a
per
|
Discussion
P
a
per
|
Discussion
P
a
per
|
K., Tignor, M., Allen, S. K., Boschung, J., Nauels, A., Xia, Y., Bex, V., and Midgley, P. M., Cambridge University Press, Cambridge, UK and New York, NY, USA, 659–740, 2013. 2908 Narayan, N., Paul, A., Mulitza, S., and Schulz, M.: Trends in coastal upwelling intensity during
the late 20th century, Ocean Sci., 6, 815–823, doi:10.5194/os-6-815-2010, 2010. 2900 Otto-Bliesner, B. L., Brady, E. C., Fasullo, J., Jahn, A., Landrum, L., Stevenson, S.,
Rosen-5
bloom, N., Mai, A., and Strand, G.: Climate variability and change since 850 C.E.: an en-semble approach with the Community Earth System Model (CESM), B. Am. Meteorol. Soc., submitted 15 February 2015. 2904
Pardo, P. C., Padín, X. A., Gilcoto, M., Farina-Busto, L., and Pérez, F. F.: Evolution of upwelling systems coupled to the long-term variability in sea surface temperature and Ekman transport,
10
Clim. Res., 48, 231–246, doi:10.3354/cr00989, 2011. 2901
Pongratz, J., Raddatz, T., Reick, C. H., Esch, M., and Claussen, M.: Radiative forcing from anthropogenic land cover change since A. D. 800, Geophys. Res. Lett., 36, L02709, doi:10.1029/2008GL036394, 2009. 2903
Richter, I.: Climate model biases in the eastern tropical ocean: causes, impacts and ways
15
forward, WIREs Climate Change, 6, 345–358, doi:10.1002/wcc.338, 2015. 2902, 2912 Rykaczewski, R. R. and Dunne, J. P.: Enhanced nutrient supply to the California Current
Ecosystem with global warming and increased stratification in an earth system model, Geo-phys. Res. Lett., 37, L21606, doi:10.1029/2010GL045019, 2010. 2901
Rykaczewski, R. R., Dunne, J. P., Sydeman, W. J., García-Reyes, M., Black, B. A., and
Bon-20
grad, S. J.: Poleward displacement of coastal upwelling-favourable winds in the ocean’s eastern boundary currents through the 21st century, Geophys. Res. Lett., 42, 6424–6431, doi:10.1002/2015GL064694, 2015. 2912
Santos, F., Gomez-Gesteira, M., deCastro, M., and Alvarez, I.: Differences in coastal and
oceanic SST trends due to the strengthening of coastal upwelling along the Benguela current
25
system, Cont. Shelf Res., 34, 79–86, doi:10.1016/j.csr.2011.12.004, 2012. 2901
Schmidt, G. A., Jungclaus, J. H., Ammann, C. M., Bard, E., Braconnot, P., Crowley, T. J., De-laygue, G., Joos, F., Krivova, N. A., Muscheler, R., Otto-Bliesner, B. L., Pongratz, J., Shin-dell, D. T., Solanki, S. K., Steinhilber, F., and Vieira, L. E. A.: Climate forcing reconstructions for use in PMIP simulations of the last millennium (v1.0), Geosci. Model Dev., 4, 33–45,
30
OSD
12, 2899–2930, 2015Imprint of external climate forcing on coastal upwelling in
past and future climate
N. Tim et al.
Title Page
Abstract Introduction
Conclusions References
Tables Figures
◭ ◮
◭ ◮
Back Close
Full Screen / Esc
Printer-friendly Version
Interactive Discussion
Discussion
P
a
per
|
Discussion
P
a
per
|
Discussion
P
a
per
|
Discussion
P
a
per
|
Small, R. J., Curchitser, E., Hedstrom, K., Kauffman, B., and Large, W. G.: The Benguela
up-welling system: quantifying the sensitivity to resolution and coastal wind representation in a global climate model, J. Climate, doi:10.1175/JCLI-D-15-0192.1, 2015. 2902, 2912
Stocker, T. F., Qin, D., Plattner, G.-K., Alexander, L. V., Allen, S. K., Bindoff, N. L., Bréon,
F.-M., Church, J. A., Cubasch, U., Emori, S., Forster, P., Friedlingstein, P., Gillett, N.,
Gre-5
gory, J. M., Hartmann, D. L., Jansen, E., Kirtman, B., Knutti, R., Krishna Kumar, K., Lemke, P., Marotzke, J., Masson-Delmotte, V., Meehl, G. A., Mokhov, I. I., Piao, S., Ramaswamy, V., Randall, D., Rhein, M., Rojas, M., Sabine, C., Shindell, D., Talley, L. D., Vaughan, D. G., and Xie, S.-P.: Technical summary, in: Climate Change 2013: The Physical Science Basis. Con-tribution of Working Group I to the Fifth Assessment Report of the Intergovernmental Panel
10
on Climate Change, edited by: Stocker, T. F., Qin, D., Plattner, G.-K., Tignor, M., Allen, S. K., Boschung, J., Nauels, A., Xia, Y., Bex, V., and Midgley, P. M., Cambridge University Press, Cambridge, UK and New York, NY, USA, 33–115, 2013. 2922
Sydeman, W. J., García-Reyes, M., Schoeman, D. S., Rykaczewski, R. R., Thompson, S. A. Black, B. A., and Bograd, S. J. Climate change and wind intensification in coastal upwelling
15
ecosystems, Science, 345, 77–80, doi:10.1126/science.1251635, 2014. 2901
Taylor, K. E., Stougger, R. J., and Meehl, G. A.: An overview of CMIP5 and the experiment design, B. Am. Meteorol. Soc., April, 93, 485–498, doi:10.1175/BAMS-D-11-00094.1, 2012. 2901
Tett, S. F. B., Betts, R., Crowley, T. J., Gregory, J., Johns, T. C., Jones, A., Osborn, T. J.,
20
Öström, E., Roberts, D. J., and Woodage, M. J.: The impact of natural and anthropogenic forcings on climate and hydrology since 1550, Clim. Dynam., 28, 3–34, doi:10.1175/BAMS-D-13-00255.1, 2007. 2910
Tomczak, M. and Godfrey, J. S.: Regional Oceanography: An Introduction, 2nd edn., Daya Publishing House, Delhi, ISBN: 8170353068, 2003. 2906, 2909
25
Vieira, L. E. A., Solanki, S. K., Krivova, N. A., and Usoskin, I.: Evolution of the solar irradi-ance during the Holocene, Astron. Astrophys., 531, ArXiv:1103.4958v2, doi:10.1051/0004-6361/201015843, 2011. 2903
Wang, C., Zhang, L., Lee, S.-K., Wu, L., and Mechoso, C.: A global perspective on CMIP5 climate model biases, Nature Climate Change, 4, 201–205, doi:10.1038/NCLIMATE2118,
30
OSD
12, 2899–2930, 2015Imprint of external climate forcing on coastal upwelling in
past and future climate
N. Tim et al.
Title Page
Abstract Introduction
Conclusions References
Tables Figures
◭ ◮
◭ ◮
Back Close
Full Screen / Esc
Printer-friendly Version
Interactive Discussion
Discussion
P
a
per
|
Discussion
P
a
per
|
Discussion
P
a
per
|
Discussion
P
a
per
|
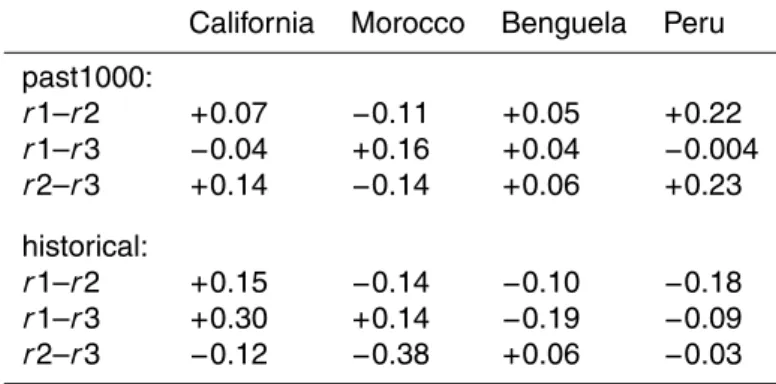
Table 1. Correlation coefficients of the simulations of the upwelling indices of all upwelling regions for the past1000 and historical simulations with the MPI-ESM model with 10 and 30 year filter, respectively.
California Morocco Benguela Peru
past1000:
r1–r2 +0.07 −0.11 +0.05 +0.22
r1–r3 −0.04 +0.16 +0.04 −0.004
r2–r3 +0.14 −0.14 +0.06 +0.23
historical:
r1–r2 +0.15 −0.14 −0.10 −0.18
r1–r3 +0.30 +0.14 −0.19 −0.09
OSD
12, 2899–2930, 2015Imprint of external climate forcing on coastal upwelling in
past and future climate
N. Tim et al.
Title Page
Abstract Introduction
Conclusions References
Tables Figures
◭ ◮
◭ ◮
Back Close
Full Screen / Esc
Printer-friendly Version
Interactive Discussion
Discussion
P
a
per
|
Discussion
P
a
per
|
Discussion
P
a
per
|
Discussion
P
a
per
|
Table 2.Sign of trends of the upwelling time series of all upwelling regions for the past1000, the historical, and the scenarios (rcp2.6, rcp4.5, rcp8.5) simulations with the MPI-ESM model.
California Morocco Benguela Peru
past1000:
r1 − − − +
r2 − + + +
r3 + + + −
historical:
r1 − − − +
r2 −** − + −
r3 −** − − −
rcp2.6:
r1 − − − −
r2 − − + +
r3 − −** + +
rcp4.5:
r1 − −** − −
r2 − − + −
r3 −** −** +** +
rcp8.5:
r1 −** −** +** +
r2 −** −** +** −
OSD
12, 2899–2930, 2015Imprint of external climate forcing on coastal upwelling in
past and future climate
N. Tim et al.
Title Page
Abstract Introduction
Conclusions References
Tables Figures
◭ ◮
◭ ◮
Back Close
Full Screen / Esc
Printer-friendly Version
Interactive Discussion
Discussion
P
a
per
|
Discussion
P
a
per
|
Discussion
P
a
per
|
Discussion
P
a
per
|
Table 3.Correlation coefficients of the simulations of the cross-coastline pressure gradient of all upwelling regions for the past1000 and historical simulations with the MPI-ESM model after 10 and 30 year filter, respectively.
California Morocco Benguela Peru
past1000:
r1–r2 +0.12 +0.04 −0.03 +0.11
r1–r3 +0.21 +0.21 +0.28 +0.25
r2–r3 +0.32 −0.30 −0.18 +0.36
historical:
r1–r2 +0.09 +0.10 −0.25 +0.26
r1–r3 −0.27 +0.27 −0.20 +0.06
OSD
12, 2899–2930, 2015Imprint of external climate forcing on coastal upwelling in
past and future climate
N. Tim et al.
Title Page
Abstract Introduction
Conclusions References
Tables Figures
◭ ◮
◭ ◮
Back Close
Full Screen / Esc
Printer-friendly Version
Interactive Discussion
Discussion
P
a
per
|
Discussion
P
a
per
|
Discussion
P
a
per
|
Discussion
P
a
per
|
Table 4.Correlation coefficients of the simulations of alongshore wind stress of all upwelling re-gions for the past1000 and historical simulations with the MPI-ESM model after 10 and 30 year filter, respectively.
California Morocco Benguela Peru
past1000:
r1–r2 −0.02 −0.22 +0.001 +0.07
r1–r3 −0.05 +0.09 −0.13 +0.09
r2–r3 +0.27 −0.05 +0.22 +0.14
historical:
r1–r2 +0.45 −0.01 −0.27 +0.19
r1–r3 −0.08 +0.09 −0.06 +0.04
OSD
12, 2899–2930, 2015Imprint of external climate forcing on coastal upwelling in
past and future climate
N. Tim et al.
Title Page
Abstract Introduction
Conclusions References
Tables Figures
◭ ◮
◭ ◮
Back Close
Full Screen / Esc
Printer-friendly Version
Interactive Discussion
Discussion
P
a
per
|
Discussion
P
a
per
|
Discussion
P
a
per
|
Discussion
P
a
per
|
month
Jan FebMarAprMayJunJulAugSepOctNovDec
m/month
California(x 3)
Morocco Benguela Peru
California(x 3)
Morocco Benguela
Peru
past1000 historical
0 25
0
b c
month
Jan FebMarAprMayJunJulAugSepOctNovDec Kelvin
a
50
25
-20
Figure 2.Mean sea surface temperature in June–August simulated by one past1000
simula-tion with the MPI-ESM Earth System Model in the tropics and subtropics(a). Monthly mean
vertical velocity at 52 m depth in four main coastal upwelling regions simulated in one past1000
(900–1850) (b) and one historical (1850–2005) simulation (c) of the MPI-ESM. The values
for California have been re-scaled for better visibility. Note the differenty axis scale for each
OSD
12, 2899–2930, 2015Imprint of external climate forcing on coastal upwelling in
past and future climate
N. Tim et al.
Title Page
Abstract Introduction
Conclusions References
Tables Figures
◭ ◮
◭ ◮
Back Close
Full Screen / Esc
Printer-friendly Version
Interactive Discussion
Discussion
P
a
per
|
Discussion
P
a
per
|
Discussion
P
a
per
|
Discussion
P
a
per
|
0 0.30 0.60
-0.30 -0.60
California Morocco
Peru Benguela
a b
c d
90S 60S 30S 30N 60N 90N
EQ
correlation coefficient 90S
60S 30S 30N 60N 90N
EQ
120W 60W 0 60E 120E 1800 60E 120E 180 120W 60W 180
OSD
12, 2899–2930, 2015Imprint of external climate forcing on coastal upwelling in
past and future climate
N. Tim et al.
Title Page Abstract Introduction Conclusions References Tables Figures ◭ ◮ ◭ ◮ Back Close
Full Screen / Esc
Printer-friendly Version Interactive Discussion Discussion P a per | Discussion P a per | Discussion P a per | Discussion P a per |
900 1100 1300 1500 1700 40 45 50 m/month Peru m/month 10 11 12 13 14 15 m/month Morocco 4 5 6 7 California 12 13 14 15 16 17 Peru
1850 1900 1950 2000 8 9 10 11 12 Morocco 0.5 1.0 1.5 2.0 California m/month Past1000 historical -+ + -- --- -+- --2.5 m/month /1000y
1850 year year --+ -++ c d f g h e 9 10 11 12 13 18 19 20 21 22 -+ -Benguela -++ Benguela
-2.2 m/month /1000y
a b
OSD
12, 2899–2930, 2015Imprint of external climate forcing on coastal upwelling in
past and future climate
N. Tim et al.
Title Page
Abstract Introduction
Conclusions References
Tables Figures
◭ ◮
◭ ◮
Back Close
Full Screen / Esc
Printer-friendly Version
Interactive Discussion
Discussion
P
a
per
|
Discussion
P
a
per
|
Discussion
P
a
per
|
Discussion
P
a
per
|
-0.5 0 0.5
past1000 historical
a b
0.00 0.05 0.10 0.15 0.20
-0.5 0 0.5
Correlation coefficients Correlation coefficients
Figure 5. Frequency histogram in bins of 0.05 width showing the distribution of across-ensemble correlations between the upwelling indices simulated in each upwelling region for
the ensembles past1000(a) and historical (b) of the MPI-ESM, after low-pass filtering with
OSD
12, 2899–2930, 2015Imprint of external climate forcing on coastal upwelling in
past and future climate
N. Tim et al.
Title Page
Abstract Introduction
Conclusions References
Tables Figures
◭ ◮
◭ ◮
Back Close
Full Screen / Esc
Printer-friendly Version
Interactive Discussion
Discussion
P
a
per
|
Discussion
P
a
per
|
Discussion
P
a
per
|
Discussion
P
a
per
|
correlation
coefficient
width of low-pass time filter (years)
r1-r2 r1-r3 r2-r3
a b
r1-r2 r1-r3 r2-r3 0.4
0.2 0.3
0.1
0 -0.1
-0.2 -0.3 -0.4
5 10 15 20 25 30 35 40 45 50 5 10 15 20 25 30 35 40 45 50
Figure 6.Correlations between the simulated upwelling indices in Benguela in three past1000 simulations with the MPI-ESM model after filtering the time series with low-pass filter of
in-creasing period(a)and the same as(a)but for the time series of sea level pressure difference
between land and ocean averaged over the areas most closely correlated with the simulated
OSD
12, 2899–2930, 2015Imprint of external climate forcing on coastal upwelling in
past and future climate
N. Tim et al.
Title Page
Abstract Introduction
Conclusions References
Tables Figures
◭ ◮
◭ ◮
Back Close
Full Screen / Esc
Printer-friendly Version
Interactive Discussion
Discussion
P
a
per
|
Discussion
P
a
per
|
Discussion
P
a
per
|
Discussion
P
a
per
|
past1000 historical
a b
-0.5 0 0.5 -0.5 0 0.5
Correlation coefficients Correlation coefficients
0.00 0.05 0.10 0.15 0.20 0.25
Figure 7. Frequency histogram in bins of 0.05 width showing the distribution of across-ensemble correlations between the upwelling indices simulated in each upwelling region for
the ensembles past1000(a)and historical(b)of the CESM-CAM5, after low-pass filtering with
OSD
12, 2899–2930, 2015Imprint of external climate forcing on coastal upwelling in
past and future climate
N. Tim et al.
Title Page
Abstract Introduction
Conclusions References
Tables Figures
◭ ◮
◭ ◮
Back Close
Full Screen / Esc
Printer-friendly Version
Interactive Discussion
Discussion
P
a
per
|
Discussion
P
a
per
|
Discussion
P
a
per
|
Discussion
P
a
per
|
8 10 12 14 16
Benguela RCP 2.6 Benguela RCP 4.5 Benguela RCP 8.5
2000 2020 2040 2060 2080 2100 2000 2020 2040 2060 2080 2100 2000 2020 2040 2060 2080 2100 25
30 35
Peru RCP 2.6 Peru RCP 4.5 Peru RCP 8.5
m/month
6 7 8 9 0 1 2 3
California RCP 2.6 California RCP 4.5 California RCP 8.5
Morocco RCP 2.6 Morocco RCP 4.5 Morocco RCP 8.5
m/month
m/month
m/month
year year year
a b c
d e f
g h i
j k l
m/month
--- - -- -- ---
--- - -- -- -- -
-+
-- + -- ++ +- ++
+
-- + -- -+ +- -
--1.60 m/month / 100 y
-1.40 m/month / 100 y
-0.90 m/month / 100 y
-0.58 m/month / 100 y
-1.54 m/month / 100 y
-1.60 m/month / 100 y
-0.20 m/month / 100 y
-0.60 m/month / 100 y
-0.77 m/month / 100 y -0.60 m/month / 100 y
2.32 m/month / 100 y
4.03 m/month / 100 y
3.30 m/month / 100 y
2.90 m/month / 100 y
OSD
12, 2899–2930, 2015Imprint of external climate forcing on coastal upwelling in
past and future climate
N. Tim et al.
Title Page
Abstract Introduction
Conclusions References
Tables Figures
◭ ◮
◭ ◮
Back Close
Full Screen / Esc
Printer-friendly Version
Interactive Discussion
Discussion
P
a
per
|
Discussion
P
a
per
|
Discussion
P
a
per
|
Discussion
P
a
per
|
correlation coefficient