ACPD
10, 9431–9462, 2010Climate effects of seasonally varying
biomass burning
G.-R. Jeong and C. Wang
Title Page
Abstract Introduction
Conclusions References
Tables Figures
◭ ◮
◭ ◮
Back Close
Full Screen / Esc
Printer-friendly Version
Interactive Discussion Atmos. Chem. Phys. Discuss., 10, 9431–9462, 2010
www.atmos-chem-phys-discuss.net/10/9431/2010/ © Author(s) 2010. This work is distributed under the Creative Commons Attribution 3.0 License.
Atmospheric Chemistry and Physics Discussions
This discussion paper is/has been under review for the journal Atmospheric Chemistry and Physics (ACP). Please refer to the corresponding final paper in ACP if available.
Climate e
ff
ects of seasonally varying
biomass burning emitted carbonaceous
aerosols (BBCA)
G.-R. Jeong and C. Wang
Center for Global Change Science, Massachusetts Institute of Technology, Cambridge, MA 02139-4307, USA
Received: 7 March 2010 – Accepted: 1 April 2010 – Published: 15 April 2010 Correspondence to: G.-R. Jeong ([email protected])
ACPD
10, 9431–9462, 2010Climate effects of seasonally varying
biomass burning
G.-R. Jeong and C. Wang
Title Page
Abstract Introduction
Conclusions References
Tables Figures
◭ ◮
◭ ◮
Back Close
Full Screen / Esc
Printer-friendly Version
Interactive Discussion
Abstract
The climate impact of the seasonality of Biomass Burning emitted Carbonaceous Aerosols (BBCA) has been studied using an aerosol-climate model coupled with a slab ocean model in a set of 60-year long simulations driven by BBCA emission data with and without seasonal variation, respectively. The model run with seasonally varying
5
emission of BBCA leads to an increase in external mixture of carbonaceous aerosols and a decrease in internal mixtures of carbonaceous aerosols relative to those in the run with constant annual BBCA emissions, resulting from different strengths of source/sink processes. We find that the differences in atmospheric direct radiative forcing (DRF) caused by BBCA seasonality are in phase with the differences in column
10
concentrations of an external mixture of carbonaceous aerosols in space and time; thus, the differences in surface temperature and heat fluxes are limited to the biomass burning source regions. In contrast, the differences in all-sky radiative forcing at the top of the atmosphere and at the earth’s surface extend beyond the BBCA source regions due to climate feedback through cloud distribution and precipitation. The seasonality of
15
biomass burning emissions uniquely affects the global distributions of high-level clouds and convective precipitation, which indicate an impact on atmospheric circulation. We especially find that the Inter-Tropical Convergence Zone (ITCZ) shifts northward when the seasonality of BBCA emissions is included in the model, compared to the case otherwise configured. In addition, the climate response to the periodic climate forcing
20
ACPD
10, 9431–9462, 2010Climate effects of seasonally varying
biomass burning
G.-R. Jeong and C. Wang
Title Page
Abstract Introduction
Conclusions References
Tables Figures
◭ ◮
◭ ◮
Back Close
Full Screen / Esc
Printer-friendly Version
Interactive Discussion
1 Introduction
Biomass burning emitted carbonaceous aerosols (BBCA) play an important role in Earth’s radiation balance and in the hydrological cycle by absorbing and scattering sun-light and by providing condensational nuclei for clouds (Crutzen and Andreae, 1990). The emissions of BBCA specifically become intense during the dry season in the
trop-5
ics. Such unique emission patterns cause a radiative forcing associated with BBCA that significantly varies, both geographically and seasonally.
The most recent report of the global- and annual-mean direct radiative forcing (DRF) of BBCA is estimated to be 0.03±0.12 W/m2 at the top of the atmosphere (TOA) (Forster et al., 2007). However, in the tropical dry season, the regional DRF is
es-10
timated as high as−5 –−17 W/m2 (Kinne et al., 2003). Note here that the negative values are due to a relatively large amount of scattering-dominated BBCA such as par-ticulate organic matter (POM) or organic carbon (OC) rather than black carbon (BC). This regional DRF of BBCA is larger than the global annual mean value by two to three orders of magnitude. Such a strong DRF by BBCA over the emission source region
15
may play a significant role in the regional and global climate.
Previous studies of BBCA were largely focused on the source region and during the biomass burning seasons. Regional field experiments and modeling studies have explored the impacts of BBCA on local precipitation and clouds (Martins et al., 2009; Koren et al., 2004; Ramanathan et al., 2005; Chou et al., 2005; Lin et al., 2006; Bevan
20
et al., 2009). Recent studies suggest that BBCA can invigorate or prohibit precipitation through microphysical effects (by increasing aerosol number concentration) or radia-tive effects (light absorption by BC) (Koren, 2008; Rosenfeld, 2008). In the Amazon, absorbing aerosols emitted from biomass burning is found to suppress the cloud for-mation by heating the aerosol layer and cooling the layer below (Koren et al., 2004;
25
ACPD
10, 9431–9462, 2010Climate effects of seasonally varying
biomass burning
G.-R. Jeong and C. Wang
Title Page
Abstract Introduction
Conclusions References
Tables Figures
◭ ◮
◭ ◮
Back Close
Full Screen / Esc
Printer-friendly Version
Interactive Discussion become dryer. On the other hand, analyses of satellite observations have shown that
cloud cover (high clouds) increases, and stronger rainfall is induced during biomass burning in the Amazon (Lin et al., 2006). Aerosol absorption of radiation in the lower layers of the atmosphere could delay convective evolution but produce higher maximum rainfall rates due to increased instability (Martins et al., 2009).
5
Some studies show the significant global scale changes in climate variables by BC aerosols (Wang, 2004, 2007). Particularly, Wang (2004) found that BC emissions cause a shift of the precipitation center in the ITCZ and a change in the snow depth in the mid- and high- latitudes of the Northern Hemisphere, but not a significant change in global-mean surface temperature. BC radiative forcing may also cause “remote climate
10
impact” and sometimes, it is very similar to the change caused by El Nino/Southern Oscillation (ENSO) event in the tropical Pacific region (Wang, 2007). However, these studies show the seasonal anomalies in climate variables with annual constant BBCA emissions, rather than seasonally varying BBCA emissions.
Several previous studies have focused on the global impact of BBCA emissions
dur-15
ing the dry season on changes in precipitation and clouds (Kinne et al., 2003; Menon et al., 2008; Menon, 2004; Menon and Del Genio, 2007; Rotstayn and Lohmann, 2002; Ramanathan and Carmichael, 2008). Roecker et al. (2006) investigated the impact of carbonaceous emissions on regional climate change by controlling the concentra-tion of carbonaceous aerosols differently in mid-latitude (increase) and in low-latitude
20
(decrease). The results show that the low-latitude surface cooling is caused primar-ily by the 5–60 W/m2 increase in the BC absorption of solar radiation. This finding is similar to previous observational and modeling studies, respectively (Krishnan and Ramanathan, 2002; Menon et al., 2002). They all suggest that less surface solar radi-ation and associated surface cooling result in less evaporradi-ation but more soil moisture;
25
ACPD
10, 9431–9462, 2010Climate effects of seasonally varying
biomass burning
G.-R. Jeong and C. Wang
Title Page
Abstract Introduction
Conclusions References
Tables Figures
◭ ◮
◭ ◮
Back Close
Full Screen / Esc
Printer-friendly Version
Interactive Discussion In this study, we investigate how the seasonally varying DRF of BBCA, which it is a
heterogeneously distributed forcing, could affect climate systems when feedbacks par-ticularly from clouds and precipitation are considered. The interactive aerosol-climate model used in this study along with model configuration and methodology are de-scribed in the next section, followed by the description and discussions of major results.
5
The conclusion will be drawn in the last section.
2 The model and configuration
In order to determine the effects of seasonally varying climate forcing, we have pre-pared two sets of emission data: a seasonal emission and a non-seasonal emis-sion. The seasonal biomass burning emission of carbonaceous aerosols was prepared
10
based on the monthly biomass burning BC data of the GEIA (http://www.geiacenter. org). The OC biofuel emission was derived by scaling the biofuel BC emission by a factor of six (Bond et al., 2004). In the non-seasonal emission, constant BBCA emis-sions derived based on the annual mean were adopted for each month. The same fossil fuel emissions were used in both emission sets. The fossil fuel emissions were
15
derived from the MIT Emission Prediction and Policy Analysis Model (EPPA; Paltsev et al., 2005) and are constant through different months. The annual BC and OC emissions are 6.1 Tg/yr and 36.9 Tg/yr for the biofuel emissions, and 8.6 Tg/yr and 20.8 Tg/yr for the fossil fuel emissions, respectively. Figure 1 shows the seasonal biomass burn-ing BC emissions along with annual-mean fossil fuel and biomass burnburn-ing emissions
20
of carbonaceous aerosols. The highest emission regions of fossil fuel carbonaceous aerosols are in China and India followed by Europe, eastern US, and central Africa.
The major BBCA sources include tropical Africa, South America, Siberia, and South Asia. The emissions have strong seasonality, appearing in the southern part of Africa and the southern part of South America, south Asia, and Siberia in boreal
25
ACPD
10, 9431–9462, 2010Climate effects of seasonally varying
biomass burning
G.-R. Jeong and C. Wang
Title Page
Abstract Introduction
Conclusions References
Tables Figures
◭ ◮
◭ ◮
Back Close
Full Screen / Esc
Printer-friendly Version
Interactive Discussion (September-October-September, SON), the emissions gradually disappear from the
equator in Africa and South America while the winter emissions begin emerging from the north part of Africa. In other words, BBCA emission regions migrate over Africa and South America from season to season except in boreal spring (March-April-May, MAM). The global means of seasonal BBCA emissions of BC are 0.50 Tg/yr, 2.00 Tg/yr,
5
1.19 Tg/yr, and 1.75 Tg/yr in boreal spring, summer, fall, and winter, respectively. The global means of seasonal biomass burning OC emissions are 3.01 Tg/yr, 12.02 Tg/yr, 7.17 Tg/yr, and 10.51 Tg/yr in boreal spring, summer, fall, and winter, respectively.
These carbonaceous emissions were fed into a three-dimensional interactive aerosol-climate model developed from the Community Atmospheric Model version 3
10
(CAM3) of the National Center for Atmospheric Research (NCAR) (Kim et al., 2008). Its aerosol module describes size- and mixing state-dependent physiochemical and hygroscopic processes of seven aerosol modes using a two-moment scheme. These modes include the main anthropogenic aerosols separated based on size, composi-tion, and mixing state, including external mixture of BC, external mixture of OC, and
15
three modes of external sulfate (nucleation, Aitken, and accumulation mode), and one internal mixture of BC as the core and sulfate as the shell (MBS), and one internal mixture of OC and sulfate in homogeneous mixing (MOS). Each of these modes has a prognostic size distribution. The model results have been compared with satellite, sur-face, and aircraft measurements. The aerosol module fully interacts with CAM3. The
20
prediction of aerosol module is driven by CAM3 predicted variables such as tempera-ture, humidity, pressure, wind, as well as cloud and precipitation in CAM3 time step. When the option is selected, the aerosol properties predicted by the aerosol module are used in the radiation module of CAM3 to calculate the atmospheric radiative budget and thus to affect climate dynamics. For details of the model and model performance
25
against observations, see Kim et al. (2008).
ACPD
10, 9431–9462, 2010Climate effects of seasonally varying
biomass burning
G.-R. Jeong and C. Wang
Title Page
Abstract Introduction
Conclusions References
Tables Figures
◭ ◮
◭ ◮
Back Close
Full Screen / Esc
Printer-friendly Version
Interactive Discussion the radiation module of CAM3, and thus the interaction between aerosol and climate
is only one way (aerosol module is still driven by CAM3 dynamics and physics predic-tion). The useful feature of this set of runs is to derive the radiative forcing of BBCA without disturbing the climate state. The radiative forcing is derived by calling the ra-diation module twice at each time step, with or without aerosol loading, respectively.
5
The difference of radiative fluxes resulting from these two calls derives the radiative forcing of aerosols. The radiative profile derived from the second call, i.e., the one without aerosol loading, is actually used in the climate model. This set is hereafter called offline runs. In the second set of simulations, the aerosol module and CAM3 are fully interactive, i.e., not only is the aerosol module driven by the climate model, the
10
predicted aerosol properties are also used in the CAM3 radiation module and thus the feedback of climate dynamics to aerosol forcing is included. This set will be referred to as online runs. Offline runs lasted 5 years and were driven by observed sea surface temperature (SST). We use the last 3-year means of modeled results in analyses un-less otherwise indicated. In online runs, the model was coupled to a slab ocean model
15
and the integration times were 60 years to reach equilibrium. The last 20-year means of the results are used in analyses.
The effects of seasonality of BBCA on aerosol direct radiative forcing (DRF) and on climate are isolated by comparing the results of two runs, in either offline or online set, each with and without seasonal BBCA emissions, respectively, i.e.,
20
∆c=cseasonal−cnon
−seasonal (1)
wherecis a given quantity (aerosol DRF or other variables),cseasonalandcnon
−seasonal
represent the results of the run using seasonal and non-seasonal BBCA emissions, respectively. ∆crefers to the difference as the “effect of BBCA seasonality onc”. For instance,∆DRF indicates the differences in DRF of seasonal BBCA emissions relative
25
ACPD
10, 9431–9462, 2010Climate effects of seasonally varying
biomass burning
G.-R. Jeong and C. Wang
Title Page
Abstract Introduction
Conclusions References
Tables Figures
◭ ◮
◭ ◮
Back Close
Full Screen / Esc
Printer-friendly Version
Interactive Discussion
3 Results
3.1 Global means of aerosol direct radiative forcing
Given the two sets of biomass burning carbonaceous aerosol data for each model configuration (online and offline), the direct radiative forcings (DRF) and the differences in DRF due to the emission seasonality (∆DRF) were examined after implementing
5
the 5-year offline runs and 60-year interactive runs, respectively. Note again that the “forcing” derived from the online runs include climate feedbacks to the aerosol effect and therefore, are not really the forcing defined in IPCC 2001 (Ramaswamy et al., 2001).
Table 1 shows the values of DRF and∆DRF in global seasonal and annual means
10
derived from offline runs. When seasonal BBCA emissions are used, the annual all-sky DRF is−0.11, −1.96, and +1.85 W/m2 at the TOA, at the surface, and in the atmo-sphere, respectively, representing a 58% difference (∆DRF) at TOA while very small changes in the atmosphere and surface compared to the case using non-seasonal emissions. On the other hand, the global seasonal means of∆DRF at TOA vary by a
15
factor of−7.3 in boreal winter and+4.6 in spring. Such a large difference in seasonal all-sky DRF is also clearly shown in the global distribution of ∆DRF at TOA (Fig. 2). Negative ∆DRF at TOA are distinct in biomass burning source region in all the sea-sons. Positive∆DRF at TOA are dominant in the equatorial regions of Africa and South America during boreal winter, and in the west sea of South America and Africa during
20
boreal summer. These patterns of∆DRF at TOA reflect the patterns of aerosol column concentrations due to the seasonality of BBCA emissions (high in winter and very low in spring) and, most importantly, the cloud effect on the DRF of BBCA because, for the same set of runs, clear-sky∆DRF values do not display such a large relative difference. Note that the large fraction of OC in BBCA would greatly increase the single scattering
25
albedo of aerosol bulk and thus lead to a more negative TOA forcing.
ACPD
10, 9431–9462, 2010Climate effects of seasonally varying
biomass burning
G.-R. Jeong and C. Wang
Title Page
Abstract Introduction
Conclusions References
Tables Figures
◭ ◮
◭ ◮
Back Close
Full Screen / Esc
Printer-friendly Version
Interactive Discussion values of DRF in all-sky are −0.24 W/m2, −1.72 W/m2, and +1.48 W/m2 at TOA, at
surface, and in the atmosphere, respectively. The global annual mean of differences in DRF (∆DRF) at TOA relative to non-seasonal emission, is about 15.3% while the global seasonal means of∆DRF at TOA are in the range of a factor of−0.71 to+5.47. The magnitude of∆DRF at TOA is larger than those at surface and in the atmosphere.
5
3.2 Global distribution of aerosol loading and direct radiative forcing
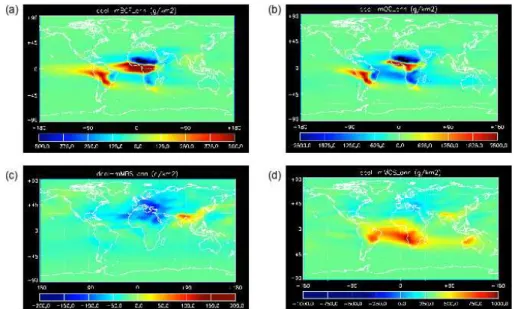
Figure 3 shows the global distributions of annual mean of the differences in the col-umn loading of external BC and OC as well as their mixtures with sulfate, i.e., MBS and MOS due to the seasonality of BBCA emissions. The large magnitudes of the differences in column loadings of external mixture of carbonaceous aerosols are
con-10
centrated on the aerosol source regions. For instance, the largest magnitudes of∆BC and ∆OC appear over South America and Africa. On the other hand, the effect of the seasonality of BBCA emissions on BC- sulfate mixtures (MBS) and OC- sulfate mixtures (MOS) can be found distant from the aerosol source regions, reflecting a dif-ference in the life cycles of various aerosols (the mixtures are formed through chemical
15
aging of external aerosols in our model). For the mixtures,∆MBS is clearly negative over northern Africa, southern Europe, and the Atlantic Ocean while positive over In-dia, the Tibetan Plateau, and the east coast of Asia. The increase of∆MOS dominates over most biomass source regions and, most importantly, clearly extends to the down-wind regions. The differences in column loading of mixtures relative to the seasonality
20
of biomass emissions, such as∆MBS and∆MOS, are about 40% of the differences in column loading of BC and OC, respectively. In addition, the effect of the seasonality of BBCA emissions on OC and MOS are much larger than that on BC and MBS by a factor of 5.
On a global-mean basis, the seasonality of BBCA leads to an annual increase in
col-25
ACPD
10, 9431–9462, 2010Climate effects of seasonally varying
biomass burning
G.-R. Jeong and C. Wang
Title Page
Abstract Introduction
Conclusions References
Tables Figures
◭ ◮
◭ ◮
Back Close
Full Screen / Esc
Printer-friendly Version
Interactive Discussion to the relative dryness during the biomass burning seasons. In analysis, we find the
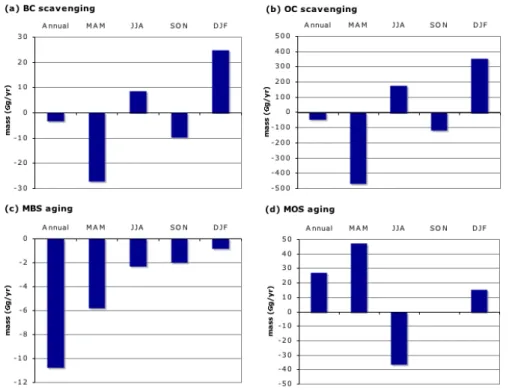
additional emissions in seasonal-BBCA run (i.e., boreal summer and winter) clearly exceed the added scavenging in a relative sense (Fig. 4a, b). Note that in spring (non-biomass burning season), the difference in scavenging of external carbonaceous aerosols is purely a result from greatly reduced emissions in the seasonal-BBCA run.
5
The opposite sign in difference of MOS and MBS column loading is a result of en-hanced aging of OC from the secondary production of biogenic VOC (Kim et al., 2008), specifically during the non-biomass burning season of boreal spring and to a less ex-tent in late fall (Fig. 4c, d). These kinds of secondary organic matters simply fill in the positions hold by BBCA in the constant emission run and thus lead to a greatly
10
enhanced aging for MOS and through consequent transformation, an increase in MOS column loading.
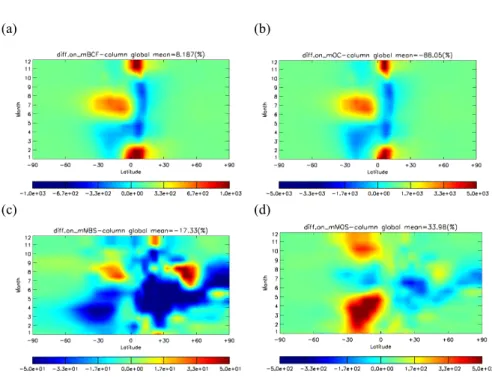
When prepared in the format of Hovm ¨oller diagram (Fig. 5), the zonal and monthly means of ∆BC and ∆OC directly reflect the seasonality of BBCA emissions. How-ever, the patterns of ∆MOS and ∆MBS clearly spread both along the temporal and
15
spatial scales, extending well into non-biomass burning seasons and regions. Interest-ingly, the effect of the seasonality of BBCA emissions also extends to the atmospheric abundance of sulfate aerosols as well as gaseous sulfuric acid (not shown) mostly through the changes in carbonaceous aerosol constituents, however, with complicated patterns. It can be seen that the limitation of available sulfuric acid gases in winter
20
causes the decrease of MBS and MOS in this biomass burning season. However, in the spring and late fall, MOS exhibits an increase in column loading, much due to the above-discussed effect of secondary OC from BVOC.
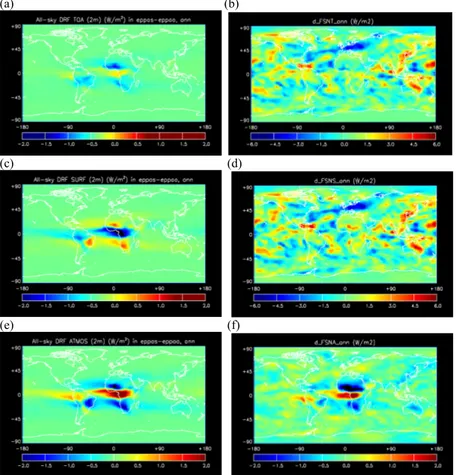
We find that the effects of seasonality of BBCA emissions are very clear in even an-nual mean distributions of radiative forcings of aerosols (Fig. 6). In the offline runs that
25
ACPD
10, 9431–9462, 2010Climate effects of seasonally varying
biomass burning
G.-R. Jeong and C. Wang
Title Page
Abstract Introduction
Conclusions References
Tables Figures
◭ ◮
◭ ◮
Back Close
Full Screen / Esc
Printer-friendly Version
Interactive Discussion aerosols along their transport paths in the atmosphere. When the climate responses
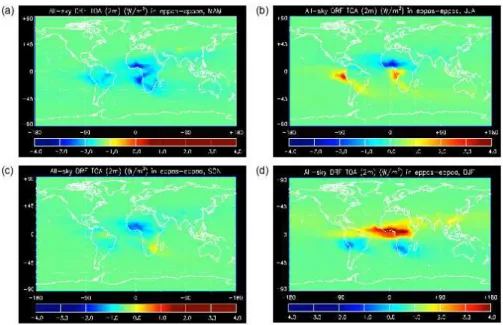
are included, e.g., in the online runs, the distributions of∆DRF at TOA and surface are very complicated and different from those in offline runs, reflecting in particular cloud cover changes forced by the aerosol DRF (Fig. 6b, d). On the other hand, the pattern of atmospheric∆DRF (Fig. 6f) derived from the online runs is similar to that of the offline
5
runs. This is because such a forcing is a direct result of the thermodynamic heating of absorbing aerosols. The evidence of the aerosol-climate interaction in online runs is also shown in the zonal and monthly mean of ∆DRF (Fig. 7). Compared to the offline results that represent the changes in conventionally defined aerosol radiative forcing that peak in summer over the southern hemispheric tropics and subtropics and
10
in spring and winter over the northern hemispheric tropics and subtropics, the online forcing (including the feedbacks) again displays a much more complicated seasonal-ity pattern at TOA and the surface. This indicates that the aerosol direct effects due to the seasonality of BBCA last longer than the biomass burning seasons and have added effects over regions beyond the biomass burning areas. These results imply
15
that the effect of the seasonality of BBCA emissions could exist in a temporal scale much longer than the biomass-burning seasons and, with the evolution of large-scale dynamics, could create a long lasting climate effect.
3.3 Climate responses
Under these seasonally varying climate forcings and mass budgets, we have
inves-20
tigated corresponding climate responses with feedback. The differences in climate variables between the model runs with and without the seasonality of BBCA emissions are examined by using the student t-test for the modeled results of the last 20 years. All the results discussed here are statistically significant with a significance level of 0.1 unless otherwise indicated.
25
ACPD
10, 9431–9462, 2010Climate effects of seasonally varying
biomass burning
G.-R. Jeong and C. Wang
Title Page
Abstract Introduction
Conclusions References
Tables Figures
◭ ◮
◭ ◮
Back Close
Full Screen / Esc
Printer-friendly Version
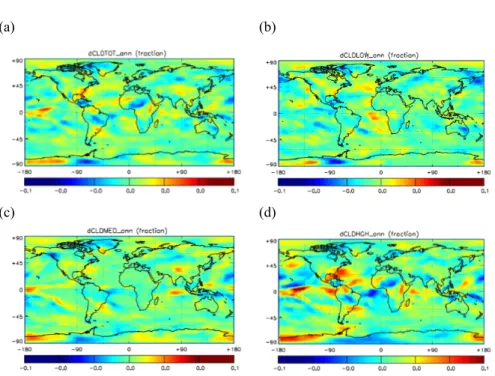
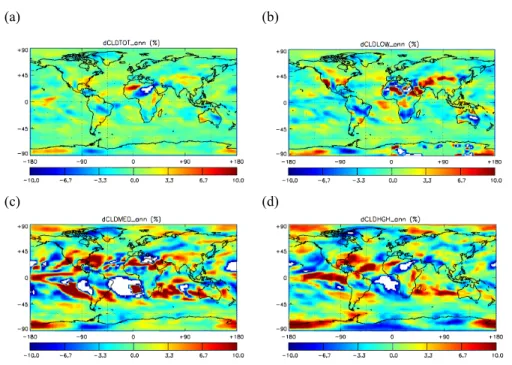
Interactive Discussion (Fig. 9). The most significant positive change in∆CLDLOW (the low-level cloud)
ap-pears in the northwestern coast of Africa and in the eastern part of the US, coinciding with the previously reported regional climate effects of biomass burning (Kaufman et al., 2005). On the other hand, large negative values appear in East Asia and the east part of Australia. The large absolute values of ∆CLDMED (the mid-level clouds) are
5
distributed on storm tracks in the mid-latitude, while those of∆CLDHGH (the high-level clouds) are concentrated on the ITCZ.
We find that the global annual or seasonal means of differences due to BBCA sea-sonality of surface temperature (TS), sensible heat flux (SHFLX), solar heating rates (QRS), convective precipitation (PRECC), and mid-level cloud (CLDMED) are
statisti-10
cally significant. The global distribution of annual or seasonal means of∆TS,∆LHFLX, and∆SHFLX, however, do not necessarily follow the distribution pattern of ∆BC and
∆OC in biomass burning source regions. In the tropical region of the Northern Hemi-sphere in boreal winter and in tropical/subtropical region of the Southern HemiHemi-sphere in boreal summer, the differences in the heat fluxes,∆LHFLX and∆SHFLX, and∆TS
15
are negative. They are positive in biomass burning source regions during non-biomass burning seasons (Fig. 10). The zonal monthly means of differences in heat fluxes are proportional to the differences in surface DRF while they are inversely pro-portional to the differences in atmospheric DRF. In addition, it is clearly seen that the zonal monthly means of the differences in atmospheric DRF are in phase with those of
20
the differences in column average solar heating rates (QRS). The differences in solar heating are also distinct in the aerosol source regions, what we called “local effect”. In contrast, the values of∆QRS in the mid- and upper- troposphere are negative and symmetric to the values at equator as shown in the vertical-cross section of zonal an-nual means of∆QRS (Fig. 10). It may be caused by the cooling due to high-level cloud
25
and the influx of water vapor from the low-level, leading to the changes in atmospheric circulation.
ACPD
10, 9431–9462, 2010Climate effects of seasonally varying
biomass burning
G.-R. Jeong and C. Wang
Title Page
Abstract Introduction
Conclusions References
Tables Figures
◭ ◮
◭ ◮
Back Close
Full Screen / Esc
Printer-friendly Version
Interactive Discussion of the differences in convective cloud (∆CONCLD). There are two distinguishable
lo-cations where∆CONCLD are large. The largest and deepest differences in CONCLD appear along the equatorial region (ITCZ), and the northern part of ITCZ is positive which implies upward motions thus the northward shift of ITCZ. The second noticeable differences in CONCLD appear in the mid-latitude region. Those locations of positive
5
∆CONCLD vary with season. The largest and deepest difference exists in the north of ITCZ in boreal spring and boreal summer while it is weakened in boreal winter in the north of ITCZ. Most of these changes in convective clouds can be observed from the difference in solar heating rate (∆QRS) in the Northern Hemisphere. In the Southern Hemisphere, because of the reduction of clouds in the tropics, the most observable
so-10
lar heating rate change results from the excessive heating of absorbing BBCA aerosols in the lower troposphere and the corresponding deficit in upper tropospheric heating (Fig. 11a).
Another significant difference in climate variables can be seen from the differences in precipitation between the two different runs with and without BBCA seasonality
15
(Fig. 12). When such seasonality is included in the model, ITCZ represented by the dif-ferences in convective precipitation (∆PRECC) would shift toward the Northern Hemi-sphere. This is the same location where the largest differences in CONCLD occur. The northward shift of Hadley cell was suggested as a net warming effect caused by absorbing aerosols in the Northern Hemisphere when annual constant BBCA and
fos-20
sil fuel emissions were used (e.g. Wang, 2004, 2007). Thus, our results demonstrate that the seasonality of BBCA emissions would strengthen the northward shift of ITCZ. On the other hand, ∆PRECL, i.e., the difference in large-scale precipitation can also be observed over storm tracks in the mid-latitude. This is the same location where the second noticeable differences in CONCLD occur. The global distribution of annual
25
ACPD
10, 9431–9462, 2010Climate effects of seasonally varying
biomass burning
G.-R. Jeong and C. Wang
Title Page
Abstract Introduction
Conclusions References
Tables Figures
◭ ◮
◭ ◮
Back Close
Full Screen / Esc
Printer-friendly Version
Interactive Discussion Interestingly, the differences in PRECC and PRECL are larger in non-biomass
burn-ing seasons (sprburn-ing and fall) than biomass burnburn-ing seasons (winter and summer) (Fig. 12c–f). The largest values in∆PRECC in the northern Tropics occur in boreal spring (140 mm/yr), while the smallest values appear in boreal winter. The largest val-ues in∆PRECL in northern mid-latitude appear in boreal spring (35 mm/yr), while the
5
smallest values in∆PRECL appear in boreal winter.
Displayed in the Hovm ¨oller diagram, the patterns of∆PRECC and∆PRECL are not clearly correlated to the patterns of∆DRF (Fig. 12g, h). The pattern of∆PRECC with large differences is along the ITCZ, which is very similar to the patterns of∆CLDHGH. The positive and negative differences distributed along the Tropics on the Northern
10
Hemisphere and Southern Hemisphere, respectively, corresponding to a northward shift of Hadley cell, exist almost statically throughout the entire year but it weakens and moves southward in boreal winter (DJF). This pattern does not follow that of∆BC and ∆OC, and therefore, the impact of the seasonality of BBCA on large-scale at-mospheric circulation far exceeds the biomass burning seasons. The zonal-seasonal
15
∆PRECL has a better-defined pattern in the Northern Hemisphere than in the South-ern Hemisphere, indicating again that the effects of BBCA are biased on the Northern Hemisphere.
4 Conclusions
We have investigated the climate effects of seasonal BBCA emissions using 60-year
20
simulations of the 3-D aerosol-climate model with two sets of BBCA emission data that respectively includes and excludes the seasonality of BBCA emissions. “Seasonal BBCA climate forcing” or “seasonal BBCA effects” were derived from the differences in DRF or other climate variables between the results of these two runs.
The seasonality of BBCA emissions leads to an increase in external mixture of
car-25
ACPD
10, 9431–9462, 2010Climate effects of seasonally varying
biomass burning
G.-R. Jeong and C. Wang
Title Page
Abstract Introduction
Conclusions References
Tables Figures
◭ ◮
◭ ◮
Back Close
Full Screen / Esc
Printer-friendly Version
Interactive Discussion emissions. We find that the differences in atmospheric direct radiative forcing (DRF)
caused by BBCA seasonality are in phase with the differences in column concentra-tions of external mixture of carbonaceous aerosols in space and time. In contrast, the differences in all-sky radiative forcing at TOA and at the surface extend beyond the BBCA source regions due to climate feedback through cloud distribution and
precipita-5
tion.
Such global and seasonal distributions of differences in climate forcing induce the differences in climate variables with significance. These differences appear in places beyond the biomass burning regions and last longer than the biomass burning sea-sons. This is best demonstrated in the results of differences in convective and
large-10
scale precipitation caused by the seasonality of BBCA emissions, represented by a pattern corresponding to a northward shift of ITCZ. The differences in precipitation are actually maxima in boreal spring but minima in boreal winter. The differences in aerosol transformation due to the seasonality of BBCA emissions are clearly shown in mixed aerosols in boreal spring.
15
Such a difference in terms of temporal distribution could also introduce positive feed-back in the BBCA aerosol-climate interaction. These results suggest that excluding the seasonality of BBCA in the climate model could bring a significant artifact in modeled aerosol effects on climate even if the analysis would be done on an annual-mean basis.
Acknowledgements. We thank Dongchul Kim for assisting in the model setup and data
pro-20
cessing, NCAR for providing CAM code and GEIA project for providing emission data. This research is supported by the NASA IDS (NNX07AI49G), NSF (ATM-0329759), and the MIT Joint Program on the Science and Policy of Global Change.
References
Bevan, S. L., North, P. R. J., Grey, W. M. F., Los, S. O., and Plummer, S. E.: Impact of atmo-25
ACPD
10, 9431–9462, 2010Climate effects of seasonally varying
biomass burning
G.-R. Jeong and C. Wang
Title Page
Abstract Introduction
Conclusions References
Tables Figures
◭ ◮
◭ ◮
Back Close
Full Screen / Esc
Printer-friendly Version
Interactive Discussion
Bond, T. C., Streets, D. G., Yarber, K. F., Nelson, S. M., Woo, J., and Klimont, Z.: A technology-based global inventory of black and organic carbon emissions from combustion, J. Geophys. Res., 109, D14203, doi:10.1029/2003JD003697, 2004.
Chou, C., Neelin, J. D., Lohmann, U., and Feichter, J.: Local and Remote Impacts of Aerosol Climate Forcing on Tropical Precipitation, J. Climate, 18, 4621–4635, 2005.
5
Crutzen, P. J. and Andreae, M. O.: Biomass Burning in the tropics: Impact on Atmospheric Chemistry and Biogeochemical Cycles, Science, 250, 1669–1678, 1990.
Feingold, G., Jiang, H., and Harrington, J. Y.: On smoke suppression of cloud in Amazonia, Geophy. Res. Lett., 32, L02804, doi:10.1029/2004GL021369, 2005.
Forster, P., Ramaswamy, V., Artaxo, P., et al.: Chapter 2. Changes in Atmospheric Constituents 10
and in Radiative forcing, IPCC Fourth Assessment Report: Climate Change 2007: Working Group I: The physical Science Basis, edited by: Solomon, S., Qin, D., Manning, M., et al., Cambridge Univ. Press, Cambridge, UK, and New York, NY, USA, 129–234, 2007.
GEIA biomass burning BC data: http://www.geiacenter.org/, last access: 30 April 2008. Kaufman, Y. J., Koren, I., Remer, L. A., Rosenfeld, D., and Rudich, Y: The effect of smoke, dust, 15
and pollution aerosol on shallow cloud development over the Atlantic Ocean, P. Natl. Acad. Sci. USA, 102, 11207–11212, 2005.
Kim, D., Wang, C., Ekman, A. M. L., Barth, M. C., and Rasch, P.: Distribution and direct radiative forcing of carbonaceous and sulfate aerosols in an interactive size-resolving aerosol-climate model, J. Geophys. Res., 113, D16309, doi:10.1029/2007JD009756, 2008.
20
Kinne, S., Lohmann, U., Feichter, J., Schulz, M., Timmreck, C., Ghan, S., Easter, R., Chin, M., Ginoux, P., Takemura, T., Tegen, I., Koch, D., Herzog, M., Penner, J., Pitari, G., Holben, B., Eck, T., Smirnov, A., Dubovik, O., Slutsker, I., Tanre, D., Torres, O., Mishchenko, M., Geogdzhayev, I., Chu, D. A., and Kaufman, Y.: Monthly averages of aerosol properties: A global comparison among models, satellite data, and AERONET ground data, J. Geophys. 25
Res., 108(D20), 4634, doi:10.1029/2001JD001253, 2003.
Koren, I., Kaufman, Y. J., Remer, L. A., and Martins, J. V.: Measurement of the Effect of Amazon Smoke on inhibition of Cloud formation, Science, 303, 1342, doi:10.1126/science.1089424, 2004.
Koren, I., Martins, J. V., Remer, L. A., and Afargan, H.: Smoke invigoration Versus Inhibition of 30
Clouds over Amazon, Science, 321, p. 946, doi:10.1126/science.1159185, 2008.
ACPD
10, 9431–9462, 2010Climate effects of seasonally varying
biomass burning
G.-R. Jeong and C. Wang
Title Page
Abstract Introduction
Conclusions References
Tables Figures
◭ ◮
◭ ◮
Back Close
Full Screen / Esc
Printer-friendly Version
Interactive Discussion
Lin, J. C., Matsui, T., Pielke, R. A., and Kummerow, C.: Effects of biomass-burning-derived aerosols on precipitation and clouds in the Amazon Basin: a satellite-based empirical study, J. Geophys. Res., 111, D19204, doi:10.1029/2005JD006884, 2006.
Martins, J. A., Silva Dias, M. A. F., and Gonc¸alves, F. L. T.: Impact of biomass burning aerosols on precipitation in the Amazon: I. A modeling study, J. Geophys. Res., 114, D02207, 5
doi:10.1029/2007JD 009587, 2009.
Menon, S. and Del Genio, A. D.: Evaluation the impacts of carbonaceous aerosols on clouds and climate, In human-Induced Climate Change: Interdisciplinary Assessment, Schlesinger, M. E., Kheshgi, H. S., Smith, J., et al., Cambridge University Press, Cambridge, UK, 2007. Menon, S.: Current Uncertainties in Assessing Aerosol Effects on Climate, Ann. Rev. Environ. 10
Resour., 29, 1-30, doi:10.1146/annurev.energy.29.063003.132549, 2004.
Menon, S., Unger, N., Koch, D., Francis, J., Garrett, T., Sednev, I., Shindell, D., and Streets, D.: Aerosol climate effects and air quality impacts from 1980 to 2030, Environ. Res. Lett., 3, 024004, doi:10.1088/1748-9326/3/2/024004, 2008.
Menon, S., Hansen, J., Nazarenko, L., and Luo, Y.: Climate effects of Black Carbon Aerosols 15
in China and India, Science, 297, 2250, doi:10,1126.science.1075159, 2002.
Paltsev, S., Reilly, J. M., Jacoby, H. D., Eckaus, R. S., McFarland, J., Sarofim, M., Asadoo-rian, M., and Babiker, M.: The MIT Emissions Prediction and Policy Analysis (EPPA) Model: Version 4, Joint Program Report Series (August), 2005.
Ramaswamy, V., Boucher, O., Haigh, J., et al.: Chapter 6. Radiative Forcing of Climate Change, 20
IPCC Third Assessment Report: Climate Change 2001: Working Group I: The Scientific Basis, edited by: Houghton, J. T., Ding, Y., Griggs, D. J., et al., Cambridge Univ. Press, UK, 353 pp., 2001.
Ramanathan, V. and Carmichael, G.: Global and regional climate change due to black carbon, Naturegeoscience, 1, 221–227, 2008.
25
Ramanathan, V., Chung, C., Kim, D., Bettge, T., Buja, L., Kiehl, J. T., Washington, W. M., Fu, Q., Sikka, D. R., and Wild, M.: Atmospheric brown clouds: Impacts on South Asian Climate and hydrological cycle, P. Natl. Acad. Sci. USA, 102(15), 5326–5333, 2005.
Roeckner, E., Stier, P., Feichter, J., Kloster, S., Esch, M., and Fischer-Bruns, I.: Impact of carbonaceous aerosol emissions on regional climate change, Climate Dynam., 27, 553–571, 30
doi:10.1007/s00382-006-0147-3, 2006.
ACPD
10, 9431–9462, 2010Climate effects of seasonally varying
biomass burning
G.-R. Jeong and C. Wang
Title Page
Abstract Introduction
Conclusions References
Tables Figures
◭ ◮
◭ ◮
Back Close
Full Screen / Esc
Printer-friendly Version
Interactive Discussion
1309–1313, doi:10.1126/science.1160606, 2008.
Rosenfeld, D.: TRMM Observed First Direct Evidence of Smoke from Forest Fires Inhibiting Rainfall, Geophys. Res. Lett., 26(20), 3105–3108, 1999.
Rotstayn L. D. and Lohmann, U.: Tropical Rainfall Trends and the Indirect Aerosol Effect, J. Climate, 15, 2103–2116, 2002.
5
Wang, C.: A modeling study on the climate impacts of black carbon aerosols, J. Geophys. Res., 109, D03106, doi:10.1029/2003JD004084, 2004.
Wang, C.: Impact of direct radiative forcing of black carbon aerosols on tropical convective precipitation, Geophys. Res. Lett., 34, L05709, doi:10.1029/2006GL 028416, 2007.
Zhang, M. H., Lin, W. Y., Klein, S. A., Bacmeister, J. T., Bony, S., Cederwall, R. T., Del Genio, A. 10
ACPD
10, 9431–9462, 2010Climate effects of seasonally varying
biomass burning
G.-R. Jeong and C. Wang
Title Page
Abstract Introduction
Conclusions References
Tables Figures
◭ ◮
◭ ◮
Back Close
Full Screen / Esc
Printer-friendly Version
Interactive Discussion
Table 1.The values of DRF in seasonal emissions and the differences in DRF due to seasonal
BBCA emissions (offline runs).
MAM JJA SON DJF Ann
Values of DRF TOA all −0.237 −0.176 −0.122 0.101 −0.109
in seasonal BBCA emission Surface all −1.557 −2.445 −1.880 −1.960 −1.961
(W/m2) Atmosphere all 1.320 2.269 1.758 2.061 1.852 Fractional changes in DRF TOA all 464.5 0.5 196.7 −729.7 58.3 relative to in non-seasonal Surface all −19.9 7.2 −5.9 21.3 0.0 Emission (%) Atmosphere all −30.6 7.8 −10.2 28.9 −2.1 Values of DRF TOA clear −0.842 −1.138 −0.862 −0.599 −0.861
in seasonal BBCA emission Surface clear −2.093 −3.270 −2.508 −2.589 −2.615
(W/m2) Atmosphere clear 1.250 2.132 1.646 1.990 1.754 Fractional changes in DRF TOA clear 5.7 1.3 2.6 −9.2 −0.5
relative to in non-seasonal Surface clear −18.9 6.1 −5.8 18.7 1.2
ACPD
10, 9431–9462, 2010Climate effects of seasonally varying
biomass burning
G.-R. Jeong and C. Wang
Title Page
Abstract Introduction
Conclusions References
Tables Figures
◭ ◮
◭ ◮
Back Close
Full Screen / Esc
Printer-friendly Version
Interactive Discussion
Table 2.The values of DRF in seasonal emissions and the differences in DRF due to seasonal
BBCA emissions (online runs).
MAM JJA SON DJF Ann
Values of DRF TOA all −0.647 −0.102 −0.113 −0.104 −0.241
in seasonal BBCA emission Surface all −1.733 −1.867 −1.491 −1.804 −1.724
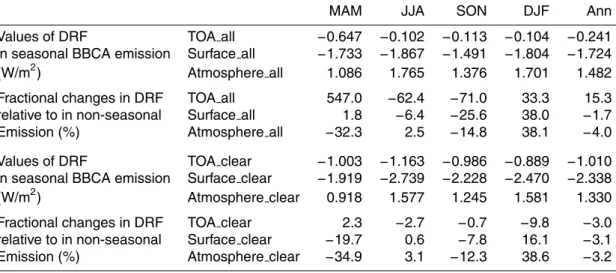
(W/m2) Atmosphere all 1.086 1.765 1.376 1.701 1.482 Fractional changes in DRF TOA all 547.0 −62.4 −71.0 33.3 15.3 relative to in non-seasonal Surface all 1.8 −6.4 −25.6 38.0 −1.7 Emission (%) Atmosphere all −32.3 2.5 −14.8 38.1 −4.0 Values of DRF TOA clear −1.003 −1.163 −0.986 −0.889 −1.010
in seasonal BBCA emission Surface clear −1.919 −2.739 −2.228 −2.470 −2.338
(W/m2) Atmosphere clear 0.918 1.577 1.245 1.581 1.330 Fractional changes in DRF TOA clear 2.3 −2.7 −0.7 −9.8 −3.0
relative to in non-seasonal Surface clear −19.7 0.6 −7.8 16.1 −3.1
ACPD
10, 9431–9462, 2010Climate effects of seasonally varying
biomass burning
G.-R. Jeong and C. Wang
Title Page
Abstract Introduction
Conclusions References
Tables Figures
◭ ◮
◭ ◮
Back Close
Full Screen / Esc
Printer-friendly Version
Interactive Discussion
(a) (b)
(c) (d)
(e) (f)
(g) (h)
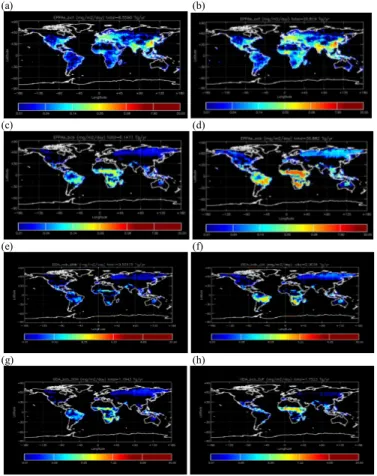
Fig. 1. The global distribution of annual emissions of fossil fuel(a)BC and(b)OC. The global
ACPD
10, 9431–9462, 2010Climate effects of seasonally varying
biomass burning
G.-R. Jeong and C. Wang
Title Page
Abstract Introduction
Conclusions References
Tables Figures
◭ ◮
◭ ◮
Back Close
Full Screen / Esc
Printer-friendly Version
Interactive Discussion
Fig. 2. The differences in DRF at TOA due to the seasonality of BBCA emissions (W/m2) in
ACPD
10, 9431–9462, 2010Climate effects of seasonally varying
biomass burning
G.-R. Jeong and C. Wang
Title Page
Abstract Introduction
Conclusions References
Tables Figures
◭ ◮
◭ ◮
Back Close
Full Screen / Esc
Printer-friendly Version
Interactive Discussion
Fig. 3.The global distributions of differences in annual column loading (g/km2) due to seasonal
ACPD
10, 9431–9462, 2010Climate effects of seasonally varying
biomass burning
G.-R. Jeong and C. Wang
Title Page
Abstract Introduction
Conclusions References
Tables Figures
◭ ◮
◭ ◮
Back Close
Full Screen / Esc
Printer-friendly Version
Interactive Discussion
Fig. 4. The differences in annual and seasonal mean aerosol mass budget (Gg/yr) due to
scavenging of external mixtures of BC and OC(a, b)and aging of internal mixtures of MBS and
ACPD
10, 9431–9462, 2010Climate effects of seasonally varying
biomass burning
G.-R. Jeong and C. Wang
Title Page
Abstract Introduction
Conclusions References
Tables Figures
◭ ◮
◭ ◮
Back Close
Full Screen / Esc
Printer-friendly Version
Interactive Discussion
(a) (b)
(c) (d)
Fig. 5.The Hovm ¨oller diagram of zonal monthly means of differences in column loading (g/km2)
ACPD
10, 9431–9462, 2010Climate effects of seasonally varying
biomass burning
G.-R. Jeong and C. Wang
Title Page
Abstract Introduction
Conclusions References
Tables Figures
◭ ◮
◭ ◮
Back Close
Full Screen / Esc
Printer-friendly Version
Interactive Discussion (a) (b)
(c) (d)
(e) (f)
Fig. 6. The comparison of the global distribution of the differences in the annual DRF (W/m2)
ACPD
10, 9431–9462, 2010Climate effects of seasonally varying
biomass burning
G.-R. Jeong and C. Wang
Title Page
Abstract Introduction
Conclusions References
Tables Figures
◭ ◮
◭ ◮
Back Close
Full Screen / Esc
Printer-friendly Version
Interactive Discussion
(a) (b)
(c) (d)
(e) (f)
Fig. 7.The Hovm ¨oller diagrams of zonal and monthly means of the differences in DRF (W/m2)
ACPD
10, 9431–9462, 2010Climate effects of seasonally varying
biomass burning
G.-R. Jeong and C. Wang
Title Page
Abstract Introduction
Conclusions References
Tables Figures
◭ ◮
◭ ◮
Back Close
Full Screen / Esc
Printer-friendly Version
Interactive Discussion
(a) (b)
(c) (d)
Fig. 8. The global distribution of annual mean of differences in cloud distributions due to
ACPD
10, 9431–9462, 2010Climate effects of seasonally varying
biomass burning
G.-R. Jeong and C. Wang
Title Page
Abstract Introduction
Conclusions References
Tables Figures
◭ ◮
◭ ◮
Back Close
Full Screen / Esc
Printer-friendly Version
Interactive Discussion
(a) (b)
(c) (d)
Fig. 9.The global distribution of annual mean of fractional differences in cloud distributions due
ACPD
10, 9431–9462, 2010Climate effects of seasonally varying
biomass burning
G.-R. Jeong and C. Wang
Title Page
Abstract Introduction
Conclusions References
Tables Figures
◭ ◮
◭ ◮
Back Close
Full Screen / Esc
Printer-friendly Version
Interactive Discussion
(a) (b)
(c) (d)
Fig. 10. The Hovm ¨oller diagram of zonal monthly means of the differences in (a) surface
ACPD
10, 9431–9462, 2010Climate effects of seasonally varying
biomass burning
G.-R. Jeong and C. Wang
Title Page
Abstract Introduction
Conclusions References
Tables Figures
◭ ◮
◭ ◮
Back Close
Full Screen / Esc
Printer-friendly Version
Interactive Discussion
(a) (b)
Fig. 11. The vertical cross section of zonal and annual means of the differences in(a) solar
ACPD
10, 9431–9462, 2010Climate effects of seasonally varying
biomass burning
G.-R. Jeong and C. Wang
Title Page
Abstract Introduction
Conclusions References
Tables Figures
◭ ◮
◭ ◮
Back Close
Full Screen / Esc
Printer-friendly Version
Interactive Discussion
(a) (b)
(g) (h)
Fig. 12. The global distribution of annual mean of differences in precipitation due to seasonal BBCA emissions
(a)convective precipitation (PRECC)(b)large scale precipitation (PRECL). The seasonal zonal mean average of the
differences in PRECC (read line) and PRECL (blue line) due to seasonal BBCA emissions in(c)DJF,(d)MAM,(e)
JJA, and(f)SON. Also shown are the Hovm ¨oller diagrams of zonal monthly means of the differences in precipitation