www.biogeosciences.net/6/2355/2009/
© Author(s) 2009. This work is distributed under the Creative Commons Attribution 3.0 License.
Biogeosciences
The consumption of atmospheric methane by soil in a simulated
future climate
C. L. Curry
Canadian Centre for Climate Modelling and Analysis, Climate Research Division, Environment Canada, Victoria, BC, Canada Received: 15 May 2009 – Published in Biogeosciences Discuss.: 23 June 2009
Revised: 23 September 2009 – Accepted: 26 September 2009 – Published: 2 November 2009
Abstract. A recently developed model for the consumption of atmospheric methane by soil (Curry, 2007) is used to in-vestigate the global magnitude and distribution of methane uptake in a simulated future climate. In addition to solving the one-dimensional diffusion-reaction equation, the model includes a parameterization of biological CH4oxidation that is sensitive to soil temperature and moisture content, along with specified reduction factors for land cultivation and wet-land fractional coverage. Under the SRES emission sce-nario A1B, the model projects an 8% increase in the global annual mean CH4soil sink by 2100, over and above the 15% increase expected from increased CH4 concentration alone. While the largest absolute increases occur in cool temper-ate and subtropical forest ecosystems, the largest relative in-creases in consumption (>40%) are seen in the boreal for-est, tundra and polar desert environments of the high north-ern latitudes. Methane uptake at mid- to high northnorth-ern lati-tudes increases year-round in 2100, with a 68% increase over present-day values in June. This increase is primarily due to enhanced soil diffusivity resulting from lower soil moisture produced by increased evaporation and reduced snow cover. At lower latitudes, uptake is enhanced mainly by elevated soil temperatures and/or reduced soil moisture stress, with the dominant influence determined by the local climate.
1 Introduction
Significant changes in the atmospheric concentrations of long-lived greenhouse gases (GHGs) have accompanied large-scale climate change over the Holocene, including the global warming of recent decades. The influence of climate change on the budgets of GHGs is thus a topic of great
in-Correspondence to:C. L. Curry ([email protected])
terest, and one that is beginning to be addressed by mod-els of biogeochemical cycles at the global scale (Denman et al., 2007). This paper focuses on the uptake of methane by soils, a process that represents a small but important sink of atmospheric CH4 at the global scale, accounting for ap-proximately 5% of the total. According to a recent meta-analysis of 318 annual estimates of uptake in wide range of ecosystems (Dutaur and Verchot, 2007), the total annual CH4 uptake ranges from 12–59 Tg CH4y−1, with a narrower esti-mate of 22±12 Tg CH4y−1if the measurements are stratified by climatic zone, ecosystem, and soil texture.
Uptake of methane in soil occurs via oxidation by special-ized aerobic bacteria – methanotrophs – several varieties of which have been identified (Hanson and Hanson, 1996), but the precise physiology of which is still not well understood (Roslev et al., 1997; Knief et al., 2003; Horz et al., 2005). Curry (2007) (hereafter Paper I), presented a physical param-eterization of soil CH4uptake, building on the prior work of Ridgwell et al. (1999) (hereafter R99), in which the diffu-sion coefficientDsoil and rate of biological oxidationk are the primary variables. Each of these variables is expressed as the product of several factors sensitive to local, time-dependent, environmental conditions. Free parameters of the scheme were calibrated using multi-year field measurements, and offline simulations driven with observed reanalysis cli-mate data. The simulated magnitude (28.0 Tg CH4y−1in the global and annual mean) and seasonality of CH4uptake were shown to behave in a physically reasonable manner at several sites with widely varying climate and soil texture.
enhance methanotrophic activity, except where reduced soil water availability leads to moisture stress. Thus, uncertainty remains regarding the competing influences of increased soil diffusivity and reduced soil water availability over much of the tropics and mid-latitudes in a warmer world. Field studies have shown that consumption may either increase or decrease depending upon moisture availability and clade-specific bi-ology (Schnell and King, 1996; Torn and Harte, 1996; Horz et al., 2005). The present work highlights the importance of future changes in winter snowfall and snow cover in the Northern Hemisphere, through associated changes in soil moisture, diffusivity, and CH4uptake over the remainder of the year.
This paper estimates the soil sink strength of CH4in both the present and future climates by driving the model of Pa-per I with surface forcing from an AGCM coupled to a slab ocean. In the following section, I review the parameteriza-tion of methane uptake, and in Sect. 3 describe the method-ology of the time-slice experiments. Simulated methane up-take in the present climate is then discussed in Sect. 4, while Sect. 5 presents results for simulated future (and preindus-trial) climate. In the final section, the results obtained here are compared with those predicted from simpler soil methane consumption schemes, and concluding remarks offered on directions for future progress.
2 Model overview
Following Paper I, soil methane uptake at the surface, J, is obtained from the first integral of the one-dimensional diffusion-reaction equation, which after some manipulation takes the simple form
J=g0CCH4rCrW(Dsoilk0rTrSM)1/2, (1)
where
J: surface flux (uptake) in mg CH4m−2d−1; g0=586.7 mg CH4ppmv−1s d−1m−2cm−1,
conversion factor from mixing ratio to concentration; CCH4: CH4mixing ratio at the surface (ppmv);
k0: first-order oxidation rate constant, =5.0×10⁻⁵s−1, deter-mined from calibration with field data (Paper I);
rC,rW: dimensionless factors (0−1.0) for inhibition of
uptake in cultivated soils and wetland areas, respectively (spatial maps ofrC andrW are available as online auxiliary
material of Paper I);
rT: dimensionless soil temperature factor (0−4.1),
increasing for−10≤Tsoil≤27.5◦C, and decreasing for Tsoil>27.5◦C;
rSM: dimensionless factor (0−1.0) for inhibition of uptake due to sub-optimal soil moisture.rSMis assumed to be opti-mal (=1) for soil water matric potentialψ <0.2 MPa, and de-creases smoothly to zero asψincreases to 100 MPa, above whichrSM=0. The exact forms ofrT andrSMmay be found in Paper I.
The diffusion coefficient of methane in soil,Dsoil, is given by
Dsoil=0.196(1.0+0.0055Tsoil)84/3
8air
8
1.5+3/b
cm2s−1, (2) where
8: total porosity (cm3cm−3),
8air: air-filled porosity (cm3cm−3)=8−θ, θ=θw+θi,
θw: fractional water content,
θi: fractional ice content,
b=15.9fclay+2.91,fclay: fraction of clay.
All quantities are two-dimensional, depth-averaged fields over the top 10 cm soil layer. Note that bothDsoil andrSM depend on soil moisture, but in roughly opposite ways. The dependence ofJon the square root ofDsoilandk≡k0rTrSM, as opposed to the linear dependence assumed by R99 and others, has recently received support from field and labora-tory studies (von Fischer et al., 2009).
3 Methodology and simulations
The methane consumption algorithm was incorporated into the Canadian Centre for Climate Modelling and Analysis (CCCma) third generation atmospheric GCM (AGCM3), an improved version of the model described in McFarlane et al. (1992). AGCM3 represents the horizontal structure of the main prognostic variables using a spectral representation, with T63 truncation in the present application and a cor-responding gaussian physics grid of 2.8◦×2.8◦. There are
31 sigma-hybrid vertical levels between 995 mb and 1 mb. Further description of this model version may be found in Scinocca et al. (2009).
The CH4uptake subroutine was implemented in CLASS (Canadian LAnd Surface Scheme) v2.7, the land scheme cur-rently used in AGCM3 (Verseghy, 1991, 1996), which runs at a 15-min time step. The uptake calculation is performed only in the top (0–10 cm) soil layer of CLASS, since measured ox-idation rates are usually small below this depth. Within this top soil layer,Dsoilandkare assumed to be vertically homo-geneous, although they do vary in the horizontal (i.e., from one grid cell to the next).
Three time-slice simulations were performed with this model configuration (see Table 3 for GHG concentrations used in each experiment): (1) a 40-year equilibrium run using present-day (ca. 1994) GHG concentrations; (2) a 40-year equilibrium run using GHG concentrations from the SRES A1B (ISAM reference) scenario at 2100, with CFC concentrations from the WMO98 Scenario A1; and (3) a 40-year equilibrium run using preindustrial (ca. 1850) GHG concentrations. The simulations were started from the end states of previously archived runs at CCCma for 1×CO2 ([CO2]=348 ppmv) and 2×CO2([CO2]=696 ppmv) equilib-rium climates. All other features of the model, in particular, the land cover including the cultivated fraction in each grid cell, were held fixed at their present-day distributions. Soil CH4 uptake is assumed to be zero over areas of permanent water, ice, and desert.
After an adjustment period of 5–10 years after the start of each simulation (caused by the slight change in GHG con-centrations), the top soil layer temperature equilibriates to the new climate. Analysis was conducted on averages of the last 20 years of each simulation.
4 Methane uptake in the simulated present-day climate
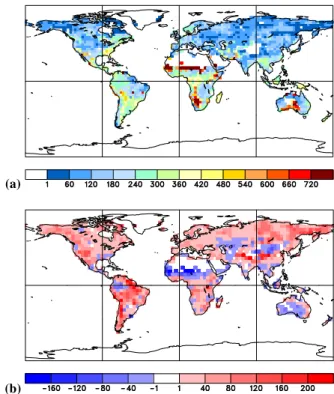
The characteristics of methane uptake in the present-day, model-simulated climate were examined first. A spatial map of the annual mean uptake is shown in Fig. 1a. As in Paper I, the regions of largest uptake are in South America, sub-Saharan and far southern Africa, and south-central Australia. Some of the highest uptake cells border large deserts, where spatial variability is high due to the low soil moisture thresh-old effect ofrSM(Sect. 4.2 of Paper I).
Figure 1a may be compared with the results of Paper I (Fig. 6a, on the same colour scale), in which CLASS was forced with reanalysis data from the 21-year (1979–1999) Global Land Surface Dataset (GOLD) of Dirmeyer and Tan (2001), hereafter referred to as the “GOLD” run. The differ-ence between the two simulations, after averaging the model map onto the coarser resolution of the GOLD run, is shown in Fig. 1b. The spatial pattern of uptake is quite similar in the two cases, although the global total of 24.8 Tg CH4y−1 derived from the GCM climate is 11% smaller than the 28.0 Tg CH4y−1 found using the GOLD forcing. The most notable regional difference is the generally larger uptake over South America in the GOLD run, although differences of comparable size and the same sign are also seen in eastern Russia, southern China/Himalayas and western North Amer-ica. Conversely, the coupled model simulates notably larger uptake than in the GOLD run over sub-Saharan Africa, Mon-golia, western Amazonia, and much of Australia. In relative terms, the discrepancy is largest at northern high latitudes, where at some grid points the uptake is over 80% larger un-der the reanalysis forcing; however, CH4consumption is typ-ically quite low in these regions to begin with.
(a)
(b)
Fig. 1. (a)Global distribution of 20-year annual mean CH4
up-take. Units are mg CH4m−2y−1. The globally integrated uptake is
24.8 Tg CH4y−1. (b)Difference of 21-year annual mean CH4
up-take with GOLD forcing minus 20-year annual mean CH4uptake
from the model.
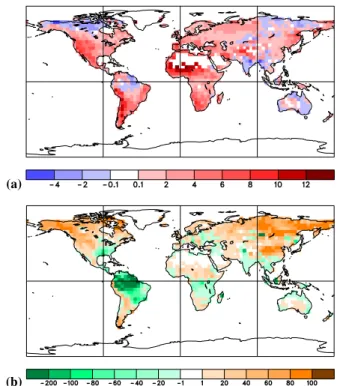
There are two principal causes of the positive anomalies seen in Fig. 1b. First, as shown in Fig. 2a, the top soil layer temperature in the GOLD run is generally larger (by +2.5◦C, in the global mean) than in the coupled model sim-ulation. The largest differences are seen in western North and South America, sub-Saharan Africa, and the western Hi-malayas. Comparison of the annual mean GOLD 2-m sur-face air temperature with ERA-40 (the European Centre for Medium-Range Weather Forecasts second extended reanal-ysis product) data (not shown) over the same period (1979– 1999) reveals a similarly distributed pattern of temperature bias in the GOLD reanalysis. The discrepancy is largest in arid and high elevation (>∼2000 m) regions, where the tem-perature difference is of magnitude 4–20◦C. Particularly
no-table is a 8–12◦C bias over the western two-thirds of the
(a)
(b)
Fig. 2.Difference (GOLD minus coupled model) of 20-year annual
mean:(a)top soil layer temperature,Tsoil, in degrees;(b)
diffusiv-ity,Dsoil, in percent.
One sees less of a difference between the ERA-40 and cou-pled model surface air temperatures (not shown), with the anomalies confined to the range±2◦C over most land areas,
except in western North America and Asia north of∼45◦N,
where the ERA-40 values are systematically larger by 2–6◦C at most locations. The global mean difference (ERA-40 mi-nus model, land only) is +1.2◦C. While the sum of these global mean differences (ERA-40 minus model plus GOLD minus ERA-40) is still smaller than theTsoil difference be-tween the GOLD and coupled runs (+2.5◦C), there is a good correspondence between the air and soil temperature differ-ence patterns over all regions south of∼30◦N. The larger magnitude of the soil temperature difference is consistent with the higher specific heat of soil, especially when moist, compared to air.
From the above results I infer the following. First, due to a high surface temperature bias (GOLD minus ERA-40) in the data used to drive the offline CH4 uptake scheme, it is likely that CH4 uptake in the extratropics was overesti-mated in Paper I. Second, due to a low surface tempera-ture bias (model minus ERA-40) in the northern extratrop-ical land areas compared to observations, it is likely that CH4 uptake in these regions is underestimated by the ver-sion of the coupled GCM used in this study. Thus, treating these biases as roughly equal but opposite in sign, I adopt a range of 24.8–28.0 Tg CH4y−1as a reasonable annual mean estimate for the present-day globally integrated CH4
con-sumption. Including the uncertainty in the base oxidation rate constantk0as outlined in Paper I, this translates into a (2σ) range ofJ=8−47 Tg CH4y−1. This range of estimates compares well with the observational constraints of Dutaur and Verchot (2007) mentioned in the Introduction – i.e., 12– 59 Tg CH4y−1, with a best estimate of 22±12 Tg CH4y−1. While the level of disagreement between the GOLD and ERA-40 air temperatures is disconcerting, and suggests re-placing the former by the latter in future offline runs, it does not impact the goal of the present study: namely, to simulate the difference between present and future climate (including air and soil temperatures), and CH4uptake derived from the latter, using the coupled model.
The temperature biases just described translate into dif-ferences in the methane uptake pattern seen in Fig. 1b in the following manner. While the largerTsoilof the GOLD run en-hances uptake in most of North and South America and much of Asia, it reducesJ in sub-Saharan Africa. There, temper-atures in the GOLD run frequently exceed 27.5◦C, whererT
attains its maximum value, leading to extensive regions of negativerT change (not shown). Central and southern
Aus-tralia is another large area over whichrT decreases, but here
a coincident decrease inTsoil is seen (Fig. 2a). More gen-erally, it is the more modest elevated soil temperatures (0 to +4◦C) over the central continental regions in the GOLD run that are responsible for the bulk of the global methane uptake discrepancy due to differing soil temperatures.
A second contribution to the discrepancy inJ comes from differences in the diffusion coefficient, Dsoil, as shown in Fig. 2b. SinceDsoilhas only a weak temperature dependence (Eq. 2), these differences are attributable to significantly dif-ferent air-filled porosity, and thus fractional water content,θ, in the two simulations. The spatial pattern of theDsoil dif-ference clearly mirrors that ofJ at high northern latitudes, where differences inJ between the GOLD and coupled runs are largest in relative (but not absolute) terms. By contrast, Tsoil is biased negative in the GOLD reanalysis over more than half the land area at these latitudes, implying that the larger uptake in the offline calculation is not temperature-related. In these regions, the magnitude of theDsoil differ-ence indicates thatθ is approximately 50% smaller in the GOLD run.
TheDsoildifferences south of∼30◦N are well-correlated with the annual mean precipitation difference between the two runs (not shown). Over much of South America, equato-rial Africa, and Australia, the soil is drier in the model simu-lation than in the GOLD run, leading to a larger modelDsoil. The model has slightly more precipitation than the reanalysis over most of the northern extratropics, and also less evapora-tion, consistent with the lower modelDsoilthere. The large relative differences seen inDsoilare, however, mostly due to differences in snow cover between the model and reanalysis data. Due to the low intrinsic diffusivities at high latitudes,
and, therefore, on methane uptake (see ff. Sect. 5.1.4). Com-parison of Figs. 1b and 2b suggests that despite larger diffu-sivities in the coupled model in the tropics (where over two-thirds of the global annual uptake occurs in the GOLD run; Fig. 6a of Paper I), the discrepancy in CH4uptake is domi-nated by the soil temperature bias, since the meanJover the tropics remains larger in the GOLD-forced simulation.
Finally, although model validation was carried out in Paper I, some differences between the modelled and ob-served range of soil methane uptake over different biomes are worth noting. Table 2 summarizes the distribution of up-take over ecosystem type, as represented in the aggregated Holdridge life zone classification (AHLZ; Paper I). Unfor-tunately, this classification differs from the Leemans (1990) biozone scheme used by Dutaur and Verchot (2007), the most complete summary of observations to date, so direct com-parisons are not possible. However, one of the most evi-dent distinctions seen in the data is that between uptake in forest versus forest soils. The ratio of forest to non-forest soil CH4 uptake per unit area in the model is 1.6, compared to 2.4 in the observations, while the corresponding area-weighted ratios are 2.3 (model) and 1.7 (observations). Differing coverage by forests (57% of the total land area in AHLZ versus 39% in the Leemans scheme) may explain much of the difference between the last two ratios. However, it does seem likely that the model underestimates this ratio, in areal terms, compared to observations. Further, the mod-elled areal uptake in tropical forests exceeds that in temperate forests, the reverse of what is found for observational mean values. However, the variance of observed uptake in temper-ate forests (N=92) is a factor of 6.5 larger than in tropical forests (N=62), implying that mean values may poorly char-acterize the true distribution.
5 Methane uptake in a simulated future climate
5.1 Annual mean results
In the simulated future climate, CH4 consumption is ex-pected to increase linearly with surface concentrationCCH4, according to Eq. (1). Thus, in the absence of other changes, the globally uniform increase of CCH4 from 1.720 ppmv to 1.974 ppmv under the SRES A1B concentration sce-nario (0.254 ppmv or 15%) would lead to an increase in global uptake of the same magnitude, i.e. an increase of 3.72 Tg CH4y−1 over the present day simulated value of 24.8 Tg CH4y−1. In fact, the globally integrated uptake in the future run is 30.4 Tg CH4y−1, 23% higher than the present day value. Since this study focuses on the effects of climate change on the character of CH4uptake independent of the increase due to elevated concentration alone, the effect of the latter is removed in the analysis that follows, except when citing absolute uptake values in the future climate.
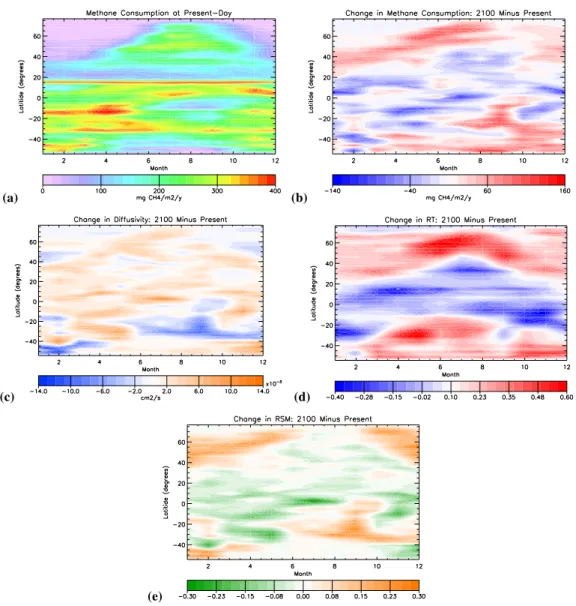
A spatial map of the 20-year annual mean difference in uptake between 2100 and present-day, with the concentration effect removed, is shown in Fig. 3. The relative change in uptake, 1J /J=[J (2100)/J (1994)−1]×100% (Fig. 3b), is less than±20% over most of the Southern Hemisphere (SH) land areas and the Northern Hemisphere (NH) tropics (0– 30◦N), with the exception of the east coast of S. America from 15◦S to 15◦N, N. Africa, and western Mexico, where decreases of 20–50% are seen. With the exception of two adjacent grid cells in Somalia and Kenya (see ff. Sect. 5.1.3), large relative increases inJ(>40%) are seen only in the NH extratropics, and exceed +120% in many areas, mostly in the Arctic. The global mean change inJ, with the concentration effect removed, is +7.5%.
Changes in the annual meanJ are due to both increased surface heating in the future climate, which affects both sub-surface temperature and soil moisture (through evapo-ration), and to differences in future precipitation patterns and amount, which affectDsoil(recall that the model land cover in 2100 remains unchanged from present-day). Figure 4a–c show the corresponding difference patterns forrT, rSM and
Dsoil. While certain similarities in patterns can be detected between Figs. 3 and 4, interannual variability of many of the fields can make attribution difficult. The contribution of the relative changes in 1Dsoil,1rT, and1rSM to1J at each grid cell can be derived directly from Eq. (1):
1J
J =
D∗
soil Dsoil
r∗ T
rT
rSM∗ rSM
1/2
−1 (3)
≈1
2
1Dsoil
Dsoil
+1rT
rT
+1rSM
rSM
, (4)
where the superscript “∗” indicates the value in 2100 (i.e., D∗soil=Dsoil+1Dsoil,..., etc.) and the second relation holds if all the1’s are small compared to present day (a good ap-proximation over 40◦S–40◦N). Hence, each of these agents
contributes to1J /J in the same proportion; it remains only to assess the relative changes in the fields themselves over the region of interest. The zonally averaged results of this comparison are shown in Fig. 5. Note that due to the larger magnitude of the changes at high northern latitudes, a differ-ent vertical scale has been used for 40–75◦N.
In order to better understand the space-time correlation between 1J /J and each of the three predictor fields, as well as amongst the predictor fields themselves, a regression analysis was also performed using the individual monthly mean output from which the 20-year mean fields were con-structed. The Pearson (linear) correlation coefficientr was calculated from 240 individual monthly grids of each rela-tive difference field (i.e.,1J /J versus1Dsoil/Dsoil, 1J /J versus1rT/rT,..., etc.), over separate bands of latitude as
(a)
(b)
Fig. 3. Difference (2100 minus present-day) of 20-year annual
mean CH4uptake, with the effect of the uniform concentration
in-crease removed: (a)absolute values in mg CH4m−2y−1;(b)
ex-pressed as a percent.
Table 1 should be consulted as the role of each of these con-tributors is considered in turn.
5.1.1 Soil temperature
The mean increase in Tsoil from the present to 2100 is 3.5±1.4◦C, and the geographical pattern (not shown) resem-bles previously published results, particularly with respect to the marked warming asymmetry at northern high latitudes (Hegerl et al., 2007). This1Tsoilleads to changes in the fac-torrT that generally resemble1Tsoil, except in the tropics
where1rT<0, as shown in Fig. 4a. There, temperatures
fre-quently exceed 27.5◦C, above which rT starts to decrease,
leading to extensive regions of negative1rT in South
Amer-ica, sub-Saharan AfrAmer-ica, and northern Australia. The contri-bution of1rT/rT to1J /Jranks second to that of diffusivity
at most latitudes, although it exceeds1Dsoil/Dsoilbetween 20–40◦S and 35–55◦N (Fig. 5 and Table 1). In general,
1rT/rT and 1Dsoil/Dsoil are weakly correlated, with the closest correspondence in the mid-latitudes, where increases inTsoil lead to soil drying and higher air-filled porosity and diffusivity. 1rT/rT and1rSM/rSM are anti-correlated over southern mid-latitudes, indicating increased moisture stress under warming, but are only weakly correlated elsewhere, sincerSMdepends more directly upon soil water content, and thus diffusivity, thanTsoil(see Sect. 5.1.3).
(a)
(b)
(c)
(d)
Fig. 4.Relative change (2100 minus present-day, in percent) of
Table 1. Linear (Pearson) correlation coefficients of indicated monthly mean fields.
1Dsoil 1rT 1rSM
60–90◦N
1J 0.686 0.392 −0.076
1Dsoil 0.152 −0.332
1rT 0.127
30–60◦N
1J 0.144 0.161 0.175
1Dsoil 0.205 −0.646
1rT −0.107
0–30◦N
1J −0.122 0.215 0.355
1Dsoil −0.146 −0.911
1rT 0.142
30–0◦S
1J −0.207 0.207 0.408
1Dsoil −0.099 −0.932
1rT 0.094
60–30◦S
1J 0.042 −0.028 0.226
1Dsoil 0.240 −0.916
1rT −0.293
Global
1J 0.514 0.201 0.250
1Dsoil 0.043 −0.755
1rT 0.020
5.1.2 Precipitation, evaporation, and soil moisture
According to the Clausius-Clapeyron relation, higher spe-cific humidity in a warmer atmosphere should lead to in-creased poleward moisture transport and hence inin-creased precipitation at high latitudes. This increase is seen in our simulations nearly everywhere north of 45◦C in the future climate, with a more mixed difference pattern in the trop-ics and subtroptrop-ics (not shown). The global, land-only, pre-cipitation change in future is1P=+56 mm y−1(+6%). In-creases in evaporation are seen on every continent, and while these are generally of smaller magnitude than the precipita-tion changes (1E=+39 mm y−1) – i.e.,1(P−E)is positive – globally1E/E exceeds 1P /P by∼1%. In the global mean, the net effect of these atmospheric moisture changes on the upper soil layer moistureθw is not significant; i.e.,
1θw=−3.6×10⁻³. However, the regional variation of1θw
(roughly complementary to that ofDsoil; see Fig. 4c) has an important influence on two of the principal determinants of the CH4soil uptake: namely, the soil moisture stress factor rSMand the diffusivityDsoil.
−60 −50 −40 −30 −20 −10 0 10 20 30 40 −0.2
−0.1 0 0.1 0.2 0.3 0.4 0.5 0.6 0.7 0.8
Latitude (degrees N)
Relative change
D
soil
rT
rSM
J0
40 50 60 70 −0.5
0 0.5 1 1.5 2 2.5 3 3.5 4
Latitude (degrees N)
Fig. 5. Relative change (2100 minus present day) of the indicated 20-year annual mean fields as a function of latitude. Note that due to the larger magnitude of the changes at high northern latitudes, a
different vertical scale is used for 40–75◦N.
5.1.3 Soil moisture stress
As shown in Fig. 4b,rSMincreases nearly everywhere north of 45◦ C in the future climate, except in western Europe (whereP−Edecreases) and western North America (where P−Eincreases but runoff to the Pacific Ocean is large). The strongest increases are seen over western Asia and the Great Plains of North America, where present day values ofrSMare well below the global mean. Even a modest increase in soil water content over these areas, as seen in Fig. 4b, can lead to a large relative increase inrSM. Indeed, even in regions where the annual mean soil moistureθw decreases in future
(such as eastern Europe), rSM can still increase, as long as θw increases in the drier months. This is due to the
insen-sitivity ofrSM toθw at largeθw (Eqs. 8 and 9 in Paper I).
In this regime, methane uptake is limited by diffusivity, not rSM, and hence the pattern ofrSM more closely resembles that ofP, notθw. Thus, despite the strong and widespread
increase ofrSM seen in Fig. 4b, the correlation ofrSM with J is generally weak at northern latitudes. This is due to sim-ilarly distributed decreases inDsoil (see below), which limit the overallJincrease.
Substantial decreases in rSM are seen south of ∼30◦N, with the largest regional decreases (20–60%) seen on the east coast of S. America from 15◦S to 15◦N, N. Africa and the Middle East, and western Mexico. These are also areas of strongly decreased methane consumption in future (Fig. 3). Positive correlations of1rSM with1J are seen at latitudes south of∼30◦N (Table 1), suggesting that decreased water
availability is largely responsible for the reduced or weakly enhanced methane uptake in these regions. Two-dimensional correlation maps (not shown) show that only in Amazonia is the influence of temperature (1rT<0) comparable to that
regions (Fig. 4b). In locations whererSMis particularly low in the present climate (e.g., at the two adjacent grid cells in Somalia and Kenya previously noted in Sect. 5.1), large rel-ative increases inrSMand, consequently,Joccur.
Generally speaking, decreasing precipitation in future in the tropics leads to decreased soil water, which lowersrSM. Where decreases in rSM are largest, methane uptake de-creases. However, the total area of regions with1rSM<0 is larger than that with1J <0, indicating that changes in tem-perature and diffusivity can still lead to an increase in future uptake. Table 1 shows that1rSM and1Dsoil are strongly anti-correlated at nearly all latitudes, with the tightest rela-tion holding between 60◦S and 30◦N. This reflects the dom-inant dependence of both factors onθw. As seen in Fig. 5,
soil temperature and diffusivity are the dominant controls on methane uptake at high latitudes, and even substantial changes inrSMhave little impact.
5.1.4 Diffusivity and snow cover
The pattern of future diffusivity change, shown in Fig. 4c, is the complement of the change in soil moisture,θw,
men-tioned above. Dsoil increases more or less uniformly across Europe, the United States, and South America, with more heterogeneous changes seen elsewhere. The global and an-nual mean change in Dsoil is+5.1%, despite the fact that 1(P−E)>0, implying that soil moisture vertical transport and storage play an important role. In particular, the posi-tive sign of1Dsoil cannot be taken as simply an indication of increased evaporation in a warmer climate, independent of other factors. Figure 5 and Table 1 show that1Dsoil and 1Jare anti-correlated in the equatorial band, coincident with positively correlated1rSM, due to the anomalous drying of the soil in these regions (and, in the case of the Amazon, a significant decrease inrT). The strongest positive
correla-tions of1Dsoilwith1Jare seen north of 60◦N (r=0.69). It is apparent from Fig. 4c that1Dsoil is highly spatially variable in east Asia, where the relative change inJ is also the largest anywhere on the globe (Fig. 3b). This charac-teristic is likely linked to changes in future snow cover at those locations. As Fig. 4d shows, the snow cover difference pattern over east Asia (and far northern Canada, another re-gion with strongly-varyingDsoil) is also highly spatially vari-able with alternating sign, in contrast to other NH locations. The marked east-west asymmetry in snow cover change over northern Asia is the result of a similarly asymmetric pattern of snowfall change. Positive Dsoil changes are associated with areas of decreasing snow cover, albeit of smaller mag-nitude. However, due to the aforementioned low soil dif-fusivities at high latitudes (Sect. 4), even small changes in surface water balance can strongly affect diffusivity. More-over, soil porosities in east Asia are∼15–25% smaller than in west Asia and Europe (Zobler, 1986), meaning that in-creased soil water from spring snow melt in east Asia more strongly moderates diffusivity and uptake there. In Europe
and western Asia, less snow above ground in winter leads to decreased soil moisture in NH summer, and thus to higher annual meanDsoil.
Therefore, while the presumption of increasing diffusiv-ity under surface warming holds for global and even zonal means, it fails over large geographic areas where low poros-ity soils underlie a more varied hydrological regime. Further, while areas of strong increase inDsoillead to similarly large increases inJ, beneficial changes inrT andrSMlead to
pos-itive 1J even where Dsoil decreases. Thus the pattern of 1J (Fig. 3a) is considerably smoother than that of1Dsoil (Fig. 4).
To sum up the annual mean results, Fig. 4a, b and c taken together present a clear picture of how the relative change in each of the key factors contributes to the change in methane flux. The zonal means of these fields, shown in Fig. 5, allow a more direct comparison of the relative strengths of these fac-tors at different latitude, while Table 1 gives the correspond-ing correlation coefficients. Finally, note that due to spa-tial and temporal averaging, large regional correlations and anti-correlations can sometimes sum to near-zero mean val-ues. This explains why, e.g.,1J and1Dsoil are essentially uncorrelated in the zonally averaged 30–60◦S latitude band (Table 1), despite the large relative contribution of1Dsoilto 1J evident in Fig. 5.
5.2 Seasonal differences
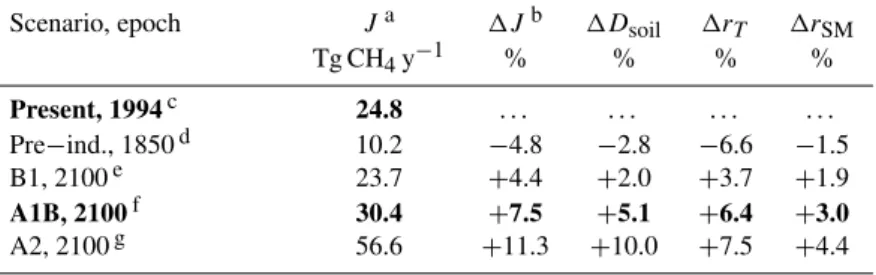
I now investigate how future methane uptake changes depend on latitude and season. Figure 6 is a Hovmueller diagram showing the seasonality of various zonally averaged fields, each normalized by the fractional land area at each latitude. The seasonal cycle of methane uptake in the present day cli-mate is shown in Fig. 6a. The continuous band of high uptake at ∼15◦N corresponds to the sub-Saharan maximum seen
in Fig. 1a, which dominates the small land area at that lati-tude. Three distinct maxima in uptake from May–September are evident in the northern extratropics, due to favourably low diffusivity in NH summer. The largest zonal mean up-take occurs over 10–15◦S from January to May, when suffi-cient moisture is available andrSMis close to unity over most of sub-equatorial South America and Africa. This situation changes dramatically in May, whenrSMfalls to<0.4 in these areas, and remains low until October.
(a) (b)
(c) (d)
(e)
Fig. 6.Hovmueller diagram showing the seasonal cycle of(a)methane uptake in the present-day model climate (mg CH4m−2y−1), and
dif-ferences between year 2100 and present-day of:(b)methane uptake (mg CH4m−2y−1);(c)diffusivity (cm24 s−1);(d)rT (dimensionless);
and(e)rSM(dimensionless).
the largest increases in uptake generally occur at or near up-take minima in the present day state. For example, in the present day climate at 50◦N, CH4 consumption essentially
ceases between January and March each year as Tsoil falls below freezing. In the future climate, however,J exceeds 40 mgCH4m−2y−1in all months at this latitude. The largest rel-ative change in NH methane uptake occurs from October to April at 70–80◦N, when consumption can increase by a fac-tor of ten or more over the small present day values (Fig. 6a). The results of Table 1, Figs. 5 and 6 imply that the uptake enhancement at high northern latitudes is due to the joint in-crease ofrT andDsoil into the future period. Specifically, the poleward extension of warmer temperatures is chiefly responsible for the year-round increase in methane flux in 2100, while the summer peak in 1J can be ascribed to a
corresponding increase inDsoil, the result of increased evap-oration in summer. AlthoughrSM also displays a large in-crease north of 40◦N from fall through spring (Fig. 6e),
this is largely countered by decreases inDsoil due to higher snowmelt, leading to a weak correlation between1rSM and 1Jat these more northerly latitudes (Table 1).
Table 2.Annual mean values at present-day and change (year 2100 minus present) in methane consumption by aggregated Holdridge life
zone (AHLZ)a.
Class/Description Area Areal Uptake, Total Uptake, Areal Uptake Change, Total Uptake Change,
present-day present-day 2100b– present 2100b– present
106km2 mg CH4m−2y−1 Tg CH4y−1 mg CH4m−2y−1 Tg CH4y−1(%)
1 Polar/mountain desert 3.9 109.2 0.43 50.9 0.20 (47)
2 Tundra 10.1 85.1 0.86 41.8 0.42 (49)
3 Boreal desert/scrub 1.8 138.6 0.24 50.1 0.088 (36)
4 Boreal forest 16.1 135.5 2.18 54.5 0.88 (40)
5 Cool temperate desert/scrub 11.3 136.6 1.55 45.9 0.52 (34)
6 Cool temperate forest 11.2 143.8 1.61 44.1 0.50 (31)
7 Warm temperate desert/scrub 4.6 231.7 1.06 47.0 0.22 (20)
8 Warm temperate forest 5.3 253.5 1.34 53.7 0.29 (22)
9 Subtropical desert/scrub 17.3 179.7 3.11 32.0 0.55 (18)
10 Subtropical forest 26.3 273.4 7.18 43.1 1.13 (16)
11 Tropical desert/scrub 7.2 140.3 1.02 20.7 0.15 (15)
12 Tropical dry forest 10.8 274.3 2.97 41.8 0.45 (15)
13 Tropical moist forest 4.5 274.3 1.24 41.6 0.19 (15)
Total Mean Total Mean Total
130.5 190.1 24.8 42.8 5.58 (23)
aAlthough not a AHLZ class, large contiguous areas of high crop coverage (>50%) overlap with AHLZ classes 4, 5, 6, and 8 in central North America and central western Asia, and
AHLZ classes 5, 9, 10 and 12 in India. Similarly, large grassland areas (coverage>50%) are found within AHLZ classes 4, 5, 8, 9 and 10 in North and South America, classes 2, 3,
4 and 5 in central and eastern Asia, and classes 8, 9, 11 and 12 in Africa and Australia. Data on global crop and grassland coverage was taken from the 5′resolution HYDE dataset
for 1990 (History Database of the Global Environment, 2009).
bWith concentration effect included (Sect. 5.1).
Dsoil shows a strong anti-correlation in this instance. The tendency forJ to decrease with decreasingrSM is also seen quite clearly in Figs. 6b and e. This emphasizes once again the prevailing influence ofrSMin the SH, paralleling that of rT in the NH. In general, the pattern of1Dsoil, which largely
complements that of1rSM(as expected, since increasing soil moisture leads to decreased air-filled porosity), appears to be of secondary importance. One exception is from May– September at 30–40◦S, where a persistent decrease inDsoil causes1J <0, even in the presence of increased rSM. But aside from this, Dsoil has a discernable effect on 1J only when reinforced by an associated change inrT. An example
of this occurs in January–February at 50◦S (southern Chile,
where the largest1Dsoil occurs globally), where a large de-crease inDsoilcoupled with a slight decrease inrT leads to a
local minimum in1J.
5.3 Change in uptake by ecosystem type
Analysis of the geographical distribution of methane con-sumption under meteorological forcing in Paper I revealed that subtropical and dry tropical ecosystems account for over half of the present-day uptake. I now examine how the dis-tribution of uptake over ecosystem type (as represented by aggregated Holdridge life zone; see Paper I) is altered by climate change, assuming a static distribution of ecosystem types. While the latter supposition is likely invalid under
strong climate forcing, this approach does permit a straight-forward accounting of changes to uptake in specific geo-graphical regions.
Table 2 shows that, with the exception of tropical and sub-tropical deserts, where 1J is considerably lower than the values seen elsewhere, the change in areal uptake lies in the narrow range of 42–55 mgCH4m−2y−1 across ecosys-tem types. However, the relative increase in uptake is up to three times larger in polar, boreal and cool temperate re-gions than in the subtropics and tropics. This is consistent with the results of Sect. 5.1 and Fig. 3b in particular, which shows large relative increases in flux only in the NH extra-tropics. Subtropical forests, which had the largest areal and total CH4 consumption in Paper I, also undergo the largest total increase in future. But the largest areal increase occurs in boreal forest ecosystems, resulting in a total uptake change that is almost as large as for subtropical forests.
5.4 Further simulations
Table 3.Annual, global mean CH4uptake and change (difference from present day) in various quantities under specified forcing scenarios.
Scenario, epoch Ja 1Jb 1Dsoil 1rT 1rSM
Tg CH4y−1 % % % %
Present, 1994c 24.8 . . . .
Pre−ind., 1850d 10.2 −4.8 −2.8 −6.6 −1.5
B1, 2100e 23.7 +4.4 +2.0 +3.7 +1.9
A1B, 2100f 30.4 +7.5 +5.1 +6.4 +3.0
A2, 2100g 56.6 +11.3 +10.0 +7.5 +4.4
aWith concentration effect included (Sect. 5.1).
bWith concentration effect removed (Sect. 5.1).
cUsing concentrations CH
4=1720 ppbv, CO2=358 ppmv, N2O=311 ppbv, CFC-11=266 pptv, CFC-12=522 pptv.
dUsing historical (circa 1850) concentrations of CH
4=792 ppbv, CO2=288 ppmv, N2O=275.5 ppbv, CFC-11=CFC-12=0.
eUsing concentrations CH
4=1569 ppbv, CO2=540 ppmv, N2O=375 ppbv, CFC-11=45 pptv, CFC-12=222 pptv.
fScenario discussed in detail in Sect. 5 and 6, using concentrations CH
4=1974 ppbv, CO2=717 ppmv, N2O=372 ppbv,
CFC-11=45 pptv, CFC-12=222 pptv.
gUsing concentrations CH
4=3731 ppbv, CO2=836 ppmv, N2O=447 ppbv, CFC-11=45 pptv, CFC-12=222 pptv.
that most of the variation inJ between scenarios (column 2 of Table 3) arises from differences in CH4concentration at various epochs. For example, the preindustrial and A2 sce-nario CH4concentrations differ by a factor of 4.7, while the ratio of their respective J values is 5.5. To gauge the ef-fect of climate change alone on CH4consumption, column 3 of Table 3 shows1Jwith the concentration effect removed. The global mean uptake change based on the future scenarios ranges from+4 to 11%. As might be expected, the global mean 1J scales roughly with the corresponding tempera-ture change, with1J <0 in the preindustrial simulation. The preindustrial uptake is 5% below the present day value. The most scenario-dependent of the primary factors appears to be 1rT, except in the A2 scenario, where the relative increase
in1Dsoilis larger, possibly due to more evaporation at high latitudes than in the other scenarios.
6 Discussion and conclusions
R99 approximated the effect of climate change upon methane uptake in their offline model by calculating the total CH4 uptake under a globally uniform Tsoil increase. When the authors fixed the model soil moisture at present-day values, they found that following a small increase from1Tsoil=0 to 1.5◦,J decreased at higher1T
soildue to the frequent excee-dence of therT maximum in the tropics (Sect. 5.1.1). This
led R99 to conclude that the effect of temperature increase alone (of magnitude∼>1.5◦) is to decrease total methane up-take. In a second calculation, R99 allowed the soil moisture (but not precipitation) to vary according to their hydrological model response to1Tsoil. In this case, decreasing soil mois-ture from rising temperamois-tures and higher evaporation rates in-creased diffusivity overall, causingJto increase by 9% glob-ally at1Tsoil=5◦C. The role ofrSMin this experiment is not
clear; presuming it was allowed to vary with soil moisture, this means thatJ would have increased further hadrSM=1. However, the neglect of precipitation changes in the second experiment probably overestimatedDsoilin the extratropics, likely leading to an overestimated1Jthere (e.g., see Fig. 5). In the present study, a more complex interplay of the in-fluence of temperature, soil moisture, and moisture stress on methane uptake has emerged. The model develops a non-uniform pattern of both soil temperature and precipitation change from present-day to 2100, which results in the com-plex pattern of1J displayed in Fig. 3. Remarkably, how-ever, the global mean value of 1J=+7.5% agrees closely with R99’s second estimate, especially when the lower global mean 1Tsoil=3.5◦C is considered (the corresponding R99
value at the same 1Tsoil is +7.6%). But as Fig. 5 shows, R99’s assessment of the role of the sensitivity ofJ to sepa-rate changes inTsoilandDsoilis too simplistic.
In our experiments, the increase ofTsoilin the tropics does lead to lowerrT, and thus decreasedJover the range 10◦S–
15◦N, but the change is much smaller than the increases seen at higher latitudes (Fig. 5). The small tropical 1rT
is likely due to the combined effect of lower than average 1Tsoil≃3.0◦C and decreasing precipitation over land at these latitudes. By neglecting1Dsoiland1rSMin Eq. (3), one can approximate the effect of fixed soil moisture on our results. The resulting global mean relative change inJ due to1rT
alone is∼+2%, or about one-quarter of the total change inJ, not a decrease inJas predicted by R99.
As discussed in Sect. 5.1.4, diffusivity is strongly controlled by factors other than temperature, including precipitation, porosity, and snow cover (Sect. 5.1 and Fig. 4d and e).
Interestingly, Table 3 shows that the global mean change in the soil moisture stress factorrSMis small and of positive sign in all scenarios and, moreover, is relatively insensitive to scenario. This is somewhat surprising, given thatrSMwas found to be the chief factor limiting uptake in Paper I. This outcome is the result of offsetting changes north and south of∼45◦N in all of the simulations (Fig. 4b; note that land north of 45◦N comprises 36% of the global land area, omit-ting Greenland and Antarctica). Many qualitative predictions of soil water availability in a warmer climate seem to have overlooked the possibility of increasingrSMat high northern latitudes due to increased snowmelt and/or snowfall, as seen in the simulations presented here. Even in the A2 scenario, where the annual mean surface air temperature change north of 45◦N is +7.1◦C by 2100,r
SMstill increases by 4.4%. While this work is a first attempt at calculating the change in methane uptake at the global scale, the influence of sev-eral factors has been neglected. Among these are: 1) an-thropogenic land-use change, which leads to changes in the cultivation fractionrN with time (Ojima et al., 1993); 2) the
evolution of natural wetlands, which leads to a changing pat-tern ofrW; 3) changes in the spatial distribution of ecosystem
types, which requires a dynamic vegetation model; and 4) the effect of changes in soil type and physical characteristics at centennial time scales, which a prescribed global soil texture dataset, such as that used here, cannot capture.
However, the most evident limitation of the present proach is its neglect of methanogenesis, as the method ap-plies only to unsaturated surface soils where aerobic pro-cesses dominate over anaerobic ones. Although wetlands cover only around 5% of the Earth’s ice-free land surface (Prigent et al., 2009), they are responsible for a dispropor-tionate fraction of global methane emissions (25–40% of the annual total, according to a range of estimates; Denman et al., 2007), and thus need to be included in any dynamic model of the methane budget. A more complex soil thermal and hy-drological scheme than that used here, including a dynamic water table, is needed to capture the behaviour of key bio-geochemical feedbacks, such as methane release to the at-mosphere by northern wetlands and carbon sequestration in peatlands under future warming. Progress is now being made in this direction by other researchers (Zhuang et al., 2004; Wania et al., 2009).
Another shortcoming of the present calculations, which is readily remedied, is the adoption of a single uniform value for the CH4surface concentration. Current observations in-dicate a significant north-south gradient in surface CH4, of order 140 ppbv or 8% of the global mean value (Climate Monitoring and Diagnostics Laboratory, 2001). Since both CH4concentrations and land area are largest in the NH, us-ing a more realistic surface concentration distribution should lead to an even larger north/south imbalance in the methane
sink than already seen (approximately 60/40, according to Paper I), and a slightly larger global uptake. Furthermore, the parameterization of methane consumption utilized in this paper can be combined with a simplified atmospheric CH4 chemistry scheme, already tested in AGCM3 (Curry et al., 2006), to enable completely prognostic methane sinks in a coupled GCM. For a prescribed surface CH4concentration field, running the model to equilibrium would then deter-mine the relative contributions of the atmosphere and soil to the total CH4 sink. Alternatively, if instead the surface source distribution of CH4 emissions (∼60% of which are anthropogenic) were prescribed, this would allow the deter-mination of the 3-D methane concentration field. The latter approach would then be suitable for use in transient climate simulations, e.g., along the lines of the C4MIP-type exper-iments conducted with carbon cycle GCMs (Friedlingstein et al., 2006).
In the meantime, the estimates of the present paper give some notion of what to expect for the soil sink portion of the methane budget under the anticipated GHG increases in future decades. In particular, this work has clearly identi-fied the relative roles of the key contributing factors to soil methane consumption in the majority of climatic zones and biomes.
Acknowledgements. I would like to thank Slava Kharin for advice on the correlation analysis, and Vivek Arora, Rita Wania, and an anonymous referee for helpful comments on the manuscript. The author was supported for a portion of this work by the Canadian Foundation for Climate and Atmospheric Sciences, as part of
the Canadian Global Coupled Carbon Climate Model (CGC3M)
research network.
Edited by: J. Kesselmeier
References
Climate Monitoring and Diagnostics Laboratory:
GLOBALVIEW-CH4: Cooperative Atmospheric Data Integration Project
– Methane, CD-ROM, NOAA, Boulder, CO, USA, also
available via anonymous ftp at ftp.cmdl.noaa.gov, path
ccg/ch4/GLOBALVIEW, 2001.
Curry, C. L.: Modelling the soil consumption of atmospheric methane at the global scale, Global Biogeochem. Cy., 21, GB4012, doi:10.1029/2006GB002818, 2007.
Curry, C. L., McFarlane, N. A., and Scinocca, J. F.: Relaxing the well-mixed greenhouse gas approximation in climate simula-tions: Consequences for stratospheric climate, J. Geophys. Res., 111, D08104, doi:10.1029/2005JD006670, 2006.
Chen, Z., Marquis, M., Averyt, K. B., Tignor, M., and Miller, H. L., 499–587, Cambridge Univ. Press, Cambridge and New York, 2007.
Dirmeyer, P. and Tan, L.: A multi-decadal global land-surface data set of state variables and fluxes, Centre for Ocean-Land-Atmosphere Studies, Cent. for Ocean-Land-Atmos. Stud., Calverton, MD, USA, COLA Tech. Rep. 102, also available at http://www.iges.org/pubs/tech.html, 2001.
Dutaur, L. and Verchot, L. V.: A Global Inventory of the Soil
CH4Sink, Global Biogeochem. Cy., 21, GB4012, doi:10.1029/
2006GB002818, 2007.
Friedlingstein, P., Cox, P., Betts, R., Bopp, L., von Bloh, W., Brovkin, V., Cadule, P., Doney, S., Eby, M., Fung, I., Bala, G., John, J., Jones, C., Joos, F., Kato, T., Kawamiya, M., Knorr, W., Lindsay, K., Matthews, H. D., Raddatz, T., Rayner, P., Re-ick, C., Roeckner, E., Schnitzler, K.-G., Schnur, R., Strassmann, K., Weaver, A. J., Yoshikawa, C., and Zeng, N.: Climate-carbon
cycle feedback analysis: Results from the C4MIP model
inter-comparison, J. Climate, 19, 3337–3353, 2006.
Hanson, R. S. and Hanson, T. E.: Methanotrophic bacteria, Micro-biol. Rev., 60, 439–471, 1996.
Hegerl, G. C., Zwiers, F. W., Braconnot, P., Gillett, N. P., Luo, Y., Orsini, J. A. M., Nicholls, N., Penner, J. E., and Stott, P. A.: Un-derstanding and Attributing Climate Change, in: Climate Change 2007: The Physical Science Basis, Contribution of Working Group I to the Fourth Assessment Report of the Intergovernmen-tal Panel on Climate Change, edited by: Solomon, S., Qin, D., Manning, M., Chen, Z., Marquis, M., Averyt, K. B., Tignor, M., and Miller, H. L., Cambridge Univ. Press, Cambridge and New York, 663–745, 2007.
History Database of the Global Environment (HYDE), Netherlands Environmental Assessment Agency, Bilthoven, The Nether-lands, Data available at http://www.mnp.nl/en/themasites/hyde/ downloaddata/index.html, 2009.
Horz, H. P., Rich, V., Avrahami, S., and Bohannan, B. J. M.: Methane-oxidizing bacteria in a California upland grassland
soil: Diversity and response to simulated global change,
Appl. Environ. Microb., 71, 2642–2652, doi:10.1128/AEM.71. 5.2642-2652.2005, 2005.
Knief, C., Lipski, A., and Dunfield, P.: Diversity and activity of methanotrophic bacteria in different upland soils, Appl. Environ. Microb., 69, 6703–6714, doi:10.1128/AEM.69.11.6703-6714. 2003, 2003.
McFarlane, N. A., Boer, G. J., Blanchet, J.-P., and Lazare, M.: The Canadian Climate Centre second-generation general circulation model and its equilibrium climate, J. Climate, 5, 1013–1044, 1992.
McFarlane, N. A., Scinocca, J. F., Lazare, M., Harvey, R., Verseghy, D., and Li, J.: The CCCma third generation atmospheric gen-eral circulation model, CCCma Internal Rep., 40 pp., available at http://www.cccma.ec.gc.ca/models/gcm3.shtml, 2005.
Ojima, D. S., Valentine, D. W., Mosier, A. R., Parton, W. J., and Schimel, D. S.: Effect of land use change on methane oxidation in temperate forest and grassland soils, Chemosphere, 26, 675– 685, 1993.
Prigent, C., Papa, F., Aires, F., Rossow, W. B., and Matthews, E.: Global inundation dynamics inferred from multiple satellite observations, 1993–2000, J. Geophys. Res., 112, D12107, doi: 10.1029/2006JD007847, 2009.
Ridgwell, A., Marshall, S. J., and Gregson, K.: Consumption of atmospheric methane by soils: a process-based model, Global Biogeochem.Cy., 13, 59–70, 1999.
Roslev, P., Iversen, N., and Henriksen, K.: Oxidation and assimi-lation of atmospheric methane by soil methane oxidizers, Appl. Environ. Microb., 63, 874–880, 1997.
Schnell, S. and King, G. M.: Responses of methanotrophic activity in soils and cultures to water stress, Appl. Environ. Microb., 62, 3203–3209, 1996.
Torn, M. S. and Harte, J.: Methane consumption by montane soils: implications for positive and negative feedback with climatic change, Biogeochemistry, 32, 53–67, 1996.
Verseghy, D. L.: CLASS – A Canadian Land Surface Scheme for GCMs. I. Soil model, Int. J. Climatol., 11, 111–133, 1991. Verseghy, D. L.: Local climates simulated by two generations of
Canadian GCM land surface schemes, Atmos. Ocean, 34, 435– 456, 1996.
von Fischer, J. C., Butters, G., Duchateau, P. C., Thelwell, R. J., and Siller, R.: In situ measures of methanotroph activity in upland soils: A reaction-diffusion model and field observation of water stress, J. Geophys. Res., 114, G01015, doi:10.1029/ 2008JG000731, 2009.
Wania, R., Ross, I., and Prentice, I. C.: Integrating peatlands and permafrost into a dynamic global vegetation model: I. Evalua-tion and sensitivity of physical land surface processes, Global Biogeochem. Cy., doi:10.1029/2008GB003412, in press, 2009. Zhuang, Q., Melillo, J. M., Kicklighter, D. W., Prinn, R. G.,
McGuire, A. D., Steudler, P. A., Felzer, B. S., and Hu, S.: Methane fluxes between terrestrial ecosystems and the atmo-sphere at northern high latitudes during the past century: A retrospective analysis with a process-based biogeochemistry model, Global Biogeochem. Cy., 18, GB3010, doi:10.1029/ 2004GB002239, 2004.