Atmos. Chem. Phys., 16, 4251–4269, 2016 www.atmos-chem-phys.net/16/4251/2016/ doi:10.5194/acp-16-4251-2016
© Author(s) 2016. CC Attribution 3.0 License.
Detecting moisture transport pathways to the subtropical North
Atlantic free troposphere using paired H
2
O-
δ
D in situ measurements
Yenny González1,2,a, Matthias Schneider3, Christoph Dyroff3,b, Sergio Rodríguez2, Emanuel Christner3, Omaira Elena García2, Emilio Cuevas2, Juan Jose Bustos2, Ramon Ramos2, Carmen Guirado-Fuentes2, Sabine Barthlott3, Andreas Wiegele3, and Eliezer Sepúlveda2
1Sieltec Canarias, S. L., Hábitat 2, 38204, San Cristóbal de La Laguna, Santa Cruz de Tenerife, Canary Islands, Spain 2Izaña Atmospheric Research Centre (IARC), Agencia Estatal de Meteorología (AEMET), Santa Cruz de Tenerife, Canary Islands, Spain
3Institute of Meteorology and Climate Research (IMK-ASF), Karlsruhe Institute of Technology (KIT), Karlsruhe, Germany anow at: Dept. of Earth, Atmospheric and Planetary Sciences, Massachusetts Institute of Technology,
77 Massachusetts Avenue, Cambridge, MA 02139-4307, USA
bnow at: Aerodyne Research Inc., 45 Manning Road, Billerica MA 01821, USA
Correspondence to:Yenny González ([email protected])
Received: 13 August 2015 – Published in Atmos. Chem. Phys. Discuss.: 8 October 2015 Revised: 15 March 2016 – Accepted: 17 March 2016 – Published: 5 April 2016
Abstract. We present two years of in situ measurements of water vapour (H2O) and its isotopologue ratio (δD, the standardized ratio between H216O and HD16O), made at two remote mountain sites on Tenerife in the subtropical North Atlantic. We show that the data – if measured dur-ing night-time – are well representative for the lower/middle free troposphere. We use the measured H2O-δD pairs, to-gether with dust measurements and back trajectory mod-elling for analysing the moisture pathways to this region. We can identify four principally different transport pathways. The air mass transport from high altitudes and high latitudes shows two different scenarios. The first scenario brings dry air masses to the stations, as the result of condensation events occurring at low temperatures. The second scenario brings humid air masses to the stations, due to cross-isentropic mix-ing with lower-level and more humid air durmix-ing transport since last condensation (LC). The third pathway is trans-portation from lower latitudes and lower altitudes, whereby we can identify rain re-evaporation as an occasional source of moisture. The fourth pathway is linked to the African continent, where during summer, dry convection processes over the Sahara very effectively inject humidity from the boundary layer to higher altitudes. This so-called Saharan Air Layer (SAL) is then advected westward over the Atlantic and contributes to moisten the free troposphere. We
demon-strate that the different pathways leave distinct fingerprints on the measured H2O-δD pairs.
1 Introduction
In the subtropical free troposphere, in the region of the de-scending branch of the Hadley cell, the humidity is not con-served along the mean subsidence (Pierrehumbert, 1998). In-stead, this dry air is often moistened (Galewsky and Hur-ley, 2010; Couhert et al., 2010; Risi et al., 2012). The few studies based on atmospheric modelling points to the turbu-lent transport of water vapour from the surface upwards as the dominant moistening process, balancing the drying in the subtropical free troposphere (Couhert et al., 2010; Risi et al., 2012). Additional processes, such as evaporation of conden-sate and isentropic eddy transport of moist air from the trop-ics, are suggested to also contribute to moisture in this region (Galewsky and Hurley, 2010, and references therein), but the sources and dynamics involved in this moistening are still unclear.
as-Figure 1.Schematic depiction of the processes influencing the water vapour balance over Tenerife in the subtropical North Atlantic. A tem-perature inversion layer separates the marine boundary layer (MBL) and the free troposphere (FT). In the MBL, NE trade winds blow, while in the FT, the regular NW subsidence regime is alternated in summer with Saharan dust outbreaks. On the island, the upslope winds prompt MBL air to reach the low FT during the daytime. IZO and TDE stations are represented as red dots.
sociated with moistening (e.g. Galewsky and Hurley, 2010; Noone et al., 2011; Tremoy et al., 2012; Samuels-Crow et al., 2014; Bailey et al., 2013, 2015; Dyroff et al., 2015; Steen-Larsen et al., 2015; Schneider et al., 2015). Stations located in the subtropical free troposphere are key emplacements for studying the synoptical scale humid transport in the sub-tropics. Studies based on water vapour isotope observations in the subtropical Pacific free troposphere highlight the rel-evance of moisture exchange between the boundary layer and the free troposphere due to shallow convection at local scale (Bailey et al., 2013). In addition, subtropical moisture is strongly affected by the mixing of air masses, with hu-midity properties that are defined by their condensation and evaporation history on a regional scale (Noone et al., 2011). In the North Atlantic, studies based on in situ water vapour isotopologue measurements have been focused on the mois-ture sources influencing the marine boundary layer (Benetti et al., 2014; Steen-Larsen et al., 2014, 2015). However, stud-ies in relation to transport pathways of moisture in the sub-tropical North Atlantic free troposphere including long-term measurements of water vapour isotopologues have not been reported yet. In contrast to the Pacific, the atmosphere over the subtropical North Atlantic is regularly affected by dust outbreaks (from the Sahara desert) and consequently, the scheme of moisture exchange in the subtropical Pacific re-gion can not fully describe those occurring in the subtropical North Atlantic. In order to fill this gap, we present and dis-cuss the first multi-year observational in situ data set of free-tropospheric water vapour isotopologues in the subtropical North Atlantic region.
In the following we express the isotopologues H216O and HD16O as H
2O and HDO. The δ-notation expresses the per mil difference of the stable isotope ratio of a wa-ter sample (R=HDO/H2O) from that of the isotope ratio of Vienna Standard Mean Ocean Water, i.e. δD=1000× (R/RVSMOW−1)(RVSMOW=3.1152×10−4, Craig, 1961; Coplen, 2011).
In Sect. 2 of this paper we present the measurement sites and discuss the methodology of our study. In Sect. 3 we
doc-ument that our night-time measurements are representative for the subtropical North Atlantic lower free troposphere. We use backward trajectories and dust measurements as tracers for detecting the main meteorological processes. Then, we document that these processes leave unique fingerprints in the H2O-δD distribution. Section 4 summarizes the work.
2 Methodology
2.1 Measurement site
As a study area we used Tenerife (Canary Islands, Spain; 28.3◦N, 16.5◦W). On this island, two high mountain sites are run by the Izaña Atmospheric Research Centre. IZO (Izana Observatory) is a mountain top station located at 2367 m a.s.l., whereas TDE (Teide Observatory) is a small measurement site located at the volcanic cone at 3550 m a.s.l. In the context of the project MUSICA (MUlti-platform re-mote Sensing of Isotopologues for investigating the Cycle of Atmospheric water), we installed two Picarro instruments at IZO and TDE stations. These instruments provide continu-ous isotopologues data for altitudes above 2000 m, which are unique for the subtropical North Atlantic.
Y. González et al.: Moisture pathways and H2O-δD pairs in the subtropical North Atlantic free troposphere 4253
Figure 2.Time periods covered by water isotopologue in situ observations at IZO (upper panel) and TDE (lower panel). All 10 min averages ofδD measured at any time of the day are shown .
The local moisture exchange between the MBL and the FT is limited by a temperature inversion layer. In the surround-ings of the island, the top of the MBL, which is frequently located just below the temperature inversion layer, is charac-terized by a stratocumulus layer formed by the condensation of water vapour onto the pre-existing particles (Rodríguez et al., 2009). This layer creates a quasi-continuous foggy and rainy regime between 800 and 2000 m a.s.l., which is more pronounced on the northern part of the island. The effective-ness of this layer in separating the MBL from the FT is re-flected in the relative humidity (RH) profile. In the FT, the RH is typically around 20 %, whereas it is normally above 60 % in the MBL (Cuevas et al., 2013). Vertical mixing be-tween MBL and FT air is observed during the daytime due to the upslope flow regime (taking place on a very local scale).
2.2 Measurements of water vapour isotopologues
Two commercial cavity ring-down spectrometers (Picarro model L2120-I) have been used for water vapour isotopo-logues, monitoring at the two mountain sites on Tenerife. At IZO, measurements started in March 2012 and at TDE in July 2013. The data sets consist of about 75 000 (at IZO) and 40 000 (at TDE) 10 min averages. Time series of δD measurements at IZO and TDE stations are shown in Fig. 2. The measurement gaps are due to instrument failure, main-tenance, and shut downs due to extreme weather conditions. Although during summer data have been registered almost continuously, the measurements have often been interrupted during winter. There are only a few measurement days in De-cember and January (at IZO) and in January (at TDE).
At IZO, H2O data between 200 and 16 000 ppmv andδD between −500 and −90 ‰ were recorded. At TDE, H2O ranged between 250 and 12000 ppmv andδD ranged between −430 and −100 ‰. At Mauna Loa free troposphere
sta-tion, Noone et al. (2011) reportedδD values between−100 and−400 ‰ and humidities between 500 and 15 000 ppmv. On the Chilean hyperarid Chajnantor plateau, Samuels-Crow et al. (2014) recorded H2O-δD pairs ranging from 95 ppmv and−465 ‰ to 12 500 ppmv and−45 ‰. Thus, the in situ H2O-δD measurements made at the different subtropical free-tropospheric stations registered data that are within the same order of magnitude.
At IZO, the sampling inlet is installed 4 m above the roof of a 6-floor building at a height of 30 m above ground (2397 m a.s.l.). It consists of a stainless steel tube of 18 m that goes from the terrace of the tower, through the service chan-nel to the Picarro laboratory. A vacuum pump generates an inflow of 2810 L min−1(standard conditions) throughout the sampling line, which has an inner diameter of 80 mm. The manifold has an inner diameter of 80 mm and a length of 250 mm. The instrument takes the air sample using a stain-less steel tube with an inner diameter of 4 mm, which goes from the manifold to the inlet of the analyzer (1.6 m). An ad-ditional pump with an inflow of 5 L min−1 is connected in series at the inlet of the instrument. The residence time of the air inside the tubing is approximately 8 s.
At TDE, the inlet is also 4 m above the roof at a height of 6 m above the ground (3556 m a.s.l.). The sampling line is connected to a manifold with an inner diameter of 60 mm and a total length of 5 m where the air is pumped at 20 L min−1. The air then flows to the instrument through stainless steel tubes with an inner diameter of 4 mm (3.3 m). At TDE, an ad-ditional pump with an inflow of 5 L min−1is also connected in series at the inlet of the instrument. The residence time of the air is approximately 44 s.
and 15◦C, whereas at TDE it varies between 6 and 11◦C. Since the tubing in the buildings is kept around 21◦C, con-densation events in the inlet lines can be excluded.
For calibration purposes we used two liquid working stan-dards of composition δDS1= −142.2±0.7 ‰ andδDS2= −245.3±0.7 ‰. The working standards were prepared from a mixture of ground water from Karlsruhe, Germany, melted Antarctic snow (S1), and the pure melted Antarctic snow (S2). The isotopologue composition of these standards was measured by Le Laboratoire des Sciences du Climat et de l’Environnement (LSCE-CEA, France) and referenced to the VSMOW2/SLAP2 scale (IAEA, 2009). For routine mea-surements we need a significant amount of liquid standards (1 L year−1and instrument). Large amounts of our two stan-dards are available and we can perform continuous calibra-tions during long measurement periods.
The instruments are calibrated every 8–12 h using liquid standards injected with the Picarro Standards Delivery Mod-ule (SDM). The instrument precision for 10 min averages and at 15 700 ppmv is better than 0.2 ‰ (see Aemisegger et al., 2012, Fig. 7a), and for very dry conditions within a few per-mil. The error estimation accounts for the described instru-ment precision as well as errors due to the following correc-tions:
a. uncertainty of the standards (0.7 ‰ for both),
b. humidity dependence (from 0.3 ‰ for 10 000 ppmv, up to 8.0 ‰ at 200 ppmv),
c. extrapolation of VSMOW2-SLAP2 scale outside the range of calibration (for humid air:<2.0 ‰; up to 5 ‰ for strong depleted, i.e. generally dry air),
d. calibration (1 ‰ for the whole humidity range). The absolute uncertainties in δD are then <15 ‰ at 500 ppmv,<4 ‰ at 4500 ppmv and even smaller for higher humidity. More detailed information about the calibration procedure, stability, and uncertainty estimations of the two instruments is given in Appendix A.
The leading errors are due to the calibration corrections, meaning that they are systematic errors for the period be-tween two calibrations. Thus, calculating 1 or 3 h averages instead of 10 min averages will not significantly reduce these errors. Actually, the variations we see within 1 h are mostly real atmospheric variations (recall the high precision of the 10 min averages). Calculating averages of these real atmo-spheric small-scale variations is not trivial and might affect the H2O-δD distribution: firstly, H2O is often log-normally distributed and it will make a difference whether we use the mean or the median H2O concentrations. Secondly, H2O-δD pairs do not vary along a single straight line. By averaging theδD and the H2O values, the averaged H2O-δD data point will be below the mixing line or the Rayleigh curve described by the individual data points. If we average theδD weighted by H2O, the pairs will lie close to the mixing line, but we will
not capture the situation of a Rayleigh process well. In order to avoid artefacts caused by data averaging, all the H2O-δD distribution plots of our study are made with high resolution data (10 min averages).
2.3 Measurements of dust
Long-term measurements of aerosol at Izaña include chem-ical composition, dust concentrations, and size distribution. The methodology and quality control of aerosol in situ tech-niques are described in Rodríguez et al. (2012). In Izaña, bulk mass concentrations of aerosols are clearly dominated by Sa-haran dust (Basart et al., 2009; Rodríguez et al., 2011). We used records of dust at Izaña to detect the arrival of north African air (Rodríguez et al., 2012).
Unfortunately, in situ dust measurements are not available at TDE. In order to distinguish between clean and dust-laden conditions at this station we use the AERONET columnar-integrated aerosol optical depth (AOD) level 2.0 obtained at a wavelength of 500 nm at IZO (http://aeronet.gsfc.nasa. gov). See more details of calibration procedures, data acqui-sition, and processing in Holben et al. (1998).
2.4 Back trajectories
Transport pathways of moisture are analysed by integrating the Global Data Assimilation System archive information (GDAS1, NCEP) in the Hybrid Single Particle Lagrangian Integrated Trajectory model (HYSPLIT 4.0). The GDAS1 is available every 6 h, and the post-processing converts the data to 1◦×1◦latitude–longitude grids and from sigma levels to the 23 pressure levels between 1000 and 20 hPa (Rolph et al., 2014). HYSPLIT performs a linear interpolation between the times of the available input data (6 h) for calculating 5- day back trajectories of 1 h resolution (Draxler and Rolph, 2003). The trajectories are released at the height above sea level of the stations. The vertical component of the back trajec-tories was computed using the vertical model velocity. The end points of the trajectories were set at Tenerife (28.3◦N, 16.5◦W) at the elevations of the IZO and TDE stations.
3 Results
3.1 The effect of the local diurnal upslope flow
Y. González et al.: Moisture pathways and H2O-δD pairs in the subtropical North Atlantic free troposphere 4255
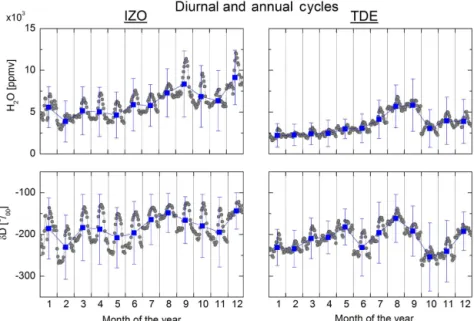
Figure 3.The mean diurnal cycle and annual cycles of H2O-δD (left panels for IZO and right panels for TDE). Grey dots show the mean diurnal cycles for each month (mean value for each hour of the day) and the blue squares the annual cycle (mean and standard deviation of all observations that fall within an individual month).
(e.g. Rodríguez et al., 2009). The highest concentrations of pollutants are observed in the early afternoon.
Figure 3 shows the monthly mean daily cycle of H2O and δD at IZO and TDE stations respectively (grey dots). The annual mean and standard deviation of H2O andδD at both stations is also shown in blue dots. There is a marked daily cycle in the H2O andδD data of the IZO station (left column in Fig. 3) and a weaker one at the TDE station (right column in Fig. 3). At IZO, the diurnal cycle of H2O andδD is more pronounced than the annual cycle. At TDE, the H2O annual cycle is stronger than the diurnal cycle. However at TDE,δD data also show a diurnal cycle with an amplitude similar to the amplitude of the annual cycle.
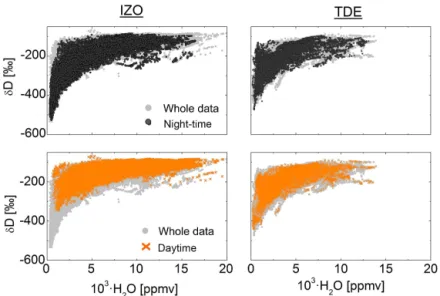
The distribution of the 10 min H2O-δD pairs collected at IZO and TDE stations are shown in Fig. 4. The whole data set (10 min average) is presented in grey dots; black dots rep-resent the data collected during night-time (from midnight to 1 h after sunrise). Orange crosses represent the data collected during the daytime (from 3 to 10 h after sunrise, when the upslope breeze is active).
At IZO, the lowestδD values are measured at night-time (Fig. 4). During the daytime, we observe less depletion. The H2O-δD pairs measured at IZO during the daytime are as-sembled in the upper side of the H2O-δD distribution (δD= −146±39 ‰, orange crosses, left column in Fig. 4). At mid-day, the increase of humidity is associated with a mean iso-topic composition ofδD= −131±35 ‰. This value is sim-ilar to the one measured close to the ocean by Dyroff et al. (2015). TheδD mean value of these in-flight measurements measured around the top of the MBL, 600–900 m a.s.l. in front of the Tenerife coast was−124±43 ‰. Thus, the
shift-ing of the H2O-δD pairs to the upper side of the distribution is the result of the mixing of dry FT air with water evaporated from the surrounding ocean and exported by turbulent mix-ing to the top of the MBL. This result is in agreement with the one found by Noone et al. (2011) in Mauna Loa (Hawaii). At TDE, the difference between the daytime and night-time H2O-δD distribution is not as clear as at IZO (right col-umn in Fig. 4). The weaker diurnal effect at TDE station is due to its location. TDE is located at a higher altitude on a rather sharp peak (Pico del Teide). There it is less exposed to the slope breezes and consequently, the influence of the MBL-FT air mixing is weaker.
At IZO, gases and particles measured at night-time well represent FT conditions (Gómez-Peláez et al., 2006; Ro-dríguez et al., 2009, 2012; Cuevas et al., 2013). To examine the variability of the H2O-δD pairs in the subtropical North Atlantic FT, and in order to avoid the possible local MBL-FT mixing, only the H2O-δD pairs measured at night-time at IZO and TDE will be considered in the following study.
Appendix B complements this study of the diurnal sig-nals in the H2O-δD distribution. Figure B1 shows a two-dimensional plot of the density of the H2O-δD pairs for night-time and daytime observations.
3.2 The Saharan Air Layer and the moisture in the subtropical North Atlantic FT
Figure 4.Distribution of the H2O-δD pairs (10 min averages) at IZO (left) and TDE (right) stations. Grey dots show all data for the individual stations. Black dots represent the data collected during night-time (from midnight to 1 h after sunrise). Orange crosses represent the data collected during the daytime (from 3 to 10 h after the sunrise). The whole data set is presented in grey dots.
their dust content. At IZO, dust concentrations under back-ground clean conditions are lower than 2 µg m−3(Rodríguez et al., 2009), whereas during Saharan events, dust concentra-tions above 25 µg m−3are usually observed (Rodríguez et al., 2015). The Izaña AOD levels for background conditions are usually lower than 0.05 (García et al., 2012) and frequently above 0.10 during dust events (Basart et al., 2009; García et al., 2012).
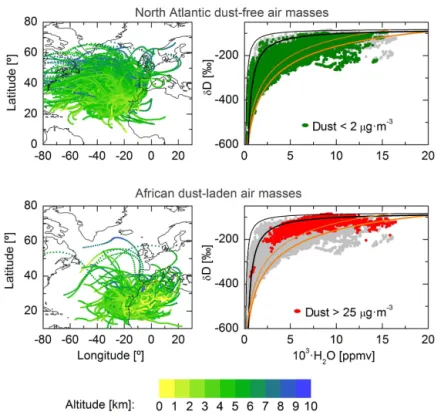
The left column in Figs. 5 and 6 show the distribution of 5 day back trajectories for non-dust and dust-laden condi-tions at IZO and TDE stacondi-tions respectively. We considered that an air mass experiences condensation when RH along the trajectory to the station exceeds the limit of 80 % during a 3 h time interval (James et al., 2004; Sodemann et al., 2008). If this occurs, we set this point as the initial point of the back trajectory. If no condensation was observed along the 5- day path, the back trajectory was fully drawn. Clean dust-free air masses originate from the FT over the Atlantic (first row in Figs. 5 and 6). Dust-laden air masses originate in north Africa close to the surface (dust>25 µg m−3, AOD>0.1, second row in Figs. 5 and 6).
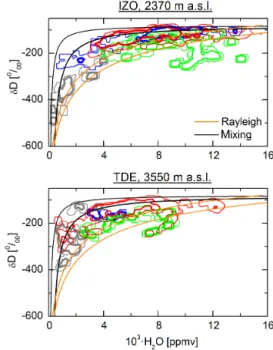
The right column in Figs. 5 and 6 show the 10 min av-erage H2O-δD pairs measured under non-dust (green dots) and dust-laden conditions (red dots) at IZO and TDE stations respectively. The whole H2O-δD distribution (grey dots) is quite well confined within two theoretical curves. The the-oretical line on the low δD value side of the distribution represents the evolution of an air mass that has experi-enced Rayleigh distillation, a gradual dehydration in which all condensate is immediately removed from the vapour phase (initial conditions: RH=80 % and SST=25◦C, or-ange line). The Rayleigh process starts when saturation is reached (dew point). The equations and coefficients for
saturation over water conditions were taken from John-son et al. (2001). For the theoretical mixing we assume moistening by evaporation from the ocean surface and dry-ing by middle/upper tropospheric air (initial conditions of air mass 1: H2O=18 000 ppmv, δD= −84 ‰; air mass 2: H2O=400 ppmv,δD= −600 ‰, solid black line). The cal-culation of this mixing line is based on the simplified solution of the diffusion mixing model shown by Noone et al. (2011, Eq. 6). These two theoretical lines (Rayleigh and mixing) mostly cover the set of H2O-δD measured during this study.
The H2O-δD pairs associated with clearly non-dust condi-tions represent 55 % of the data collected at IZO and 51 % of the data collected at the TDE. The origin of the North Atlantic air masses reaching IZO and TDE stations covers a wide area (0–60◦N, 45◦W–20◦E), and also a wide range of altitudes (0–10 km; left column in Figs. 5 and 6). A wide H2O-δD distribution is measured under the arrival of dust-free air masses (green dots in right column in Figs. 5 and 6). This distribution illustrates the effect of non-Rayleigh processes affecting H2O and δD, such as air mass mix-ing and different H2O-δD-relations (Rayleigh-curves) of air masses from different source regions (Brown et al., 2013). At both stations, night-time H2O-δD pairs below a mini-mum Rayleigh curve for air masses with subtropical ori-gin (initial H2O=27 000 ppmv,δD= −71 ‰) cannot be ex-plained by condensation or mixing. Therefore, these occa-sional super-Rayleigh observations indicate additional frac-tionation related to either intracloud or subcloud processes or post-condensational exchange (Brown et al., 2013, and refer-ences therein). These observations will be discussed later.
Y. González et al.: Moisture pathways and H2O-δD pairs in the subtropical North Atlantic free troposphere 4257
Figure 5.Air masses reaching IZO station as a function of the dust load. First row shows non-dust conditions, second row, dust-laden conditions. The colour-bar indicates the altitude (km) of these air masses in each grid. The left column shows the trajectories. The right column shows the H2O-δD distribution (pairs are presented on 10 min average): all data (grey dots), data measured under non-dust conditions (green dots) and data for dust-laden conditions (red dots). Orange lines represent the evolution of an air mass that has experienced Rayleigh distillation for RH=80 % and SST=18◦C (thin line) and SST=25◦C (thick line) respectively. These temperatures cover the annual
mean sea surface temperatures around the Canaries. The thin black line represents the mixing between a moist air mass (initial conditions: H2O=18 000 ppmv,δD= −84 ‰) and a dry air mass (initial conditions: H2O=400 ppmv,δD= −600 ‰). The thick black line represents another mixing process (initial conditions for moist end member: H2O=16 000 ppmv,δD= −93 ‰; initial conditions for dry end member: H2O=400 ppmv,δD= −600 ‰).
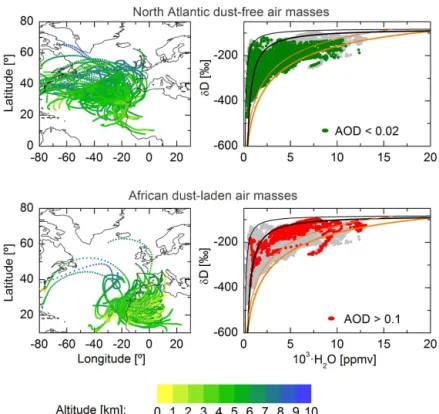
dust measurements, and 70 % of TDE measurements. The H2O-δD pairs collected under dust-laden conditions were confined to the upper part of the distribution (red dots in Figs. 5 and 6). During these events, relatively enriched and moist H2O-δD pairs were measured. Mean values for IZO were −133±35 ‰ for IZO and 7000±3000 ppmv; and for TDE −152±44 ‰ and 5000±2000 ppmv respec-tively. The H2O-δD distribution under dust-laden events is limited by theoretical lines that simulate the mixing be-tween BL and FT air. The dashed black line drawn in Figs. 5 and 6 represents the mixing between the following air masses: air mass (1) H2O=16 000 ppmv,δD= −93 ‰ and air mass (2) H2O=400 ppmv,δD= −600 ‰. This mix-ing line was determined as best fit of the border of the data of dust-laden air.
Episodes of moderate dust content (2<dust<25 µg m−3, 0.02<AOD<0.1) are related to air masses that have trav-elled westward from the African continent towards the At-lantic Ocean and then return eastward laden with the re-maining dust, where they are measured at IZO. These events
are the mixing product of clean North Atlantic and Saharan dust-laden air masses. As a consequence, they do not make a unique fingerprint on the H2O-δD distribution and are not shown here.
Figure 6.Same as Fig. 5 for the data collected at TDE station.
et al., 2013; Rodríguez et al., 2015). Previous work indicates that the moisture content of the SAL during summer has its origin in evaporation of the warmer Mediterranean Sea, which is then driven by the trade winds over north Africa, mixed with dust in the Sahara desert and then transported into the SAL to the subtropical North Atlantic FT (Millán et al., 1997, 2004; Rodríguez et al., 2011). Risi et al. (2010) showed column vapourδD summer mean from satellite ob-servations and atmospheric models varying between −100 and−160 ‰ for the region covering the Mediterranean Sea and the Sahara desert (period 2003–2005). These mean val-ues are in agreement with our data set.
3.3 Classification of North Atlantic air masses as a function of the last condensation temperature
In this section, we focus on the moisture transport pathways over the North Atlantic. For this purpose, we only work with air masses corresponding to clean conditions (not linked to SAL) and we use the theory of the last condensation (LC) point. According to this theory, the mixing ratio is deter-mined by the specific humidity at the point of LC, in which case it is not affected by subsequent mixing (Galewsky et al., 2005, and references therein).
We use GDAS1 data and HYSPLIT back trajectories to de-rive information about the LC point and mixing after LC and then relate this information to our H2O-δD observations. The
LC point is identified at the area where RH exceeds 80 % dur-ing a 3 h time interval (James et al., 2004; Sodemann et al., 2008). We use the corresponding 3 h averages of tempera-ture and specific humidity at this LC point (in the following referred to asTLCand H2OLC) for classifying the air masses. We create three main data groups: TLC<250 K, 250 K< TLC<270 K, and TLC>270 K. The temperatures TLC=250 K and TLC=270 K correspond to humidities of approximately 1700 and 8000 ppmv respectively. The exact values of the temperatures that define the three temperature groups are more or less arbitrary. The absolute value is not important here. What is important is that we distinguish air masses according to their temperatures at the last condensation point. We group all air masses for lowTLC (last condensation at low temperatures, i.e. dry at the last condensation point) and for highTLC(i.e. last condensation at high temperatures and accordingly humid air masses). Furthermore, we create a group that lies in between.
Y. González et al.: Moisture pathways and H2O-δD pairs in the subtropical North Atlantic free troposphere 4259
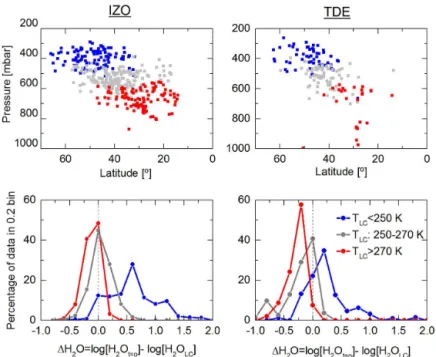
Figure 7.Trajectory-based analysis of the last condensation (LC) point for non-SAL conditions. Upper panels: location (pressure-latitude) of LC point. Bottom panels: histograms for1H2O=log[H2Ot=0] −log[H2OLC]. The different colours correspond to differentTLCgroups: TLC<250 K (blue line), 250 K< TLC<270 K (grey line) andTLC>270 K (red line).
temperatures (250–270 K) usually originate between 20 and 50◦N at 400–600 hPa (grey, Fig. 7). They represent 48 and 42 % of the air masses reaching IZO and TDE respectively. The warmest LC temperatures (270–290 K) usually originate between 0 and 40◦N and pressure levels above 600 hPa (red, Fig. 7). They represent 20 and 14 % of the air masses reach-ing IZO and TDE respectively.
We use the logarithmic difference between the humid-ity given by GDAS1/HYSPLIT at the station (H2Ot=0) and the humidity at the LC point (H2OLC), in order to anal-yse if the air mass experienced variations on the moist con-tent during the transport from the LC point to the stations (log[H2Ot=0] −log[H2OLC], hereafter1H2O). We postulate that the air masses with1H2O within the±0.1 bin do con-serve the properties of the LC point during their transport to IZO and TDE. Negative1H2O indicates that the air masses mix with drier air masses during transport to the stations (we exclude situations of rainout by requiring that RH never reaches 80 % before the LC point). Positive1H2O indicates that the air masses get moister. The bottom panels of Fig. 7 show the normalized distribution of1H2O for the threeTLC groups (blue, black, and red coloured lines respectively). Left panel for IZO and right panel for TDE.
At IZO the humidity concentrations since the LC point are best conserved forTLC>250 K (red and grey lines). At TDE we observe a relatively clear moistening for TLC<270 K (grey and blue lines) and in general a drying for air masses with TLC>270 K (red line). The total contribution of air masses with1H2O<−0.1 (i.e. drying since LC) is 19 % at IZO and 43 % at TDE, revealing that drying by mixing with
dry air is more frequently observed at IZO. ForTLC>270 K, i.e. for air that has been rather humid at the LC point, the dry-ing by mixdry-ing with subsiddry-ing dry air is very clearly observed at TDE (red line, bottom right panel of Fig. 7). The total con-tribution of air masses with1H2O>+0.1 (i.e. moistening since LC) is 46 % at IZO and 29 % at TDE. This moist-ening is most pronounced for air with the LC point in the upper troposphere of the extra-tropics (TLC<250 K) and it becomes particularly evident at IZO (blue line, bottom left panel of Fig. 7). This moistening process is more important at IZO than at TDE, due to IZO’s location at a lower alti-tude, which is directly affected by turbulent mixing from the marine boundary layer.
Figure 8.H2O-δD distribution (10 min data within±3 h of the arrival time of the air mass) measured at IZO station and analysed with regard to the LC point. The data set has been grouped in three groups corresponding to different condensation temperatures:TLC<250 K, 250 K< TLC<270 K andTLC>270 K. The H2O-δD pairs measured for reduced mixing since LC (1H2O±0.1) are presented in green. Pairs measured for increased mixing since LC (1H2O outside±0.1) are presented in dark grey. Rayleigh and mixing curves are plotted as in Figs. 5 and 6.
Figure 9.Same as Fig. 8 for the data collected at TDE station.
Pacific such as Chajnantor plateau (in Chile, Samuels-Crow et al., 2014) and Mauna Loa station (in Hawaii, e.g. Noone et al., 2011; Bailey et al., 2015). Generally at IZO humidity is not conserved since LC ifTLCis low. In most cases these air masses are mixed with humid air during their transport. This mixing can then be observed in the measured H2O-δD pairs. If there is a lot of mixing (H2O>8000 ppmv) the vapour is
Y. González et al.: Moisture pathways and H2O-δD pairs in the subtropical North Atlantic free troposphere 4261
For the warmest LC temperature group (TLC>270 K, right panels in Fig. 8) we occasionally observe H2O-δD pairs below the exemplary Rayleigh distribution, which can be ex-plained by evaporation from a rather warm ocean or by re-evaporation of falling rain droplets. Under these conditions the subtropical North Atlantic free troposphere is particularly humid. These tropical air masses moving north-east towards the Canaries, moistening the atmosphere, are also observed in the subtropical Pacific (in Mauna Loa station, Bailey et al., 2015). In some occasions, mixing with air from higher atmo-spheric levels can also dry these air masses. The distribution of H2O-δD pairs describing this mixing lie above the exem-plary Rayleigh line (dark grey dots in bottom right panels of Figs. 8 and 9).
For air masses linked to intermediateTLC(above 250 and below 270 K; central column in Figs. 8 and 9) we observe a mix of the different processes discussed above.
It is important to keep in mind that the meteorologi-cal parameters upwind of the stations as deduced by HYS-PLIT/GDAS1 are the result of a dispersion model and analy-sis fields, each with an uncertainty. It is likely that our anal-yses are affected by these uncertainties. See more details in Appendix C. Nevertheless, we are able to demonstrate a clear relation between the HYSPLIT/GDAS1 data and the measured H2O-δD pairs which a posteriori justifies our ap-proach. Our simplified analysis suggests that the distribution of the moisture in the subtropical North Atlantic FT is con-trolled by the temperature at last condensation and subse-quent mixing of air masses. Thus, these results are in agree-ment with the idealized advection-condensation model pro-posed by Galewsky and Hurley (2010).
4 Summary and conclusions
We report continuous measurements of water vapour iso-topologues made at two mountain observatories (IZO at 2370 m and TDE at 3550 m a.s.l.) on the island of Tenerife. We assume that the measurements made in the second half of the night are only very weakly affected by the local circu-lation on the island and represent the FT well. This assump-tion is consistent with previous studies of trace gases made on the island’s mountain and it is also consistent with the wide distribution of the H2O-δD pairs corresponding to the night-time observations. Thus, our measurements generate a unique continuous water vapour isotopologue data record for the lower/middle FT and can be used for studying free-tropospheric water pathways. In this paper we perform such a study and therefore combine the isotopologue data with back trajectory calculations and dust measurements.
The distribution of water vapour isotopologues collected during dust-free North Atlantic conditions show wide vari-ability. This variability has been analysed in the context of the last condensation point. The results show that the low-estδD values registered at IZO are found in relation to air
Figure 10.H2O-δD distributions as obtained for the four differ-ent moisture pathways that determine the free troposphere mois-ture budget in the surroundings of Tenerife (Left panel for IZO and right panel for TDE). Contour lines indicate the areas of highest data point density. The thin dashed and thick solid lines mark the areas that include 95 and 66 % of all data respectively. The differ-ent colour of the contour lines mark the differdiffer-ent pathways (1–4) as given in the legend. Rayleigh and mixing curves are plotted as in Figs. 5, 6, 8, and 9.
masses that have experienced condensation at lower temper-atures, and at higher latitudes and altitudes over the North Atlantic Ocean (TLC<250 K,>40◦N,<400 hPa). The con-densation at low temperatures is responsible for the dryness of the subtropical North Atlantic FT. These air masses seem to frequently experience mixing with more humid air masses during transport to the subtropical region. Moistening dur-ing subsidence was detected by analysdur-ing GDAS1/HYSPLIT data and identified in the measured H2O-δD distribution. Hu-mid air masses are also detected when the last condensa-tion takes place close to the surface at lower latitudes not far from the Canaries (>270 K,>600 hPa), whereby the ob-served H2O-δD distribution indicates rain re-evaporation or evaporation over a warm ocean as moisture source (increased depletion with respect to Rayleigh).
water vapour isotopologues at regions located to the west of the African continent provide new insights into the influence of the African continent on the moisture budget of the sub-tropical Northern Atlantic FT.
In summary, our results indicate that four different mois-ture transport pathways have to be considered in order to understand the subtropical North Atlantic moisture budget. While the dominant dryness of the region is determined by the mean subsidence of dry air from high altitudes of the extra-tropics (pathway 1), there are three main processes that moisten the FT over the Atlantic: horizontal mixing over the Atlantic with air from the Saharan Air Layer (pathway 2), transport of air from low altitudes (P >600 hPa) and lati-tudes (whereby humidity occasionally originates from rain-evaporation, pathway 3), and vertical mixing close to the Ca-naries (pathway 4).
Figure 10 gives an overview on the H2O-δD distribu-tions as observed when one of the four different pathways is clearly prevailing. It depicts the areas with the highest density of the observed H2O-δD pairs. Pathway 2 domi-nates when there is high aerosol load (dust>25 µg m−3or AOD>0.1, red contour lines). The other pathways domi-nate for low aerosol load (dust<2 µg m−3or AOD<0.02) and whenTLCand1H2O are situated within specific ranges.
Pathway 1 prevails forTLC<250 K and1H2O within±0.1 (grey contour lines). Pathway 3 prevails forTLC>270 K and 1H2O within±0.1 (green contour lines). Finally pathway 4 dominates for TLC<250 K and 1H2O>1.0 (blue con-tour lines). This pathway is mainly limited to altitudes be-low 3000 m a.s.l., and it is more frequently observed at IZO than at TDE. In the range of high humidity, pathways 2 and 4 are difficult to distinguish, because both pathways show the mixing product between dry and humid air masses. The use of aerosol measurements allows us to distinguish these two situations and also gives new insights into the properties of the air masses over the Sahara desert and their subsequent advection over the Atlantic Ocean.
Y. González et al.: Moisture pathways and H2O-δD pairs in the subtropical North Atlantic free troposphere 4263
Appendix A: Calibration procedure of Picarro instruments
A1 Mixing ratio calibration
Measurements of absolute humidity obtained from the me-teorological sensors have been used for correcting Pi-carro humidity measurements. The meteorological sta-tions are located close to respective Picarro inlets. The temperature and relative humidity of these stations have been used for calculating the water vapour pressure (e= esat·RH/100). The saturation vapour pressure is calcu-lated from the Magnus–Tetens formula (esat=6.1094· exp(17.625·T )/(243.04+T ), WMO, 2008).
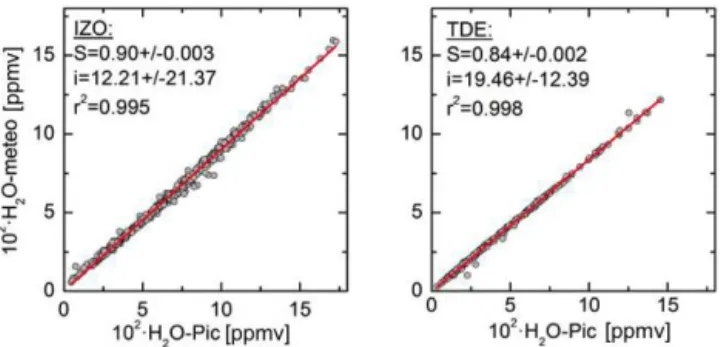
Figure A1 shows 1 h resolution of simultaneous measure-ments of humidity from the meteorological station and the Picarro at IZO and TDE stations respectively. The slope (S), intercept (i), and coefficient of determination (r2) of the lin-ear fit at each station are shown. The linlin-ear fit obtained at each station is applied for correcting the Picarro humidity measurements.
A2 Isotopic calibrations with the SDM system
Calibration measurements are carried out every 8–12 h by sequentially measuring the two working standards at three different water vapour mixing ratios of around 6000, 12 000, and 18 000 ppmv using a Picarro SDM. Therein, a micro-litre volume of liquid working standard is injected into a heated oven where it evaporates completely without fractionation. It is subsequently diluted into a flow of dry synthetic air. The amount of liquid working standard can be adjusted in a cer-tain range and, together with the flow rate of synthetic air, de-termine the humidity of the calibration gas mixture produced. This calibration gas mixture is then measured by the Picarro spectrometer for 20 min at each humidity level. A 6 min time interval is discarded between ambient and calibration mea-surements, as well as between different humidity levels and working standards. This allows for appropriate isotope and humidity exchange in the measurement cell of the Picarro spectrometer. The calibration procedure thus takes slightly over 2 h.
The calibration frequency, as well as the calibration hu-midity levels, have been modified slightly during the course of our measurements depending on demands during certain campaign periods. At TDE, the airflow is controlled by an electronic mass flow controller, while at IZO the flow is con-trolled by a rotameter. The reduced precision of this second device is translated in a larger variability of the calibration humidity at IZO in comparison to TDE (Fig. A2).
In order to apply the calibration gas measurements to our ambient measurements, we first filter out calibration measurements where any of the syringes of the SDM was clogged. We then analyse the humidity dependence of the measured raw isotope ratios during calibration, using the
Figure A1.Grey dots show the 1 h humidity data pairs of the Picarro and the meteorological at IZO and TDE. Red lines indicate the lin-ear fit of the distribution.S=slope,i=intercept,r2=coefficient of determination.
three recorded humidity levels. If a humidity dependence sig-nificantly larger than the precision of the calibration mea-surements was found, we would have to apply a correction function. This was not the case for our calibration measure-ments. Figure A3 shows an example measurement of hu-midity dependence ofδD at IZO and TDE stations respec-tively. An uncalibrated working standard was used in a bub-bler to saturate synthetic air with water vapour. This air was then diluted into a variable flow of synthetic air to produce a gas mixture of variable humidity. The data are averaged for 1 min, and the error bars denote the 1σ-standard deviation of theδD measurements. For low humidity measurements, where the instrument is most susceptible to a humidity de-pendence ofδD, the dependence remains within the scatter of the data (1σ standard deviation). Please also be aware that we use a Picarro L-2120i model. The Picarro models L-21xxi have significantly less dependency on humidity con-centrations than the Picarro models L-11xxi (e.g. Aemiseg-ger et al., 2012).
The stability of the humidity dependence for SDM calibra-tions along the whole study period is shown in the left col-umn of Fig. A2. We analyse the differences obtained from the regular calibrations made below and above 15 000 ppmv. No significant differences are observed along the humidity range covered with the SDM, being the 3σ below 0.8 ‰ at IZO (1.8 ‰ at TDE) (instrumental precision<0.5 ‰).
Figure A2.Difference between the measuredδD and that from the two liquid standards used for calibrating the instruments at IZO (first row) and TDE stations (second row). The left column depicts the dependence of this difference to the humidity during calibration. The right column shows the evolution of the difference with the time for all humidity levels.
Figure A3.Measured humidity dependence ofδD determined by measuring water vapour produced in a bubbler dilution system at IZO (left) and TDE (right) stations respectively. Data shown are 1 min averages. The error bars indicate the 1σ standard deviation of theδD measurements, within which the averageδD of each humidity bin (black symbols) are identical to the average of all data.
the uncertainty in slope (a) of the aforementioned calibration function is 2 ‰/100 ‰.
Each day, the data are calibrated with the resulting com-bination of the calibration at three different humidity points (no humidity dependence was found) and a linear fit between the responses of the two standards. The right column of this figure shows the time series of the SDM calibrations carried out at IZO and TDE stations (gaps are due to instrumenta-tion repairs). No temporal drifts are observed in the different time series, indicating that both Picarro instruments are very stable and consistent over time.
For the total uncertainty estimation we consider the instru-mental precision as well as uncertainty components:
a. uncertainty of the standards (0.7 ‰ for both dry and hu-mid air),
b. humidity dependence (from 0.3 ‰ for 10 000 ppmv, up to 8.0 ‰ at 200 ppmv),
c. extrapolation of VSMOW2-SLAP2 scale outside the range of calibration (for humid air:<2.0 ‰; up to 5 ‰ for strong depleted air),
Y. González et al.: Moisture pathways and H2O-δD pairs in the subtropical North Atlantic free troposphere 4265
Appendix B: Diurnal signals as seen in H2O-δD
distribution density plots
Figure 4 shows all the observed 10 min averaged H2O-δD data pairs, which is a large amount of data (about 75 000 and 40 000 data points at IZO and TDE respectively). From Fig. 4 it becomes clear that the IZO daytime observations cover only a limited area in the H2O-δD distribution space. There is no single IZO daytime observation withδD below −345 ‰ (and almost no daytime observations withδD below −220 ‰ for H2O above 10 000 ppmv). For TDE the situation is not clear from Fig. 4.
In order to give a statistical insight into the differences be-tween the H2O-δD distributions during day and night, we ad-ditionally calculate the density of the H2O-δD distributions for the daytime and night-time data pairs. The respective dis-tribution plots are shown in Fig. B1 and clearly confirm that for IZO the daytime and night-time H2O-δD distributions are significantly different. For TDE the day-night differences are less pronounced, but they become visible in the density plot (right panel of Fig. B1). For instance, at TDE the probabil-ity forδD being below−300 ‰ is significantly higher during night than during day (compare the areas marked by the thick black and orange lines).
Y. González et al.: Moisture pathways and H2O-δD pairs in the subtropical North Atlantic free troposphere 4267
Appendix C: Discussion of the representativeness of the usedTLCand1H2O parameters
There are two different reasons for a not perfect represen-tativeness: First, there is an uncertainty in the trajectories, which is the larger the longer the trajectory. Second, the model does not well resolve the fine structured topography of Tenerife, which might affect the flow of air masses and already the height attribution of the trajectories might be in-correct.
In our case, the trajectories are released at the height above sea level of the stations. We tested the uncertainty we could have in the representativeness of our backward trajectories by looking also in the backward trajectories released 500 m above and 500 m below. The data set describes those days in which last condensation has been observed along the path-ways at the three altitudes (only during the night-time pe-riod, 00:00 and 06:00 UTC), and we calculate for all tra-jectories the parameters TLC and 1H2O=log(H2Ot=0)− log(H2OLC).
Figure C1.A 3-year (2012–2014) analysis of the uncertainty in the vertical resolution of the model using TDE as reference station. The correlation betweenTLCat 3500 m with 3000 and 4000 m respectively, is shown.
Figure C2.A 3-year (2012–2014) analysis of the uncertainty in the vertical resolution of the model using TDE as reference station. The correlation between1H2O=log[H2Ot′=0]−log[H2OLC]at 3500 m with 3000 and 4000 m respectively, is shown.
The test is made for the TDE station and we correlate the parameters as obtained at 3500 m (altitude of the site), with the parameters as obtained at 4000 m (blue stars in Figs. C1 and C2) and 3000 m (red stars). The green line represents the diagonal (3500 m). The uncertainty test was carried out with 3 years of back trajectories (2012–2014). The Pearson’s coefficients obtained forTLCand1H2O (for each of the three TLCcategories) are shown in the figures.
Acknowledgements. This study has been conducted in the frame-work of the project MUSICA (MUlti-platform remote Sensing of Isotopologues for investigating the Cycle of Atmospheric water), funded by the European Research Council under the European Community’s Seventh Framework Programme (FP7/2007-2013/ ERC Grant agreement number 256961). We thank Dan Smale (NIWA, New Zealand) and the staff of Arrival Heights/Scott Base for providing the Antarctic ice water probes we used for prepar-ing our isotopologue standards. The isotopologue composition of the probes was kindly determined by LSCE-CEA, France. Aerosol measurements are part of the project POLLINDUST (CGL2011-26259), funded by the Minister of Economy and Com-petitiveness of Spain. The AERONET sun photometer at Izana (PI: Emilio Cuevas) has been calibrated within AERONET EUROPE TNA supported by the European Community Research Infrastruc-ture Action under the FP7 Capacities programme for Integrating Activities, ACTRIS grant agreement number 262254. Eliezer Sepúlveda is supported by the NOVIA project (Ministerio de Economía y Competitividad of Spain, CGL2012-37505). We thank the editor and the three anonymous referees for their very construc-tive input and their help in improving the presentation of our results.
Edited by: H. Wernli
References
Aemisegger, F., Sturm, P., Graf, P., Sodemann, H., Pfahl, S., Knohl, A., and Wernli, H.: Measuring variations of δ8O and δ2H in atmospheric water vapour using two commercial laser-based spectrometers: an instrument characterisation study, At-mos. Meas. Tech., 5, 1491–1511, doi:10.5194/amt-5-1491-2012, 2012.
Andrey, J., Cuevas, E., Parrondo, M., Alonso-Pérez, S., Re-dondas, A., and Gil-Ojeda, M.: Quantification of ozone reduc-tions within the Saharan air Layer through a 13-year climato-logic analysis of ozone profiles, Atmos. Environ., 84, 28–34, doi:10.1016/j.atmosenv.2013.11.030, 2013.
Basart, S., Pérez, C., Cuevas, E., Baldasano, J. M., and Gobbi, G. P.: Aerosol characterization in Northern Africa, Northeastern At-lantic, Mediterranean Basin and Middle East from direct-sun AERONET observations, Atmos. Chem. Phys., 9, 8265–8282, doi:10.5194/acp-9-8265-2009, 2009.
Bailey, A., Toohey, D., and Noone, D.: Characterizing moisture ex-change between the Hawaiian con- vective boundary layer and free troposphere using stable isotopes in water, J. Geophys. Res., 118, 8208–8221, doi:10.1002/jgrd.50639, 2013.
Bailey, A., Noone, D., Berkelhammer, M., Steen-Larsen, H. C., and Sato, P.: The stability and calibration of water vapor isotope ra-tio measurements during long-term deployments, Atmos. Meas. Tech., 8, 4521–4538, doi:10.5194/amt-8-4521-2015, 2015. Benetti, M., Reverdin, G., Pierre, C., Merlivat, L., Risi, C.,
Steen-Larsen, H. C., and Vimeux, F.: Deuterium excess in marine wa-ter vapor: Dependency on relative humidity and surface wind speed during evaporation, J. Geophys. Res.-Atmos., 119, 584– 593, doi:10.1002/2013JD020535, 2014.
Brown, D., Worden, J., and Noone, D.: Characteristics of tropical and subtropical atmospheric moistening derived from Lagrangian mass balance constrained by
measure-ments of HDO and H2O, J. Geophys. Res., 118, 54–72, doi:10.1029/2012JD018507, 2013.
Chiapello, I., Prospero, J., Herman, J., and Hsu, N.: Detection of mineral dust over the North Atlantic Ocean and Africa with the Nimbus 7 TOMS, J. Geophys. Res., 104, 9277–9291, doi:10.1029/1998JD200083, 1999.
Coplen, T. B.: Guidelines and recommended terms for expression of stable-isotope-ratio and gas-ratio measurement results, Rapid Commun. Mass Sp., 25, 2538–2560, doi:10.1002/rcm.5129, 2011.
Couhert, A., Schneider, T., Li, J., Waliser, D. E., and Tomp-kins, A. M.: The maintenance of the relative humidity of the subtropical free troposphere, J. Climate, 23, 390–403, doi:10.1175/2009JCLI2952.1, 2010.
Craig, H.: Standard for Reporting concentrations of Deuterium and Oxygen-18 in natural waters, Science, 13, 1833–1834, doi:10.1126/science.133.3467.1833, 1961.
Cuevas, E., González, Y., Rodríguez, S., Guerra, J. C., Gómez-Peláez, A. J., Alonso-Pérez, S., Bustos, J., and Milford, C.: As-sessment of atmospheric processes driving ozone variations in the subtropical North Atlantic free troposphere, Atmos. Chem. Phys., 13, 1973–1998, doi:10.5194/acp-13-1973-2013, 2013. Draxler, R. and Rolph, G.: HYSPLIT (HYbrid Single-Particle
Lagrangian Integrated Trajectory) Model Access Via NOAA ARL READY, NOAA Air ReSOURCEs Laboratory, Silver Spring, MD Website, available at: http://www.arl.noaa.gov/ ready/hysplit4.html (last access: June 2015), 2003.
Dyroff, C., Sanati, S., Christner, E., Zahn, A., Balzer, M., Bou-quet, H., McManus, J. B., González-Ramos, Y., and Schnei-der, M.: Airborne in situ vertical profiling of HDO/H216O in the subtropical troposphere during the MUSICA remote sens-ing validation campaign, Atmos. Meas. Tech., 8, 2037–2049, doi:10.5194/amt-8-2037-2015, 2015.
Galewsky, J. and Hurley, J. V.: An advection-condensation model for subtropical water vapour isotopic ratios, J. Geophys. Res., 115, D16116, doi:10.1029/2009JD013651, 2010.
Galewsky, J., Sobel, A., and Held, I.: Diagnosis of subtropical hu-midity dynamics using tracers of last saturation, J. Atmos. Sci., 62, 3353–3367, 2005.
García, O. E., Díaz, J. P., Expósito, F. J., Díaz, A. M., Dubovik, O., Derimian, Y., Dubuisson, P., and Roger, J.-C.: Shortwave radia-tive forcing and efficiency of key aerosol types using AERONET data, Atmos. Chem. Phys., 12, 5129–5145, doi:10.5194/acp-12-5129-2012, 2012.
Gómez-Peláez, A., Ramos, R., and Pérez-de la Puerta, J.: Methane and carbon dioxide continuous measurements at Izaña GAW station (Spain), in: GAW Report (No. 168) of the “13th WMO/IAEA Meeting of Experts on Carbon Dioxide Concen-tration and Related Tracers Measurement Techniques (Boul-der, Colorado, USA, 19–22 September 2005)”, edited by: Miller, J. B., World Meteorological Organization (TD No. 1359), available at: http://www.wmo.int/pages/prog/arep/gaw/ gaw-reports.html (last access: October 2014), 2006.
Y. González et al.: Moisture pathways and H2O-δD pairs in the subtropical North Atlantic free troposphere 4269
Holben, B. N., Eck, T. F., Slutsker, I., Tanré, D., Buis, J. P., Set-zer, A., Vermote, E., Reagan, J. A., Kaufman, Y. J., Nakajima, T., Lavenu, F., Jankowiak, I., and Smirnov, A.: AERONET – a fed-erated instrument network and data archive for aerosol character-ization, Remote Sens. Environ., 66, 1–16, 1998.
IAEA (International Atomic Energy Agency): Reference Sheet for VSMOW2 and SLAP2 international measurement standards, available at: https://nucleus.iaea.org/rpst/documents/vsmow2_ slap2.pdf (last access: January 2016), IAEA, 2009.
James, P., Stohl, A., Spichtinger, N., Eckhardt, S., and Forster, C.: Climatological aspects of the extreme European rainfall of Au-gust 2002 and a trajectory method for estimating the associated evaporative source regions, Nat. Hazards Earth Syst. Sci., 4, 733– 746, doi:10.5194/nhess-4-733-2004, 2004.
Johnson, D. G., Jucks, K. W., Trauba, W. A., and Chance, K. V.: Isotopic composition of stratospheric water vapor. Implications for transport, J. Geophys. Res., 106, 12219–12226, 2001. Millán, M. M., Salvador, R., Mantilla, E., and Kallos, G.:
Photoox-idant dynamics in the Mediterranean basin in summer: results from European research projects, J. Geophys. Res., 102, 8811– 8823, 1997.
Millán, M. M., Estrella, M., Sanz, M., Mantilla, E., Martín, M., Pastor, F., Salvador, R., Vallejo, R., Alonso, L., Gangotti, G., Ilardia, J., Navazo, M., Albizuri, A., Artiñano, B., Ciccioli, P., Kallos, G., Carvalho, R., Andrés, D., Hoff, A., Werhan, J., Seufert, G., and Versino, B.: Climatic feedbacks and desertifi-cation: the mediterranean model, J. Climate, 18, 684–701, 2004. Noone, D., Galewsky, J., Sharp, Z., Worden, J., Barnes, J., Baer, D., Bailey, A., Brown, D., Christensen, L., Crosson, E., Dong, F., Hurley, J., Johnson, L., Strong, M., Toohey, D., Van Pelt, A., and Wright, J.: Properties of air mass mixing and humidity in the subtropics from measurements of the D/H isotope ratio of wa-ter vapor at the Mauna Loa Observatory, J. Geophys. Res., 116, D22113, doi:10.1029/2011JD015773, 2011.
Palmén, E. and Newton, C.: Atmospheric Circulation Systems: Their Structure and Physical Interpretation, Int. Geophys. Ser., 13, Academic Press, New York, 603 pp., 1969.
Pierrehumbert, R.: Lateral mixing as a source of subtropical tropo-spheric water vapour, Geophys. Res. Lett., 25, 151–154, 1998. Prospero, J., Ginoux, P., Torres, O., Nicholson, S. E., and
Gill, T. E.: Environmental characterization of global sources of dust with the Nimbus 7 total ozone mapping spectrometer (TOMS) absorbing aerosol product, Rev. Geophys., 40, 2.1–2.31, doi:10.1029/2000RG000095, 2002.
Risi, C., Bony, S., Vimeux, F., Frankenberg C., Noone, D., and Wor-den, J.: Understanding the Sahelian water budget through the iso-topic composition of water vapor and precipitation, J. Geophys. Res., 115, D24110, doi:10.1029/2010JD014690, 2010.
Risi, C., Noone, D., Worden, J., Frankenberg, C., Stiller, G., Kiefer, M., Funke, B., Walker, K., Bernath, P., Schneider, M., Bony, S., Lee, J., Brown, D., and Sturm, C.: Process-evaluation of tropospheric humidity simulated by general circulation mod-els using water vapour isotopic observations: 2. Using isotopic diagnostics to understand the mid and upper tropospheric moist bias in the tropics and subtropics, J. Geophys. Res., 117, D05304, doi:10.1029/2011JD016623, 2012.
Rodríguez, S., González, Y., Cuevas, E., Ramos, R., Romero, P. M., Abreu-Afonso, J., and Redondas, A.: Atmospheric nanoparti-cle observations in the low free troposphere during upward
oro-graphic flows at Izaña Mountain Observatory, Atmos. Chem. Phys., 9, 6319–6335, doi:10.5194/acp-9-6319-2009, 2009. Rodríguez, S., Alastuey, A., Alonso-Pérez, S., Querol, X.,
Cuevas, E., Abreu-Afonso, J., Viana, M., Pérez, N., Pandolfi, M., and de la Rosa, J.: Transport of desert dust mixed with North African industrial pollutants in the subtropical Saharan Air Layer, Atmos. Chem. Phys., 11, 6663–6685, doi:10.5194/acp-11-6663-2011, 2011.
Rodríguez, S., Alastuey, A., and Querol, X.: A review of methods for long term in situ characterization of aerosol dust, Aeolian Res., 6, 55–74, doi:10.1016/j.aeolia.2012.07.004, 2012. Rodríguez, S., Cuevas, E., Prospero, J. M., Alastuey, A., Querol, X.,
López-Solano, J., García, M. I., and Alonso-Pérez, S.: Modu-lation of Saharan dust export by the North African dipole, At-mos. Chem. Phys., 15, 7471–7486, doi:10.5194/acp-15-7471-2015, 2015.
Rolph, G., Ngan, F., and Draxler, R.: Modeling the fallout from sta-bilized nuclear clouds using the HYSPLIT atmospheric disper-sion model, J. Environ. Radioactiv., 136, 41–55, 2014.
Samuels-Crow, K. E., Galewsky, J., Sharp, Z. D., and Den-nis, K. J.: Deuterium excess in subtropical free troposphere water vapor: continuous measurements from the Chajnantor Plateau, northern Chile, Geophys. Res. Lett., 41, 8652–8659, doi:10.1002/2014GL062302, 2014.
Schneider, M., González, Y., Dyroff, C., Christner, E., Wiegele, A., Barthlott, S., García, O. E., Sepúlveda, E., Hase, F., Andrey, J., Blumenstock, T., Guirado, C., Ramos, R., and Rodríguez, S.: Empirical validation and proof of added value of MUSICA’s tro-posphericδD remote sensing products, Atmos. Meas. Tech., 8, 483–503, doi:10.5194/amt-8-483-2015, 2015.
Sodemann, H., Schwierz, C., and Wernli, H.: Interannual variability of Greenland winter precipitation sources: lagrangian moisture diagnostic and North Atlantic Oscillation influence, J. Geophys. Res., 113, D03107, doi:10.1029/2007JD008503, 2008.
Steen-Larsen, H. C., Sveinbjörnsdottir, A. E., Peters, A. J., Masson-Delmotte, V., Guishard, M. P., Hsiao, G., Jouzel, J., Noone, D., Warren, J. K., and White, J. W. C.: Climatic controls on wa-ter vapor deuwa-terium excess in the marine boundary layer of the North Atlantic based on 500 days of in situ continuous measure-ments, Atmos. Chem. Phys., 14, 7741–7756, doi:10.5194/acp-14-7741-2014, 2014.
Steen-Larsen, H. C., Sveinbjörnsdottir, A. E., Jonsson, Th., Rit-ter, F., Bonne, J.-L., Masson-Delmotte, V., Sodemann, H., Blu-nier, T., Dahl-Jensen, D., and Vinther, B. M.: Moisture sources and synoptic to seasonal variability of North Atlantic water vapor isotopic composition, J. Geophys. Res.-Atmos., 120, 5757–5774, doi:10.1002/2015JD023234, 2015.
Tremoy, G., Vimeux, F., Mayaki, S., Souley, I., Cattani, O., Risi, C., Favreau, G., and Oi, M.: A 1 year long 18O record of wa-ter vapor in Niamey (Niger) reveals insightful atmospheric pro-cesses at different timescales, Geophys. Res. Lett., 39, L08805, doi:10.1029/2012GL051298, 2012.