ACPD
13, 15377–15407, 2013Free troposphere ozone and carbon monoxide over the
North Atlantic
A. Kumar et al.
Title Page
Abstract Introduction
Conclusions References
Tables Figures
◭ ◮
◭ ◮
Back Close
Full Screen / Esc
Printer-friendly Version Interactive Discussion
Discussion
P
a
per
|
Dis
cussion
P
a
per
|
Discussion
P
a
per
|
Discussio
n
P
a
per
|
Atmos. Chem. Phys. Discuss., 13, 15377–15407, 2013 www.atmos-chem-phys-discuss.net/13/15377/2013/ doi:10.5194/acpd-13-15377-2013
© Author(s) 2013. CC Attribution 3.0 License.
Atmospheric Chemistry and Physics
Open Access
Discussions
Geoscientific Geoscientific
Geoscientific Geoscientific
This discussion paper is/has been under review for the journal Atmospheric Chemistry and Physics (ACP). Please refer to the corresponding final paper in ACP if available.
Free troposphere ozone and carbon
monoxide over the North Atlantic for
2001–2011
A. Kumar1, S. Wu1,2, M. F. Weise1,*, R. Honrath1,†, R. C. Owen3, D. Helmig4, L. Kramer2, M. Val Martin5, and Q. Li6
1
Department of Civil & Environmental Engineering, Michigan Technological University, Houghton, Michigan, USA
2
Department of Geological and Mining Engineering and Sciences, Michigan Technological University, Houghton, Michigan, USA
3
US EPA, Research Triangle Park, North Carolina, USA 4
Institute of Alpine and Arctic Research, University of Colorado at Boulder, Boulder, Colorado, USA
5
Department of Atmospheric Sciences, Colorado State University, Fort Collins, Colorado, USA 6
Department of Atmospheric & Oceanic Sciences, University of California Los Angeles, Los Angeles, California, USA
*
now at: ARCADIS, Novi, Michigan, USA
†
ACPD
13, 15377–15407, 2013Free troposphere ozone and carbon monoxide over the
North Atlantic
A. Kumar et al.
Title Page
Abstract Introduction
Conclusions References
Tables Figures
◭ ◮
◭ ◮
Back Close
Full Screen / Esc
Printer-friendly Version Interactive Discussion
Discussion
P
a
per
|
Dis
cussion
P
a
per
|
Discussion
P
a
per
|
Discussio
n
P
a
per
|
Received: 14 May 2013 – Accepted: 23 May 2013 – Published: 11 June 2013
Correspondence to: A. Kumar ([email protected])
ACPD
13, 15377–15407, 2013Free troposphere ozone and carbon monoxide over the
North Atlantic
A. Kumar et al.
Title Page
Abstract Introduction
Conclusions References
Tables Figures
◭ ◮
◭ ◮
Back Close
Full Screen / Esc
Printer-friendly Version Interactive Discussion
Discussion
P
a
per
|
Dis
cussion
P
a
per
|
Discussion
P
a
per
|
Discussio
n
P
a
per
|
Abstract
In-situ measurements of carbon monoxide (CO) and ozone (O3) at the Pico Mountain
Observatory (PMO) located in the Azores, Portugal are analyzed together with results from atmospheric chemical transport modeling (GEOS-Chem) and satellite remote sensing (AIRS for CO and TES for O3) to examine the evolution of free-troposphere
5
CO and O3over the North Atlantic for 2001–2011. GEOS-Chem captured the seasonal
cycles for CO and O3well but significantly underestimated the mixing ratios of CO, par-ticularly in spring. Statistically significant (using a significance level of 0.05) decreasing trends were found for both CO and O3 based on harmonic regression analysis of the
measurement data. The best estimates of the trend for CO and O3measurements are 10
−0.31±0.30 (2-σ) ppbv yr−1and−0.21±0.11 (2-σ) ppbv yr−1, respectively. Similar de-creasing trends for both species were obtained with GEOS-Chem simulation results. The major factor contributing to the reported decrease in CO and O3 mixing ratios at PMO over the past decade is the decline in anthropogenic CO and O3-precursor
emis-sions in regions such as North America and Europe. The increase in Asian emisemis-sions 15
does not seem to outweigh the impact of these declines resulting in overall decreas-ing trends for both CO and O3. For O3, however, increase in atmospheric water
va-por content associated with climate change also appears to be a contributing factor causing enhanced destruction of the O3 during transport from source regions. These hypotheses are supported by results from the GEOS-Chem tagged CO and tagged O3 20
simulations.
1 Introduction
Carbon monoxide (CO) and ozone (O3) are important atmospheric pollutants in the
tro-posphere (Seinfield and Pandis, 2006). The major sources of atmospheric CO include incomplete combustion of fossil fuels (Holloway et al., 2000; Khalil and Rasmussen, 25
ACPD
13, 15377–15407, 2013Free troposphere ozone and carbon monoxide over the
North Atlantic
A. Kumar et al.
Title Page
Abstract Introduction
Conclusions References
Tables Figures
◭ ◮
◭ ◮
Back Close
Full Screen / Esc
Printer-friendly Version Interactive Discussion
Discussion
P
a
per
|
Dis
cussion
P
a
per
|
Discussion
P
a
per
|
Discussio
n
P
a
per
|
the oxidation of volatile organic compounds (VOCs) by the hydroxyl radical (OH). O3 is formed in the troposphere through photochemical reactions in the presence of O3
precursors which include the nitrogen oxides (NO+NO2=NOx), CO and VOCs. The
dominant loss pathway for tropospheric O3is photolysis followed by reaction with water vapor.
5
Atmospheric transport across the North Atlantic Ocean carries air pollutants from the continent of North America towards Europe. CO has a chemical lifetime of several months (Seinfeld and Pandis, 2006) and the lifetime for O3is 2–4 weeks in the
tropo-sphere (Law, 2010). These relatively long lifetimes enable these species to undergo intercontinental transport. Thus, changes in emissions from source regions (such as 10
North America) can have significant implications for atmospheric composition in down-wind regions such as North Atlantic or Europe. Li et al. (2002) found that 20 % of summer violations of O3air quality standards in Europe would not have occurred in the
absence of North American anthropogenic emissions.
Increases in anthropogenic emissions of NOx, CO and VOCs have led to increases
15
in free tropospheric O3since pre-industrial times (Wang et al., 1998) although several
studies have reported divergent trends of tropospheric O3over different regions of the Northern Hemisphere (Brunke et al., 1998; Fusco and Logan, 2003; Guicherit and Roemer, 2000; Jaffe et al., 2003; Lee et al., 1998; Oltmans et al., 2006). Over the past decade, emissions of O3 precursors have declined significantly in North America 20
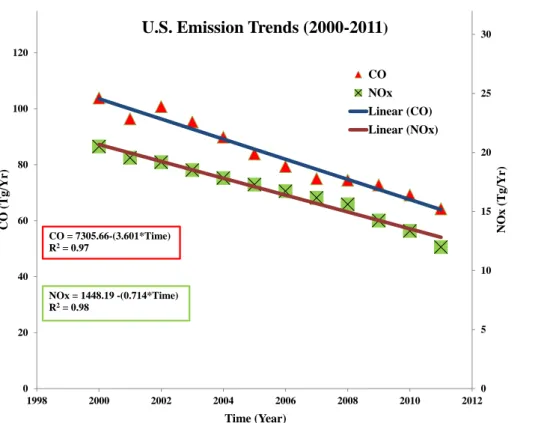
and Europe, while those in Asia have increased (Hudman et al., 2009; Vingarzan, 2004). Figure 1 shows the trends of anthropogenic emissions of CO and NOx in the
United States (US) from 2000–2011. US sources account for approximately 80 % of anthropogenic emissions from North America (Wang et al., 2009). These changes in emissions are expected to influence the free troposphere CO and O3 concentrations
25
ACPD
13, 15377–15407, 2013Free troposphere ozone and carbon monoxide over the
North Atlantic
A. Kumar et al.
Title Page
Abstract Introduction
Conclusions References
Tables Figures
◭ ◮
◭ ◮
Back Close
Full Screen / Esc
Printer-friendly Version Interactive Discussion
Discussion
P
a
per
|
Dis
cussion
P
a
per
|
Discussion
P
a
per
|
Discussio
n
P
a
per
|
continuous in-situ measurements of CO and O3 at this station and results from the Goddard Earth Observing System chemical (GEOS-Chem) transport model to examine the trends in free-tropospheric CO and O3over the North Atlantic for the past decade.
2 Measurement data
2.1 Measurements at the Pico Mountain Observatory
5
The Pico Mountain Observatory (PMO, formerly called PICO-NARE) is located on the summit of Pico Mountain on the Pico island in the Azores, Portugal (38◦28′N, 28◦24′W) at an altitude of 2225 m (Honrath et al., 2004). The station during most times receives air characteristic of the lower free troposphere (FT) and is well above the Ma-rine Boundary Layer (MBL) during summertime. The island population is low (around 10
15 000) and is concentrated near sea level which results in the site having negligible anthropogenic influence on the free troposphere composition, although upslope flows have been found to occur resulting in the transport of low-altitude air to the mountain-top (Kleissl et al., 2007). However, the occurrence of such flow is not very frequent and even when it occurs it was found that the air did not originate from the surface (Kleissl 15
et al., 2007).
The station is also frequently impacted by export of North American pollution dur-ing summertime and outflow from arctic and subarctic regions resultdur-ing in transport of biomass burning emissions from Canada, Alaska and Siberia (Honrath et al., 2004; Val Martin et al., 2008a). Val Martin et al. (2006) reported that North American boreal wild-20
fires contributed significantly to enhancements in CO and O3background mixing ratios during the summer of 2004. Honrath et al. (2004) observed frequent enhancements in CO levels above the marine background levels during the summertime in 2001–2003 which they attributed to North American pollution outflow or long-range transport of biomass burning emissions. High levels of both CO and O3were observed during the 25
ACPD
13, 15377–15407, 2013Free troposphere ozone and carbon monoxide over the
North Atlantic
A. Kumar et al.
Title Page
Abstract Introduction
Conclusions References
Tables Figures
◭ ◮
◭ ◮
Back Close
Full Screen / Esc
Printer-friendly Version Interactive Discussion
Discussion
P
a
per
|
Dis
cussion
P
a
per
|
Discussion
P
a
per
|
Discussio
n
P
a
per
|
CO and O3 have been measured at PMO using instruments described in Honrath et al. (2004). We use hourly CO data covering 2001–2010 and O3data spanning 2001–
2011 with most of the available data spanning May–September. Only days with full 24 h data availability were used to calculate the daily average mixing ratios of CO and O3. These data account for approximately 76 % (87 %) of the total CO (O3) measurements
5
available from the station.
2.2 AIRS/AQUA data for CO
The Atmospheric Infrared Sounder (AIRS) was launched onboard the AQUA satel-lite on 4 May 2002. It is a polar orbiting nadir-viewing thermal IR sounder with cloud clearing capability and retrieves CO at 4.7 microns with 70 % daily global coverage; 10
100 % between 45◦ and 80◦ longitude (McMillan et al., 2005; Yurganov et al., 2008). We use AIRS level 3 version 5 monthly data obtained from Giovanni, Goddard Earth Sciences Data and Information Services Center (GES DISC). Data are available at http://disc.sci.gsfc.nasa.gov/giovanni#instances (Acker and Leptoukh, 2007). Level 3 datasets have undergone rigorous processing and are available with no subsequent 15
processing required. As done in prior studies, AIRS measurements with more than 0.5 degrees of freedom (Fisher et al., 2010) were included in the analysis. Previous comparisons of AIRS with in-situ measurements reveal a positive bias of∼10 % in the Northern Hemisphere (Fisher et al., 2010; Kopacz et al., 2010). Retrievals for the area matching the same horizontal grid as GEOS-Chem over PMO (32.5 to 27.5◦W and 36 20
to 40◦N) centered at 802 hPa (roughly 2.2 km, the same elevation as PMO) are used in this study. Since both the measurement data at PMO and GEOS-Chem use both day and night values, day and night retrievals are used for AIRS as well.
2.3 TES/Aura data for O3
The Tropospheric Emission Spectrometer (TES) was launched in July 2004 aboard the 25
ACPD
13, 15377–15407, 2013Free troposphere ozone and carbon monoxide over the
North Atlantic
A. Kumar et al.
Title Page
Abstract Introduction
Conclusions References
Tables Figures
◭ ◮
◭ ◮
Back Close
Full Screen / Esc
Printer-friendly Version Interactive Discussion
Discussion
P
a
per
|
Dis
cussion
P
a
per
|
Discussion
P
a
per
|
Discussio
n
P
a
per
|
and maintained by the NASA GES DISC as mentioned above (Sect. 2.2). TES is nadir viewing in a polar orbiting sun synchronous orbit on the same track as AIRS/Aqua with a local crossing time of 01:45 and 13:45 (Zhang et al., 2010). We use available data for the period covering 2005–2010 in this study. The data for 2008–2009 were not available. The level three data used were pre-processed and all negative values 5
were filtered out. Previous comparisons with in-situ measurements show that TES has a positive bias of 5.3 ppbv for O3at 500 hPa (Zhang et al., 2010).
3 Model description
We use GEOS-Chem, a global three-dimensional model of tropospheric chemistry driven by assimilated meteorological observations from the Goddard Earth Observ-10
ing System (GEOS) of the NASA Global Modeling Assimilation Office (Bey et al., 2001; Fairlie et al., 2007; Evans and Jacob, 2005; Martin et al., 2002; Park et al., 2004) to sim-ulate the evolution of atmospheric composition in the past decade. The model has fully coupled O3–NOx–VOC-aerosol chemistry and has been extensively evaluated and
ap-plied to a wide range of research topics related to atmospheric chemistry and air quality 15
(e.g., Duncan et al., 2007; Evans and Jacob, 2005; Martin et al., 2002; Park et al., 2004; Wu et al., 2007). There have been different versions of the GEOS meteorology includ-ing GEOS-3, GEOS-4 and GEOS-5 with each spanninclud-ing different periods. GEOS-5 is the latest version covering the period 2004–2011. Available horizontal grid resolu-tions in the model range from 4◦×5◦ to 0.5◦×0.667◦ (latitude×longitude). Emission 20
inventories in GEOS-Chem cover various sources including anthropogenic, biomass burning, biofuel and biogenic emissions. Anthropogenic emissions follow the Emis-sions Database for Global Atmospheric Research (EDGAR) global inventory (Olivier and Berdowski, 2001) and are updated with regional inventories including the US EPA National Emissions Inventory (EPA/NEI05 and EPA/NEI99), the Environment Canada 25
ACPD
13, 15377–15407, 2013Free troposphere ozone and carbon monoxide over the
North Atlantic
A. Kumar et al.
Title Page
Abstract Introduction
Conclusions References
Tables Figures
◭ ◮
◭ ◮
Back Close
Full Screen / Esc
Printer-friendly Version Interactive Discussion
Discussion
P
a
per
|
Dis
cussion
P
a
per
|
Discussion
P
a
per
|
Discussio
n
P
a
per
|
2003, 2006; Zhang et al., 2009) and the Big Bend Regional Aerosol and Visibility Observational (BRAVO) study emissions inventory for Mexico and some neighboring US states. The biomass burning emissions follow either the Global Fire Emissions Database (GFED) v2 (1997–2008) (Van Der Werf et al., 2006) or GFEDv3 (1997– 2010) monthly inventories (Van Der Werf et al., 2010) and biogenic VOC emissions 5
are taken from the Model of Emissions of Gases and Aerosols from Nature (MEGAN) global inventory. Emissions from other natural sources (e.g. lightning, volcanoes) are also included. For chemistry, either the Kinetic Pre-Processor (KPP) (Eller et al., 2009; Sandu and Sander, 2006) or the SPARSE MATRIX VECTORIZED GEAR 2 (SMVGEAR 2) (Eller et al., 2009) chemistry solver can be used. The Linearized Ozone (LINOZ) 10
mechanism (McLinden et al., 2000) is used for the stratosphere-troposphere exchange of O3.
In addition to the standard full chemistry simulations with GEOS-Chem, we also carry out special tagged simulations (tagged CO and tagged O3simulations) to better identify the contributions to CO and O3 at PMO from various source regions. A brief
15
description of the simulations used in this study and the archived data is provided in the following sections.
3.1 Full chemistry simulations used
The full chemistry simulations using the standard version of GEOS-Chem (with the SMVGEAR 2 chemical solver) with normal emissions are referred here as FCNE sim-20
ulations. We used the 4◦×5◦(latitude×longitude) horizontal resolution and a one year spin up for all the FCNE simulations. GEOS-4 meteorology fields were used for 2001– 2004 whereas those from GEOS-5 version covered the period from 2005 onwards. Re-gional emission inventories for anthropogenic (fossil fuel and biofuel) emissions were used over Canada (CAC inventory), Mexico (BRAVO), Asia (Streets), USA (NEI2005 25
ACPD
13, 15377–15407, 2013Free troposphere ozone and carbon monoxide over the
North Atlantic
A. Kumar et al.
Title Page
Abstract Introduction
Conclusions References
Tables Figures
◭ ◮
◭ ◮
Back Close
Full Screen / Esc
Printer-friendly Version Interactive Discussion
Discussion
P
a
per
|
Dis
cussion
P
a
per
|
Discussion
P
a
per
|
Discussio
n
P
a
per
|
MEGAN scheme (Guenther et al., 2006). For biomass burning emissions, the GFEDv2 monthly inventory was used (as the GFEDv3 inventory was not available with the model version (v8-03-01) used). Model simulated CO and O3 mixing ratios for the grid box
covering PMO were archived with a 4 h temporal resolution.
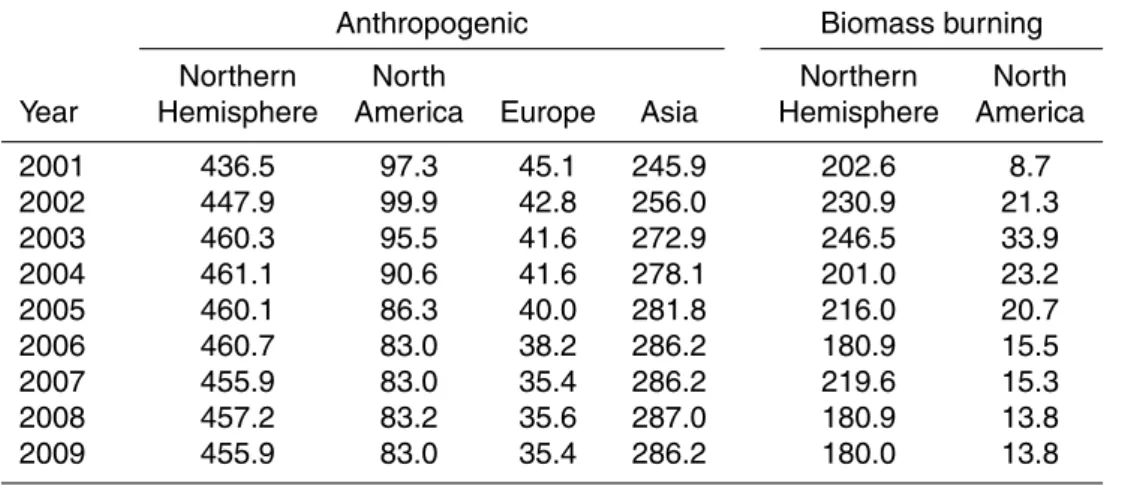
Table 1 summarizes the anthropogenic and biomass burning CO emissions in 5
GEOS-Chem for various regions of the Northern Hemisphere for 2001–2009. The model shows significant declines in anthropogenic CO for North America and Europe but increases from Asia during this time period.
A sensitivity run was also performed to assess the impact of North American fossil fuel combustion on CO and O3at PMO by excluding those emissions. This run had no 10
fossil fuel emissions for the region covering the US, Canada and Mexico (15 to 88◦N (latitude) and 50 to 165◦W (longitude)).
3.2 Tagged CO simulation
The GEOS-Chem tagged CO simulation was used to determine the contribution to CO mixing ratios at PMO from various geographical regions (e.g. Asia, North America) 15
and sources (e.g. biomass burning, biofuels). It is one of the several offline simulations included in GEOS-Chem and consists of source/region-specific CO tracers. The CO sources accounted for include fossil fuels, biofuels, biomass burning, anthropogenic and biogenic VOCs. A detailed description can be found in Duncan et al. (2007). The reaction of CO with OH is the only sink considered. We used v9-01-02 of the model 20
with the 4◦×5◦ (latitude×longitude) horizontal resolution. For this simulation, emis-sion inventories included to account for anthropogenic CO production were the global EDGAR inventory, CAC inventory over Canada, BRAVO over Mexico, EPA/NEI99 over North America, Streets over South-East Asia and the RETRO (for global anthropogenic VOCs) inventory. For biomass burning emissions, the monthly GFEDv3 emissions 25
ACPD
13, 15377–15407, 2013Free troposphere ozone and carbon monoxide over the
North Atlantic
A. Kumar et al.
Title Page
Abstract Introduction
Conclusions References
Tables Figures
◭ ◮
◭ ◮
Back Close
Full Screen / Esc
Printer-friendly Version Interactive Discussion
Discussion
P
a
per
|
Dis
cussion
P
a
per
|
Discussion
P
a
per
|
Discussio
n
P
a
per
|
zero initial concentrations for all the tracers) for the period 2001–2004 (using GEOS-4) until steady state concentrations were reached. For the run with GEOS-5 (2005–2010), a one year spin up (January–December 2004) was used. The data archived consists of the time-series of 4 hourly instantaneous values of all the CO tracers at PMO from 2001–2010.
5
3.3 Tagged O3simulation
The tagged O3 simulation was used to attribute the O3 mixing ratios at PMO to O3
production from various regions. It uses chemical production/loss rates of O3archived from the FCNE simulation. We used version 09-01-02 of GEOS-Chem (horizontal res-olution 4◦×5◦(latitude×longitude)) for this simulation and the same version was also 10
used to archive the O3production/loss rates from 2000–2011. Restart files were gener-ated in the same manner as for the tagged CO simulation. The time-series of 4 hourly instantaneous values of all the tracers was archived from 2001–2011 for the location and altitude corresponding to PMO.
4 Seasonal variation of CO and O3at PMO
15
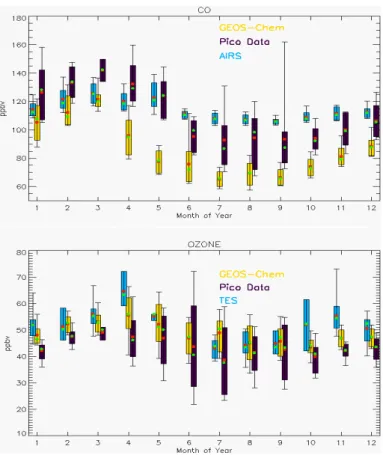
The box plot in Fig. 2 shows the seasonal variation of CO and O3at PMO from
ground-based in situ measurements, satellite retrievals and GEOS-Chem model simulations. Daily (24 h) average values for CO and O3 from the whole-year period of
Septem-ber 2004 to August 2005 were used to construct the box plot as this period has the best data availability for the measurements. Both CO and O3 show maxima in the 20
ACPD
13, 15377–15407, 2013Free troposphere ozone and carbon monoxide over the
North Atlantic
A. Kumar et al.
Title Page
Abstract Introduction
Conclusions References
Tables Figures
◭ ◮
◭ ◮
Back Close
Full Screen / Esc
Printer-friendly Version Interactive Discussion
Discussion
P
a
per
|
Dis
cussion
P
a
per
|
Discussion
P
a
per
|
Discussio
n
P
a
per
|
underestimates the mixing ratios of CO (by 20–30 ppbv) throughout the year which possibly reflects some low biases in the CO emission inventories. The underestimation of CO by the model has been reported by previous studies (Bey et al., 2001; Duncan and Logan, 2008; Duncan et al., 2007; Val Martin et al., 2008b) as well. In contrast, GEOS-Chem reproduces both the seasonal variation and magnitude of O3very well.
5
5 General long term trends of CO and O3at PMO
5.1 Trend analysis methodology
Two-sided parametric hypothesis testing (null hypothesis of no trend and alternate hy-pothesis of non-zero trend) was used to analyze the trends in CO and O3mixing ratios at PMO for 2001–2011. We employed a multiple regression model that is similar to 10
the additive model of a time-series and contains sinusoidal functions to represent the characteristic seasonal variations of both CO and O3. The sinusoidal functions use a time period of one year to reflect the seasonal variations of CO and O3. A linear term
in time was used to represent the long term trend in CO or O3. Following Helsel and
Hirsch (2002), we express the model for daily average values of CO or O3as: 15
Ct=a0+a1t+a2sin
2πt
365
+a3cos
2πt
365
+εt (1)
Where:
Ct: Mixing ratio of the species at a timet(in days of year) (time being measured from a reference year (1 January 1900 in this case))
a0,a1,a2,a3: regression coefficients 20
εt: residual from the model
ACPD
13, 15377–15407, 2013Free troposphere ozone and carbon monoxide over the
North Atlantic
A. Kumar et al.
Title Page
Abstract Introduction
Conclusions References
Tables Figures
◭ ◮
◭ ◮
Back Close
Full Screen / Esc
Printer-friendly Version Interactive Discussion
Discussion
P
a
per
|
Dis
cussion
P
a
per
|
Discussion
P
a
per
|
Discussio
n
P
a
per
|
in the regression equation were determined by the least squares method and the sta-tistical significance of thet statistic corresponding to the slope term was examined by comparing the probability of observing at statistic of same or greater magnitude with the null hypothesis being true (pvalue) with the significance levelα (0.05 used for this study).
5
5.2 Trends obtained from PMO data and GEOS-Chem results
The regression model in Eq. (1) was applied to the time-series of CO and O3 (for
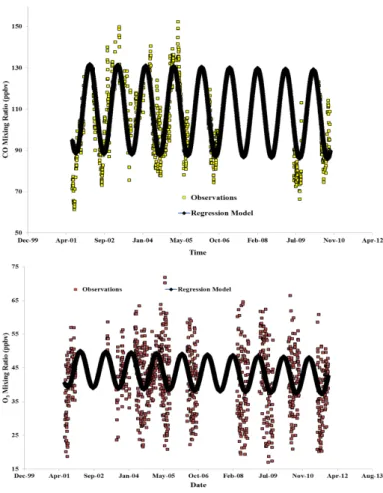
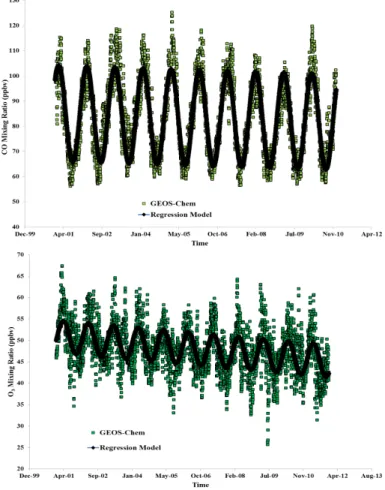
both the in-situ measurements and GEOS-Chem FCNE simulation output) at PMO. Table 2 lists the trends for both the measurement data and GEOS-Chem output along with the associatedp values. Figure 3 shows the regression fits for the CO and O3
10
measurements and Fig. 4 contains the fits for the modeled (GEOS-Chem FCNE sim-ulation) CO and O3. The observations show statistically significant decreasing trends for both the species over the study period with CO showing a decrease of−0.31±0.30 (2-σ) ppbv yr−1 (p value=0.04) and O3 decreasing by −0.21±0.11 (2-σ) ppbv yr
−1
(p value<0.001). GEOS-Chem also shows statistically significant decreasing trends 15
for both CO (−0.34±0.08 (2-σ) ppbv yr−1,p value<0.001) and O3 (−0.53±0.04
(2-σ) ppbv yr−1,pvalue<0.001).
These decreasing trends are in agreement with those obtained from observa-tion data at other staobserva-tions in the North Atlantic such as Tudor Hill, Bermuda (TH) and Mace Head, Ireland (MH) (data available at http://ds.data.jma.go.jp/gmd/wdcgg/ 20
cgi-bin/wdcgg/catalogue.cgi). For TH, the harmonic regression analysis of O3 mix-ing ratios from 2003–2011 yields a statistically significant decreasmix-ing trend (pvalue<
0.001) of 1.1±0.11 (2-σ) ppbv yr−1, whereas CO at MH (2001–2011) shows a statisti-cally significant decreasing trend (−1.4±0.20 (2-σ) ppbv yr−1,pvalue<0.001) as well. However, measurements at Izana, Tenerife (IT) (data available at http://ds.data.jma. 25
ACPD
13, 15377–15407, 2013Free troposphere ozone and carbon monoxide over the
North Atlantic
A. Kumar et al.
Title Page
Abstract Introduction
Conclusions References
Tables Figures
◭ ◮
◭ ◮
Back Close
Full Screen / Esc
Printer-friendly Version Interactive Discussion
Discussion
P
a
per
|
Dis
cussion
P
a
per
|
Discussion
P
a
per
|
Discussio
n
P
a
per
|
the fact that it is further south and less affected by the continental outflow from North America.
Previous studies such as Lelieveld et al. (2004) and Derwent et al. (2007) have reported upward trends in O3 over the North Atlantic for the periods 1977–2002 and
1987–2007, respectively. The discrepancy appears largely due to the different time 5
frame used in these studies. This factor is exemplified by the different trends observed for O3 at TH (increasing trend of 0.70±0.10 (2-σ) ppbv yr
−1
,p value<0.001) for the earlier decade of 1988–1998 as compared to the decreasing trend for 2003–2011.
One of the major factors that could lead to a decrease in CO and O3 mixing ratios
over the North Atlantic is the decline in anthropogenic emissions from North Amer-10
ica (of which 80 % emissions are from the US) in the past decade. The trends for US anthropogenic emissions of CO and NOx are shown in Fig. 1. In order to investigate
this hypothesis we first carried out sensitivity runs by turning offNorth American fossil fuel emissions in the model (Sect. 3.1) to derive the contribution of North American anthropogenic emissions to CO and O3 at PMO. Our results show that the
anthro-15
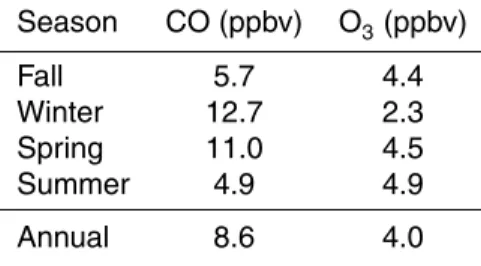
pogenic emissions from North America enhance the annual means of CO and O3 at
PMO by 8.6 and 4.0 ppbv yr−1, respectively (Table 3). Also, Fig. 1 shows that the US CO emissions have declined approximately by a factor of 1/3 and assuming a linear cor-respondence between the US emissions and their contribution to CO mixing ratios at PMO, this would amount to a decrease of approximately 2.9 ppbv in the CO at the sta-20
tion (over the past decade). This change is similar to that obtained from the harmonic regression analysis of CO measurements at PMO, suggesting that the decline in the CO at the station correlates particularly well with the US emission declines. For CO, the largest contribution from North American emissions was found in the winter and spring, which reflects stronger atmospheric transport and longer chemical lifetimes of 25
CO (due to low levels of OH) during those seasons, as previously noted by (Val Martin et al., 2008b). In contrast, for O3, the least North American contribution was found
ACPD
13, 15377–15407, 2013Free troposphere ozone and carbon monoxide over the
North Atlantic
A. Kumar et al.
Title Page
Abstract Introduction
Conclusions References
Tables Figures
◭ ◮
◭ ◮
Back Close
Full Screen / Esc
Printer-friendly Version Interactive Discussion
Discussion
P
a
per
|
Dis
cussion
P
a
per
|
Discussion
P
a
per
|
Discussio
n
P
a
per
|
to the photochemically generated hydrogen oxide radicals (HOx) (Jacob et al., 1995; Kleinman et al., 1995).
In order to better understand and quantify the effects associated with the decreases in North American emissions, we also carried out tagged CO and O3 simulations with the GEOS-Chem model. Results of the trend analysis for the tagged CO sim-5
ulation are summarized in Table 4. The contribution of CO produced from anthro-pogenic fossil fuel emissions in the US to CO at PMO shows a statistically significant (pvalue<0.001) decrease over the study period. The contribution of biomass burning emissions in Europe also shows a statistically significant (pvalue<0.001) decrease. On the other hand, contribution of fossil fuel emissions in Asia shows a statistically sig-10
nificant (p value<0.001) increase. These results indicate that reductions in CO from North America and Europe are the primary reasons for the decreasing CO at PMO, which outweigh the effects of increasing CO from Asia in the past decade.
Table 5 summarizes the results of the statistical analysis for the tagged O3 simula-tion. Statistically significant (p value<0.001) decreasing trends are obtained for the 15
contributions to O3at PMO from O3 production in the boundary layer over various
re-gions including North America, Europe and Asia. The contribution of O3production in the middle troposphere (MT) (Boundary Layer top – 350 hPa) also shows a decreasing trend (p value<0.001) over the study period. On the other hand, an increasing trend (p value<0.001) was identified for the contribution from O3 produced in the upper 20
troposphere (UT) (350 hPa – tropopause).
The decreasing trends for contributions to O3at PMO from North America and
Eu-rope are consistent with the declines in anthropogenic O3precursor emissions in these regions. On the other hand, the decrease in the contribution of O3 produced in Asia
(where anthropogenic precursor emissions have been increasing) may reflect the im-25
pacts from climate change in the past decade. Except for regions with strong emissions of O3precursors, climate change generally decreases surface O3due to enhanced O3
ACPD
13, 15377–15407, 2013Free troposphere ozone and carbon monoxide over the
North Atlantic
A. Kumar et al.
Title Page
Abstract Introduction
Conclusions References
Tables Figures
◭ ◮
◭ ◮
Back Close
Full Screen / Esc
Printer-friendly Version Interactive Discussion
Discussion
P
a
per
|
Dis
cussion
P
a
per
|
Discussion
P
a
per
|
Discussio
n
P
a
per
|
is particularly important for remote regions and the long range transport of atmospheric O3. Analysis of the atmospheric water vapor concentrations in the past decade shows significant increases (up to 20 %) over the North Atlantic for the study period which contributes to a shorter O3 lifetime during transport. The increase in the contribution
of O3 produced in the UT could be due to an increase in the NOx production from 5
lightning. The upper troposphere O3 is highly sensitive to NOx emissions from
light-ning, with the O3 production efficiency (referenced to NOx emissions) about six times
higher than that for NOx emissions in surface air (Wu et al., 2008). The statistically significant decreasing trend for the contribution of O3production in the North Atlantic
largely reflects the decline in the anthropogenic emissions from North America. When 10
comparing the contributions from various regions (North America, Europe and Asia) in Table 5, we can see that the reductions in anthropogenic emissions of O3 precursors
is the most important factor contributing to the decrease in O3 mixing ratios observed
at PMO.
6 Conclusions and summary
15
This study analyzes in-situ measurements of CO and O3 at the Pico mountaintop
ob-servatory and output from GEOS-Chem model simulations to determine the trends in CO and O3over the North Atlantic region for the past decade. The GEOS-Chem model
performance is also evaluated by comparing simulation results against measurements at PMO and satellite output. The model reproduces the seasonal variations of CO and 20
O3 at PMO reasonably well although it significantly underestimates CO at this remote
site.
Sensitivity studies show that North American fossil fuel emissions account for 8.6 and 4.0 ppbv CO and O3, respectively, of the total mixing ratios observed at PMO.
This contribution to the CO mixing ratios is greatest during winter and spring, reflect-25
ACPD
13, 15377–15407, 2013Free troposphere ozone and carbon monoxide over the
North Atlantic
A. Kumar et al.
Title Page
Abstract Introduction
Conclusions References
Tables Figures
◭ ◮
◭ ◮
Back Close
Full Screen / Esc
Printer-friendly Version Interactive Discussion
Discussion
P
a
per
|
Dis
cussion
P
a
per
|
Discussion
P
a
per
|
Discussio
n
P
a
per
|
the contribution to the O3 is found to be smallest during winter reflecting the low O3 production and low sensitivity to NOx emissions during wintertime.
Harmonic regression analysis of the observed CO and O3mixing ratios at PMO for
2001–2011 shows statistically significant (withp values of 0.04 and 0.0001, respec-tively) decreases for both species. The best estimates of the trends for the CO and O3
5
measurements are−0.31±0.30 (2-σ) ppbv yr−1 and −0.21±0.11 (2-σ) ppbv yr−1, re-spectively. GEOS-Chem model simulations for the past decade also yield decreasing trends for CO and O3 at PMO. We conducted tagged simulations for CO and O3
re-spectively with GEOS-Chem to attribute these decreases. Contribution to CO at PMO from fossil fuel emissions in the United States shows a statistically significant (pvalue<
10
0.001) decreasing trend (−0.27±0.05 (2-σ) ppbv yr−1) while the contribution from fos-sil fuel emissions in Asia shows a statistically significant (p value<0.001) increas-ing trend (+0.35±0.03 (2-σ) ppbv yr−1). Also, biomass burning emissions in Europe show statistically significant (pvalue<0.001) decreasing contribution (−0.3±0.03
(2-σ) ppbv yr−1). These results indicate that even though the increasing CO emissions 15
from Asia in the past decade have led to increasing enhancement in CO over the North Atlantic, the decreases in CO from North America and Europe more than compen-sate these increases and result in an overall decrease in CO mixing ratios at PMO. The changes in O3 at PMO are attributed to O3 production in various regions (e.g., North America, North Atlantic, Europe and Asia) through tagged O3 simulations with
20
the GEOS-Chem model. Contributions from O3produced in the lower and middle
tro-posphere also show statistically significant decreasing trends. The decreases in the contribution of O3 from North America and Europe as well as the North Atlantic are consistent with the decreases in anthropogenic emissions of O3 precursors in North
America and Europe in the past decade. While the anthropogenic emissions in Asia 25
ACPD
13, 15377–15407, 2013Free troposphere ozone and carbon monoxide over the
North Atlantic
A. Kumar et al.
Title Page
Abstract Introduction
Conclusions References
Tables Figures
◭ ◮
◭ ◮
Back Close
Full Screen / Esc
Printer-friendly Version Interactive Discussion
Discussion
P
a
per
|
Dis
cussion
P
a
per
|
Discussion
P
a
per
|
Discussio
n
P
a
per
|
the past decade is the most important factor contributing to the observed decreasing trends of CO and O3at PMO.
Acknowledgements. This research and the operation of the Pico Mountain Observatory have
been supported by several agencies, including the NSF Atmospheric Chemistry program, the NOAA Office of Global Programs, and the Regional Government of the Azores, and through
5
funding from the UK National Environment Research Council for the BORTAS project. We ac-knowledge funding support from the US EPA STAR program.
References
Acker, J. G. and Leptoukh, G.: Online analysis enhances use of NASA Earth science data, EOS, Transactions American Geophysical Union, 88, 14–17, doi:10.1029/2007EO020003,
10
2007.
Bey, I., Jacob, D. J., Yantosca, R. M., Logan, J. A., Field, B. D., Fiore, A. M., Li, Q., Liu, H. Y., Mickley, L. J., and Schultz, M. G.: Global modeling of tropospheric chemistry with assimilated meteorology: Model description and evaluation, J. Geophys. Res., 106, 23073–23096, 2001. Bonasoni, P., Stohl, A., Cristofanelli, P., Calzolari, F., Colombo, T., and Evangelisti, F.:
Back-15
ground ozone variations at Mt. Cimone station, Atmos. Environ., 34, 5183–5189, 2000. Brunke, E., Meyer, ˜N., Lathrop, J., Johnson, B., Shadwick, D., Cuevas, E., Schmidlin, F.,
Tara-sick, D., Claude, H., and Kerr, J.: Trends of ozone in the troposphere, Geophys. Res. Lett., 25, 139–142, 1998.
Derwent, R. G., Simmonds, P. G., Scuring, S., and Dimmer, C.: Observation and interpretation
20
of seasonal cycles in the surface concentrations of ozone and carbon monoxide at Mace Head, Ireland, from 1990 to 1994, Atmos. Environ., 32, 145–157, 1998.
Derwent, R. G., Simmonds, P. G., Manning, A. J., and Spain, T. G.: Trends over a 20-year period from 1987 to 2007 in surface ozone at the atmospheric research station, Mace Head, Ireland, Atmos. Environ., 41, 9091–9098, 2007.
25
ACPD
13, 15377–15407, 2013Free troposphere ozone and carbon monoxide over the
North Atlantic
A. Kumar et al.
Title Page
Abstract Introduction
Conclusions References
Tables Figures
◭ ◮
◭ ◮
Back Close
Full Screen / Esc
Printer-friendly Version Interactive Discussion
Discussion
P
a
per
|
Dis
cussion
P
a
per
|
Discussion
P
a
per
|
Discussio
n
P
a
per
|
Duncan, B. N., Logan, J. A., Bey, I., Megretskaia, I. A., Yantosca, R. M., Novelli, P. C., Jones, N. B., and Rinsland, C. P.: Global budget of CO, 1988–1997: Source estimates and validation with a global model, J. Geophys. Res., 112, D22301, doi:10.1029/2007JD008459, 2007. Eller, P., Singh, K., Sandu, A., Bowman, K., Henze, D. K., and Lee, M.: Implementation and
evaluation of an array of chemical solvers in the Global Chemical Transport Model
GEOS-5
Chem, Geosci. Model Dev., 2, 89–96, doi:10.5194/gmd-2-89-2009, 2009.
Evans, M. J. and Jacob, D. J.: Impact of new laboratory studies of N2O5 hydrolysis on global model budgets of tropospheric nitrogen oxides, ozone, and OH, Geophys. Res. Lett., 32, L09813, doi:10.1029/2005GL022469, 2005.
Fairlie, T. D., Jacob, D. J., and Park, R. J.: The impact of transpacific transport of mineral dust
10
in the United States, Atmos. Environ., 41, 1251–1266, 2007.
Fisher, J. A., Jacob, D. J., Purdy, M. T., Kopacz, M., Le Sager, P., Carouge, C., Holmes, C. D., Yantosca, R. M., Batchelor, R. L., Strong, K., Diskin, G. S., Fuelberg, H. E., Holloway, J. S., Hyer, E. J., McMillan, W. W., Warner, J., Streets, D. G., Zhang, Q., Wang, Y., and Wu, S.: Source attribution and interannual variability of Arctic pollution in spring constrained by
air-15
craft (ARCTAS, ARCPAC) and satellite (AIRS) observations of carbon monoxide, Atmos. Chem. Phys., 10, 977–996, doi:10.5194/acp-10-977-2010, 2010.
Fusco, A. C. and Logan, J. A.: Analysis of 1970–1995 trends in tropospheric ozone at North-ern Hemisphere midlatitudes with the GEOS-CHEM model, J. Geophys. Res.-Atmos., 108, doi:10.1029/2002JD002742, 2003.
20
Guenther, A., Karl, T., Harley, P., Wiedinmyer, C., Palmer, P. I., and Geron, C.: Estimates of global terrestrial isoprene emissions using MEGAN (Model of Emissions of Gases and Aerosols from Nature), Atmos. Chem. Phys., 6, 3181–3210, doi:10.5194/acp-6-3181-2006, 2006.
Guicherit, R. and Roemer, M.: Tropospheric ozone trends, Chemosphere-Glob. Chang. Sci., 2,
25
167–183, 2000.
Helsel, D. R. and Hirsch, R. M.: Statistical methods in water resources, US Geological survey, Reston, Va., 2002.
Holloway, T., Hiram Levy, I., and Kasibhatla, P.: Global distribution of carbon monoxide, J. Geo-phys. Res., 105, 12123–12147, 2000.
30
ACPD
13, 15377–15407, 2013Free troposphere ozone and carbon monoxide over the
North Atlantic
A. Kumar et al.
Title Page
Abstract Introduction
Conclusions References
Tables Figures
◭ ◮
◭ ◮
Back Close
Full Screen / Esc
Printer-friendly Version Interactive Discussion
Discussion
P
a
per
|
Dis
cussion
P
a
per
|
Discussion
P
a
per
|
Discussio
n
P
a
per
|
biomass burning emissions on summertime CO and O3in the North Atlantic lower free tro-posphere, J. Geophys. Res., 109, D24310, doi:10.1029/2004JD005147, 2004.
Hudman, R. C., Murray, L. T., Jacob, D. J., Turquety, S., Wu, S., Millet, D. B., Avery, M., Gold-stein, A. H., and Holloway, J.: North American influence on tropospheric ozone and the ef-fects of recent emission reductions: Constraints from ICARTT observations, J. Geophys.
5
Res., 114, D07302, doi:10.1029/2008JD010126, 2009.
Jacob, D. J., Horowitz, L. W., Munger, J. W., Heikes, B. G., Dickerson, R. R., Artz, R. S., and Keene, W. C.: Seasonal transition from NOx-to hydrocarbon-limited conditions for ozone pro-duction over the eastern United States in September, J. Geophys. Res., 100, 9315–9315, 1995.
10
Jaffe, D., Price, H., Parrish, D., Goldstein, A., and Harris, J.: Increasing background ozone during spring on the west coast of North America, Geophys. Res. Lett., 30, 1613, doi:10.1029/2003GL017024, 2003.
Johnson, C. E., Collins, W. J., Stevenson, D. S., and Derwent, R. G.: Relative roles of climate and emissions changes on future tropospheric oxidant concentrations, J. Geophys. Res.,
15
104, 18631–18645, 1999.
Khalil, M. A. K. and Rasmussen, R. A.: Global decrease in atmospheric carbon monoxide, Nature, 370, 639–641, 1994.
Kleinman, L., Lee, Y. N., Springston, S. R., Lee, J. H., Nunnermacker, L., Weinstein-Lloyd, J., and Zhou, X.: Peroxy radical concentration and ozone formation rate, J. Geophys. Res., 100,
20
7263–7273, 1995.
Kleissl, J., Honrath, R. E., Dziobak, M. P., Tanner, D., Martin, M. V., Owen, R. C., and Helmig, D.: Occurrence of upslope flows at the Pico mountaintop observatory: A case study of orographic flows on a small, volcanic island, J. Geophys. Res., 112, 10, doi:10.1029/2006JD007565, 2007.
25
Kopacz, M., Jacob, D. J., Fisher, J. A., Logan, J. A., Zhang, L., Megretskaia, I. A., Yan-tosca, R. M., Singh, K., Henze, D. K., Burrows, J. P., Buchwitz, M., Khlystova, I., McMil-lan, W. W., Gille, J. C., Edwards, D. P., Eldering, A., Thouret, V., and Nedelec, P.: Global es-timates of CO sources with high resolution by adjoint inversion of multiple satellite datasets (MOPITT, AIRS, SCIAMACHY, TES), Atmos. Chem. Phys., 10, 855–876,
doi:10.5194/acp-30
10-855-2010, 2010.
ACPD
13, 15377–15407, 2013Free troposphere ozone and carbon monoxide over the
North Atlantic
A. Kumar et al.
Title Page
Abstract Introduction
Conclusions References
Tables Figures
◭ ◮
◭ ◮
Back Close
Full Screen / Esc
Printer-friendly Version Interactive Discussion
Discussion
P
a
per
|
Dis
cussion
P
a
per
|
Discussion
P
a
per
|
Discussio
n
P
a
per
|
Lee, S. H., Akimoto, H., Nakane, H., Kurnosenko, S., and Kinjo, Y.: Lower tropospheric ozone trend observed in 1989–1997 at Okinawa, Japan, Geophys. Res. Lett., 25, 1637–1640, 1998.
Lelieveld, J., Van Aardenne, J., Fischer, H., De Reus, M., Williams, J., and Winkler, P.: Increas-ing ozone over the Atlantic Ocean, Science, 304, 1483–1487, 2004.
5
Li, Q., Jacob, D. J., Bey, I., Palmer, P. I., Duncan, B. N., Field, B. D., Martin, R. V., Fiore, A. M., Yantosca, R. M., Parrish, D. D., Simmonds, P. G., and Oltmans, S. J.: Transatlantic transport of pollution and its effects on surface ozone in Europe and North America, J. Geophys. Res, 107, doi:10.1029/2001JD001422, 2002.
Martin, R. V., Chance, K., Jacob, D. J., Kurosu, T. P., Spurr, R. J. D., Bucsela, E., Gleason,
10
J. F., Palmer, P. I., Bey, I., Fiore, A. M., Li, Q., Yantosca, R. M., and Koelemeijer, R. B. A.: An improved retrieval of tropospheric nitrogen dioxide from GOME, J. Geophys. Res., 107, 4437–4456, doi:10.1029/2001JD001027, 2002.
McLinden, C. A., Olsen, S. C., Hannegan, B., Wild, O., Prather, M. J., and Sundet, J.: Strato-spheric ozone in 3-D models: A simple chemistry and the cross-tropopause flux, J. Geophys.
15
Res., 105, 14653–14665, doi:10.1029/2000JD900124, 2000.
McMillan, W. W., Barnet, C., Strow, L., Chahine, M. T., McCourt, M. L., Novelli, P. C., Ko-rontzi, S., Maddy, E. S., and Datta, S.: Daily global maps of carbon monoxide: First views from NASA’s Atmospheric Infra-Red Sounder, Geophys. Res. Lett., 32, L11801, doi:10.1029/2004GL021821, 2005.
20
Olivier, J. G. J. and Berdowski, J. J. M.: Global emission sources and sinks, in: The Climate System, edited by: Berdowski, J., Guicherit, R., and Heij, B. J., Swets & Zeitlinger, Lisse, the Netherlands, 33–77, 2001.
Oltmans, S. J., Lefohn, A. S., Harris, J. M., Galbally, I., Scheel, H. E., Bodeker, G., Brunke, E., Claude, H., Tarasick, D., Johnson, B. J., Simmonds, P., Shadwick, D., Anlauf, K., Hayden, K.,
25
Schmidlin, F., Fujimoto, T., Akagi, K., Meyer, C., Nichol, S., Davies, J., Redondas, A., and Cuevas, E.: Long-term changes in tropospheric ozone, Atmos. Environ., 40, 3156–3173, 2006
Park, R. J., Jacob, D. J., Field, B. D., Yantosca, R. M., and Chin, M.: Natural and transboundary pollution influences on sulfate-nitrate-ammonium aerosols in the United States: Implications
30
ACPD
13, 15377–15407, 2013Free troposphere ozone and carbon monoxide over the
North Atlantic
A. Kumar et al.
Title Page
Abstract Introduction
Conclusions References
Tables Figures
◭ ◮
◭ ◮
Back Close
Full Screen / Esc
Printer-friendly Version Interactive Discussion
Discussion
P
a
per
|
Dis
cussion
P
a
per
|
Discussion
P
a
per
|
Discussio
n
P
a
per
|
Sandu, A. and Sander, R.: Technical note: Simulating chemical systems in Fortran90 and Matlab with the Kinetic PreProcessor KPP-2.1, Atmos. Chem. Phys., 6, 187–195, doi:10.5194/acp-6-187-2006, 2006.
Seinfeld, J. H. and Pandis, S. N.: Atmospheric Chemistry and Physics: From Air Pollution to Climate Change, John Wiley, New York, 2006.
5
Streets, D. G., Bond, T. C., Carmichael, G. R., Fernandes, S. D., Fu, Q., He, D., Klimont, Z., Nelson, S. M., Tsai, N. Y., Wang, M. Q., Woo, J. H., and Yarber, K. F.: An inventory of gaseous and primary aerosol emissions in Asia in the year 2000, J. Geophys. Res., 108, 8809, doi:10.1029/2002JD003093, 2003.
Streets, D. G., Zhang, Q., Wang, L., He, K., Hao, J., Wu, Y., Tang, Y., and Carmichael, G. R.:
10
Revisiting China’s CO emissions after the Transport and Chemical Evolution over the Pacific (TRACE-P) mission: synthesis of inventories, atmospheric modeling, and observations, J. Geophys. Res., 111, D14306, doi:10.1029/2006JD007118, 2006.
Val Martin, M., Honrath, R., Owen, R., Pfister, G., Fialho, P., and Barata, F.: Significant en-hancements of nitrogen oxides, black carbon, and ozone in the North Atlantic lower free
15
troposphere resulting from North American boreal wildfires, J. Geophys. Res, 111, D23S60, doi:10.1029/2006JD007530, 2006.
Val Martin, M., Honrath, R., Owen, R., and Lapina, K.: Large-scale impacts of anthropogenic pollution and boreal wildfires on the nitrogen oxides over the central North Atlantic region, J. Geophys. Res., 113, D17308, doi:10.1029/2007JD009689, 2008a.
20
Val Martin, M., Honrath, R., Owen, R., and Li, Q.: Seasonal variation of nitrogen oxides in the central North Atlantic lower free troposphere, J. Geophys. Res.-Atmos., 113, D17307, doi:10.1029/2007JD009688, 2008b.
van der Werf, G. R., Randerson, J. T., Giglio, L., Collatz, G. J., Kasibhatla, P. S., and Arel-lano Jr., A. F.: Interannual variability in global biomass burning emissions from 1997 to 2004,
25
Atmos. Chem. Phys., 6, 3423–3441, doi:10.5194/acp-6-3423-2006, 2006.
van der Werf, G. R., Randerson, J. T., Giglio, L., Collatz, G. J., Mu, M., Kasibhatla, P. S., Mor-ton, D. C., DeFries, R. S., Jin, Y., and van Leeuwen, T. T.: Global fire emissions and the contribution of deforestation, savanna, forest, agricultural, and peat fires (1997–2009), At-mos. Chem. Phys., 10, 11707–11735, doi:10.5194/acp-10-11707-2010, 2010.
30
ACPD
13, 15377–15407, 2013Free troposphere ozone and carbon monoxide over the
North Atlantic
A. Kumar et al.
Title Page
Abstract Introduction
Conclusions References
Tables Figures
◭ ◮
◭ ◮
Back Close
Full Screen / Esc
Printer-friendly Version Interactive Discussion
Discussion
P
a
per
|
Dis
cussion
P
a
per
|
Discussion
P
a
per
|
Discussio
n
P
a
per
|
Wang, H., Jacob, D. J., Le Sager, P., Streets, D. G., Park, R. J., Gilliland, A. B., and Van Donke-laar, A.: Surface ozone background in the United States: Canadian and Mexican pollution influences, Atmos. Environ., 43, 1310–1319, 2009.
Wang, Y., Jacob, D. J., and Logan, J. A.: Global simulation of tropospheric O3-NO−-hydrocarbon chemistry, 1. Model formulation, J. Geophys. Res., 103, 10713–10725, 1998.
5
Wu, S., Mickley, L. J., Jacob, D. J., Rind, D., and Streets, D. G.: Effects of 2000–2050 changes in climate and emissions on global tropospheric ozone and the policy-relevant background sur-face ozone in the United States, J. Geophys. Res.-Atmos., 113, doi:10.1029/2007JD009639, 2008.
Wu, S., Mickley, L. J., Jacob, D. J., Logan, J. A., Yantosca, R. M., and Rind, D.: Why are there
10
large differences between models in global budgets of tropospheric ozone?, J. Geophys. Res., 112, D05302, doi:10.1029/2006JD007801, 2007.
Yurganov, L. N., McMillan, W. W., Dzhola, A. V., Grechko, E. I., Jones, N. B., and van der Werf, G. R.: Global AIRS and MOPITT CO measurements: validation, comparison, and links to biomass burning variations and carbon cycle, J. Geophys. Res.-Atmos., 113, 14,
15
doi:10.1029/2007JD009229, 2008.
Zhang, L., Jacob, D. J., Liu, X., Logan, J. A., Chance, K., Eldering, A., and Bojkov, B. R.: Intercomparison methods for satellite measurements of atmospheric composition: appli-cation to tropospheric ozone from TES and OMI, Atmos. Chem. Phys., 10, 4725–4739, doi:10.5194/acp-10-4725-2010, 2010.
20
ACPD
13, 15377–15407, 2013Free troposphere ozone and carbon monoxide over the
North Atlantic
A. Kumar et al.
Title Page
Abstract Introduction
Conclusions References
Tables Figures
◭ ◮
◭ ◮
Back Close
Full Screen / Esc
Printer-friendly Version Interactive Discussion
Discussion
P
a
per
|
Dis
cussion
P
a
per
|
Discussion
P
a
per
|
Discussio
n
P
a
per
|
Table 1.Anthropogenic and biomass burning CO emissions used in GEOS-Chem (values are in Tg CO yr−1).
Anthropogenic Biomass burning
Northern North Northern North
Year Hemisphere America Europe Asia Hemisphere America
2001 436.5 97.3 45.1 245.9 202.6 8.7
2002 447.9 99.9 42.8 256.0 230.9 21.3
2003 460.3 95.5 41.6 272.9 246.5 33.9
2004 461.1 90.6 41.6 278.1 201.0 23.2
2005 460.1 86.3 40.0 281.8 216.0 20.7
2006 460.7 83.0 38.2 286.2 180.9 15.5
2007 455.9 83.0 35.4 286.2 219.6 15.3
2008 457.2 83.2 35.6 287.0 180.9 13.8
ACPD
13, 15377–15407, 2013Free troposphere ozone and carbon monoxide over the
North Atlantic
A. Kumar et al.
Title Page
Abstract Introduction
Conclusions References
Tables Figures
◭ ◮
◭ ◮
Back Close
Full Screen / Esc
Printer-friendly Version Interactive Discussion
Discussion
P
a
per
|
Dis
cussion
P
a
per
|
Discussion
P
a
per
|
Discussio
n
P
a
per
|
Table 2.CO and O3trends obtained for PMO observations and GEOS-Chem output.
Species Trend (ppbv yr−1)∗ P value
Observations GEOS-Chem Observations GEOS-Chem
CO −0.31±0.30 −0.34±0.08 0.04 <0.001
O3 −0.21±0.11 −0.53±0.04 <0.001 <0.001
ACPD
13, 15377–15407, 2013Free troposphere ozone and carbon monoxide over the
North Atlantic
A. Kumar et al.
Title Page
Abstract Introduction
Conclusions References
Tables Figures
◭ ◮
◭ ◮
Back Close
Full Screen / Esc
Printer-friendly Version Interactive Discussion
Discussion
P
a
per
|
Dis
cussion
P
a
per
|
Discussion
P
a
per
|
Discussio
n
P
a
per
|
Table 3.GEOS-Chem North American fossil fuel emissions contribution to mixing ratios of CO and O3at PMO (means for every season from fall 2000 to summer 2010).
Season CO (ppbv) O3(ppbv)
Fall 5.7 4.4
Winter 12.7 2.3
Spring 11.0 4.5
Summer 4.9 4.9
ACPD
13, 15377–15407, 2013Free troposphere ozone and carbon monoxide over the
North Atlantic
A. Kumar et al.
Title Page
Abstract Introduction
Conclusions References
Tables Figures
◭ ◮
◭ ◮
Back Close
Full Screen / Esc
Printer-friendly Version Interactive Discussion
Discussion
P
a
per
|
Dis
cussion
P
a
per
|
Discussion
P
a
per
|
Discussio
n
P
a
per
|
Table 4.Trends in contributions to CO at PMO from various regions and sourcesa.
CO sourceb Trend (ppbv yr−1)c P value
CO (ffUSA) −0.27±0.05 <0.001
CO (ffEurope) −0.004±0.03 0.39
CO (ffAsia) +0.35±0.03 <0.001
CO (bb North America) −0.03±0.02 0.004
CO (bb Europe) −0.30±0.03 <0.001
CO (bb Asia) +0.05±0.01 <0.001
aResults based on GEOS-Chem tagged CO simulation results. b
ff =emissions from fossil fuel combustion; bb=emissions from biomass burning.
ACPD
13, 15377–15407, 2013Free troposphere ozone and carbon monoxide over the
North Atlantic
A. Kumar et al.
Title Page
Abstract Introduction
Conclusions References
Tables Figures
◭ ◮
◭ ◮
Back Close
Full Screen / Esc
Printer-friendly Version Interactive Discussion
Discussion
P
a
per
|
Dis
cussion
P
a
per
|
Discussion
P
a
per
|
Discussio
n
P
a
per
|
Table 5.Trends in contributions to O3at PMO from various regions and sourcesa.
O3sourceb Trend (ppbv yr−1)c P value
O3(produced over the USA) −0.18±0.03 <0.001 O3(produced in the NA BL) −0.57±0.02 <0.001 O3(produced in the Asian BL) −0.12±0.004 <0.001 O3(produced in the European BL) −0.09±0.003 <0.001 O3(produced in the NAtl BL) −0.51±0.02 <0.001 O3(produced in the UT) +3.13±0.07 <0.001 O3(produced in the MT) −2.19±0.05 <0.001
aResults based on GEOS-Chem tagged O
3simulation results.
bNA: North America, BL: Boundary Layer, NAtl: North Atlantic, UT: Upper
Troposphere, MT: Middle Troposphere.
ACPD
13, 15377–15407, 2013Free troposphere ozone and carbon monoxide over the
North Atlantic
A. Kumar et al.
Title Page
Abstract Introduction
Conclusions References
Tables Figures
◭ ◮
◭ ◮
Back Close
Full Screen / Esc
Printer-friendly Version Interactive Discussion
Discussion
P
a
per
|
Dis
cussion
P
a
per
|
Discussion
P
a
per
|
Discussio
n
P
a
per
|
0 5 10 15 20 25 30
0 20 40 60 80 100 120
1998 2000 2002 2004 2006 2008 2010 2012
N
Ox
(Tg
/Y
r)
C
O (Tg
/Y
r)
Time (Year)
U.S. Emission Trends (2000-2011)
CO NOx
Linear (CO) Linear (NOx)
CO = 7305.66-(3.601*Time) R2 = 0.97
NOx = 1448.19 -(0.714*Time) R2 = 0.98
ACPD
13, 15377–15407, 2013Free troposphere ozone and carbon monoxide over the
North Atlantic
A. Kumar et al.
Title Page
Abstract Introduction
Conclusions References
Tables Figures
◭ ◮
◭ ◮
Back Close
Full Screen / Esc
Printer-friendly Version Interactive Discussion
Discussion
P
a
per
|
Dis
cussion
P
a
per
|
Discussion
P
a
per
|
Discussio
n
P
a
per
|