www.atmos-chem-phys.net/12/11733/2012/ doi:10.5194/acp-12-11733-2012
© Author(s) 2012. CC Attribution 3.0 License.
Chemistry
and Physics
On the diurnal cycle of urban aerosols, black carbon and the
occurrence of new particle formation events in springtime
S˜ao Paulo, Brazil
J. Backman1, L. V. Rizzo2, J. Hakala1, T. Nieminen1, H. E. Manninen1, F. Morais3, P. P. Aalto1, E. Siivola1, S. Carbone4, R. Hillamo4, P. Artaxo3, A. Virkkula1,4, T. Pet¨aj¨a1, and M. Kulmala1
1Division of Atmospheric Sciences, Department of Physics, University of Helsinki, Helsinki, Finland 2Department of Earth and Exact Sciences, Federal University of S˜ao Paulo, S˜ao Paulo, Brazil 3Institute of Physics, University of S˜ao Paulo, S˜ao Paulo, Brazil
4Finnish Meteorological Institute, Helsinki, Finland
Correspondence to:J. Backman (john.backman@helsinki.fi)
Received: 29 September 2011 – Published in Atmos. Chem. Phys. Discuss.: 11 November 2011 Revised: 8 November 2012 – Accepted: 9 November 2012 – Published: 11 December 2012
Abstract. Large conurbations are a significant source of the anthropogenic pollution and demographic differences be-tween cities that result in a different pollution burden. The metropolitan area of S˜ao Paulo (MASP, population 20 mil-lion) accounts for one fifth of the Brazilian vehicular fleet. A feature of MASP is the amount of ethanol used by the vehicu-lar fleet, known to exacerbate air quality. The study describes the diurnal behaviour of the submicron aerosol and relies on total particle number concentration, particle number size dis-tribution, light scattering and light absorption measurements. Modelled planetary boundary layer (PBL) depth and air mass movement data were used to aid the interpretation. During morning rush-hour, stagnant air and a shallow PBL height favour the accumulation of aerosol pollution. During clear-sky conditions, there was a wind shift towards the edge of the city indicating a heat island effect with implications on particulate pollution levels at the site. The median total parti-cle number concentration for the submicron aerosol typically varied in the range 1.6×10⁴–3.2×104cm−3frequently
ex-ceeding 4×104cm−3 during the day. During weekdays,
nucleation-mode particles are responsible for most of the par-ticles by numbers. The highest concentrations of total parti-cle number concentrations and black carbon (BC) were ob-served on Fridays. Median diurnal values for light absorp-tion and light scattering (at 637 nm wavelength) varied in the range 12–33 Mm−1and 21–64 Mm−1, respectively. The
for-mer one is equal to 1.8–5.0 µg m−3 of BC. The growth of
the PBL, from the morning rush-hour until noon, is consis-tent with the diurnal cycle of BC mass concentrations. Week-day hourly median single-scattering albedo (ω0)varied in the
range 0.59–0.76. Overall, this suggests a top of atmosphere (TOA) warming effect. However, considering the low sur-face reflectance of urban areas, for the given range ofω0,
the TOA radiative forcing can be either positive or negative for the sources within the MASP. On the average, weekend
ω0values were 0.074 higher than during weekdays. During 11 % of the days, new particle formation (NPF) events oc-curred. The analysed events growth rates ranged between 9 and 25 nm h−1. Sulphuric acid proxy concentrations calcu-lated for the site were less than 5 % of the concentration needed to explain the observed growth. Thus, other vapours are likely contributors to the observed growth.
1 Introduction
2010). The potential of the aerosol particles to alter these depends on their number concentration, size and chemical composition (Haywood and Boucher, 2000). Once emitted, pollutants in the gas and particulate phases are subject to at-mospheric processing. They can either be emitted directly into the atmosphere as primary aerosol particles or be formed there as secondary aerosol particles.
Among the primary aerosol particles, significant atten-tion has been put onto light absorbing aerosols, emitted as a result of incomplete combustion processes, profuse in ur-ban areas. During the last two decades studies have shown the climatic effects of light absorbing aerosols (e.g. Hay-wood and Shine, 1995; Andreae, 2001; Jacobson, 2001; Ramanathan and Carmichael, 2008). Bond and Bergstrom (2006) recommend the term light absorbing carbon (LAC) for light-absorbing carbonaceous aerosols, although black carbon (BC) is still the most widely used therm. In this paper, we will use the term BC, since it was the output of the instru-ment we used. Atmospheric BC, a potent radiative forcer, also possess the ability to change the temperature profile of the atmosphere by adding energy to the atmosphere and re-ducing it at the surface (e.g. Ramanathan and Carmichael, 2008).
Secondary aerosols are more complex by nature (e.g. Hal-lquist et al., 2009; Jimenez et al., 2009; Kroll and Seinfeld, 2008; Rudich et al., 2007). Secondary aerosol gas-particle conversion processes include inorganic species such as sul-phate, nitrate, and ammonium (e.g. Zhang et al., 2000). Or-ganic species are also substantial contributors to the submi-cron particulate mass (Jimenez et al., 2009). A gain in sec-ondary aerosol mass will affect the optical properties of the aerosol. The sheer number of organics in the atmosphere, and the plethora of intermediate products is an immense chal-lenge for the accurately prediction SOA formation (Hallquist et al., 2009; Rudich et al., 2007). The vapour pressure of organics, and thus their SOA-formation potential, depends on their polarity and size. The addition of common oxygen containing functional groups, e.g. the hydroxyl (OH) radi-cal, the hydroperoxyl (HO2)radical, and the nitrate (NO3)
radical will reduce the vapour pressure of organics signifi-cantly (Kroll and Seinfeld 2008), yielding less volatile and more water soluble products in the process (Hallquist et al., 2009). Oxidation reactions through which VOCs evolve are primarily initiated by OH radical, NO3 radical, and ozone
(O3, Hallquist et al., 2009; Kroll and Seinfeld, 2008). The
products that follow can subsequently end up in the con-densed phase, where they are still susceptible to processes in either phase, and will further evolve through heterogeneous and multiphase reactions over many generations (Kroll and Seinfeld, 2008). Hence, SOA yields from even a single pre-cursor are not a stoichiometric quantity but increases with organic-particulate loading (Hallquist et al., 2009; Kroll and Seinfeld, 2008). Given the multitude of intermediate and in-teracting reactions in multiple phases we focus the discussion
on the initiating oxidants from an ethanol combustion point of view, and thus stay within the scope of the study.
Large conurbations are a significant source of primary and secondary aerosol particles and trace gases, with po-tential effects on the hydrological cycle (Lohmann and Fe-ichter, 2005) and climate patterns (IPCC, 2007). We know from previous studies that megacities differ from each other in terms of trace-gas levels, particle emission, and ambient air quality (Gurjar et al., 2008; Laakso et al., 2006). Unlike coarse-mode particles, fine-mode particles (i.e. submicron) are mostly of anthropogenic origin consisting commonly of sulphates, nitrates, organics, and BC. Sulphates, nitrates and organics scatter light, while BC also absorbs light. Together, these fine-mode particles make up the urban haze, character-istic for polluted areas.
Previous studies (e.g. Kittelson et al., 2004; Zhu et al., 2002) have shown vehicular exhaust to be a significant source of nucleation-mode particles in urban areas. Nucleation-mode particles can also be produced through new parti-cle formation (NPF). NPF, and the growth of these newly formed particles, depends on the concentration of gaseous vapours, the production of nanometer-size clusters and the pre-existing aerosol population (Kerminen et al., 2001; Kul-mala, 2003). In the initial formation and growth, sulphuric acid is a vital contributor (Sipil¨a et al., 2010). The presence of sulphuric acid has also been shown to catalyse heterogeneous reactions of aldehyde functional groups and yield additional aerosol mass (Jang and Kamens, 2001). Moreover, sulphuric acid concentrations can usually explain only a fraction of the observed growth rate (Kulmala et al., 2004).
The metropolitan area of S˜ao Paulo (MASP, population 20 million) is the world’s seventh largest urban agglomerate with a fleet of 8.4 million registered vehicles. By numbers, this is one fifth of the Brazilian fleet (CETESB, 2007). To date, size distribution measurements within the MASP are scarce and short. Previous studies have shown elevated con-centrations of trace gases associated with ethanol-based fu-els in S˜ao Paulo (Colon et al., 2001; Nguyen et al., 2001). In general, this is characteristic of MASP since estimates sug-gest that 55 % of the vehicular fuel consumption by volume is bioethanol (CETESB, 2007). There are uncertainties associ-ated with the use of oxygenassoci-ated fuels on the implications on air quality, climate, and human health (Farrell, 2006; Gaffney and Marley, 2009; Jacobson, 2007). Bioethanol in flexi-fuel vehicles is known to reduce NOx emissions, but increase
aldehyde emissions (Graham et al., 2008). During combus-tion, ethanol (CH3CH2OH) can crack to form mainly
ac-etaldehyde CH3CHO (Gaffney and Marley, 2009) and some
formaldehyde HCHO. Acetaldehyde is also formed when ethanol reacts with the OH radical (95 % of the time, Atkin-son, 2000). Aldehydes provide pathways which produce pho-tochemical smog (Haagen-Smit, 1952; Tanner et al., 1988; Atkinson, 2000).
Both the traffic-related emissions and the meteorological conditions have clear diurnal cycles. One of the goals of this paper was to study the main factors governing the diurnal cycles of the submicron aerosol properties in S˜ao Paulo. An-other goal is to compare the MASP aerosol with results ob-tained from other urban areas to find out whether the fuel used has an effect on the aerosol properties tracked in the study.
In this paper, we analyse the diurnal cycle of submicron aerosol in terms of particles number concentration, their size distribution, optical properties, and BC concentrations as-sociated with traffic. Thus, weekdays and weekends were treated separately, since there was more traffic during week-days. We will describe how meteorological conditions and their diurnal cycle affect the observations. Secondary aerosol formation affecting the measurements, although not backed up by direct chemical composition data, is addressed through the optical properties of the aerosol. Furthermore, the study reports a lower limit for the sulphuric acid (H2SO4)
concen-trations required for the observed NPF growth and how they compare to a sulphuric acid proxy based on trace-gas data. This allows for an estimate on the contribution to growth by other condensable vapours in addition to H2SO4.
2 Methods and instrumentation
2.1 The campaign measurement site
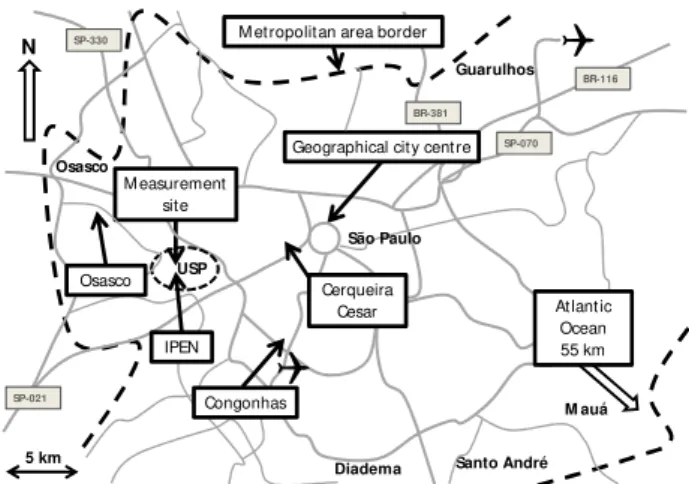
The site is located roughly 10 km from the centre of S˜ao Paulo city, at the western edge of the most densely populated area. Vast suburban residential areas surround the city cen-tre, populated by 20 million people. This makes S˜ao Paulo the world’s 7th largest city. The city locates on a plateau 760 m above sea level (a.s.l.) surrounded by hills rising as high as 1200 m a.s.l. To the southeast, about 55 km away, is the Atlantic Ocean. Adjacent to the Atlantic Ocean there is a 15 km wide costal area before the plateau on which S˜ao Paulo situates. The steep slope of Serra do Mar inclines 700 m within 3 km. The climate is subtropical with dry winters and wet summers (Oliveira et al., 2003). The measurements were made at the Armando Salles de Oliveira campus area of USP (Fig. 1). The campus area is a vast park, totalling an area of 7.4 km2, making the site ideal for tracking ambient aerosols, without strong local sources. At the campus area buildings are scarce. Thus, air masses arriving at the station should be well mixed and make the measurements representative of the ambient pollution burden of the city.
A temperature controlled room on the roof of a four-story building housed the measurement equipment. Two equiva-lent vertical sampling lines with PM2.5inlets mounted 0.5 m
above the roof provided sample air to the instruments. Ex-cess flow arrangements ensured the total flow in the sam-pling line to be 16.7 lpm. The samsam-pling lines to the instru-ments were 3/8 inch stainless steel tubing with an inner
di-5 km
M easurement site
Geographical city centre M etropolitan area border
Osasco
Guarulhos
USP
Diadema
M auá
Santo André
SP-021
BR-116
SP-070 SP-330
BR-381
Osasco Cerqueira
Cesar
Congonhas IPEN
N
Atlantic Ocean 55 km
São Paulo
Fig. 1.Map of the metropolitan area of S˜ao Paulo. The measurement site is west of the geographical city centre. The metropolitan area of S˜ao Paulo is inhabited by 20 million people.
ameter of 1/4 inch from the inlet to the instruments and 1.8 m in length. Aerosol optical instruments were sampling through one sampling line. Total particle number concentra-tions were sampling through the other sampling line in par-allel with the size distribution measurements. Total particle number concentrations were measured with a condensation particle counter (CPC, Model 3022, TSI Inc., St. Paul, MN, USA) and number size distributions with a differential mo-bility particle sizer (DMPS, Knutson and Whitby, 1975). A Neutral cluster and Air Ion Spectrometer (NAIS, Kulmala and Tammet, 2007; Manninen et al. 2009), were also used to measure size distributions, placed outside in a cabinet with a sampling line of its own. Sample air was drawn into the instrument through a 0.6 m long copper tube with a sample flow of 60 lpm. The inner diameter of the sampling line used was 33 mm. The cabinet temperature was kept above ambient to avoid condensation inside the instrument.
2.2 Supporting measurement stations
In addition to the measurements at the campaign site, we took use of meteorological and trace gas measurements from existing measurements stations. The meteorological station closest to the campaign site was 100 m away at the Institute of Astronomy, Geophysics and Atmospheric Science (IAG, Oliveira et al., 2002). The meteorological station operated by the micrometeorology group at USP provided us with tem-perature, pressure, precipitation, relative humidity and global irradiance data.
western part of the campus area. The IPEN station monitors O3. The closest available station measuring sulphur
diox-ide (SO2)was the Osasco monitoring station located 6 km
away to the northwest (Fig. 1). It is located in the residen-tial and to some extent commercial municipality of Osasco with relatively few high rise buildings in comparison to S˜ao Paulo. Also, commuter avenues were not within the imme-diate surroundings of the site, but approximately 1 km away to the north. Two other monitoring stations, Congonhas and Cerqueira Cesar, considered for the analysis were omitted due to their different surroundings in comparison to the mea-surement site (Gallardo et al., 2012). The Cerqueira Cesar monitoring station (7 km to the west) is more representative of street-level pollution exposure than of the ambient lev-els at the campaign site, because of its close location to an eight-lane avenue. Further south, 9 km to the southwest of the campaign site is the Congonhas measurement station. Heavy roadside traffic and the central airport of S˜ao Paulo (1 km away) are the dominant features of Congonhas (Gallardo et al., 2012). Therefore, we decided to use the Osasco SO2data
in the analysis since it resembles the measurement site the most. The station is also the only one which tracks wind di-rection and wind speed in addition to SO2.
2.3 Instrumentation
2.3.1 Differential mobility particle sizer (DMPS)
Submicron aerosol number size distribution and total particle number concentration was monitored with a DMPS system (Aalto et al., 2001). To minimise diffusion losses two aerosol flow arrangements were used in the same Vienna-type Dif-ferential Mobility Analyzer (DMA, Winklmayr et al., 1991) with closed sheath flow arrangements. The DMPS measured number size distributions from 6–800 nm mobility diameters. For smaller particles, a high aerosol flow of 4 L min−1 and a sheath flow of 20 L min−1 were used to measure
mobil-ity diameters from 6–280 nm. Mobilmobil-ity diameters from 100– 800 nm were measured with an aerosol flow of 1 L min−1
and a sheath flow of 5 L min−1. These flow rates result in
the same non-diffusional transfer function with aβof 1/5 as described by Zhang and Flagan (1996).
2.3.2 Neutral cluster and Air Ion Spectrometer
The deployment of a Neutral cluster and Air Ion Spectrom-eter (NAIS) enabled the tracking of the initial steps of NPF. The NAIS measures mobility distributions in the range 3.2– 0.0013 cm2V−1s−1 and corresponds to mobility diameters in the range of 0.8–42 nm (Mirme et al., 2007). The instru-ment is a further developinstru-ment of the Air Ion Spectrometer (AIS) which only measures naturally charged particles. The ability of the NAIS to measure neutral clusters arises from the unipolar corona chargers. In the neutral-particle mode, particles are charged with corona chargers and the charging
probability is calculated using Fuchs theory (Fuchs, 1963). Before the sample enters the DMAs, some of the corona charger ions are filtered out using electrical post-filters. Mo-bility distributions are measured with two DMAs in parallel, one for each polarity. The central electrodes of the DMAs have a polarity opposite to the charger surrounded by 21 cir-cular electrometers. The oppositely charged particles enter-ing the vicinity of the DMA precipitate onto the outer walls away from the central electrode onto the electrometers. Elec-trometer currents are inverted to 28 different size bins tak-ing into account experimentally determined diffusion losses and instrument noise (Mirme and Mirme, 2011). The noise of the electrometers were measured subsequently and sub-tracted from the measurements thus minimizing the influence of any reduction in electrometer performance. A schematic of the instrument is presented in Manninen et al. (2009).
The post-filters were manually tuned so that not all of the main charger ions are removed with the result that the instru-ment performance can be tracked better. Combined DMPS and NAIS number size distributions were plotted from 3– 800 nm, thus discarding these charger ions. Although the NAIS and DMPS measure the same aerosol, the inversion, charging probability, and charging method differ.
2.3.3 Aerosol optical instruments
The optical properties tracked were light scattering coef-ficients (σSP) measured by a Nephelometer (Model 3563, TSI Inc., St. Paul, MN, USA) and light absorption coeffi-cients (σAP)converted from black carbon (BC) mass
con-centrations reported by a Multi Angle Absorption Photome-ter (MAAP, Model 5012, Thermo Scientific, Franklin, MA, USA). The aerosol was dried with diffusion driers. The in-struments were coupled in series with a flow rate of 10 lpm using the MAAP’s internal pump downstream of the Neph-elometer.
The Nephelometer measures light scattering coefficients at 450, 550, 700 nm wavelengths (Anderson and Ogren, 1998). At the same time, it tracks the relative humidity (RH), tem-perature and pressure of the sample air inside the instrument. Scattering coefficients were corrected for angular truncation error according to Anderson and Ogren (1998). Instrument calibration was done using particle-free air and carbon diox-ide. Scattering coefficients measured with a RH exceeding 50 % inside the instrument were discarded, which were less than 30 % of the data set.
The BC concentrations were measured with a MAAP (Pet-zold et al., 2005) at the wavelength of 637 nm (M¨uller et al., 2011).σAPwas calculated from the BC concentrations using
the mass absorption cross-section (MAC) of 6.6 m2g−1. The
relationship betweenσAPand BC mass concentrations is
σAP=MAC·BC. (1)
Measured aerosol optical properties were converted to 1000 mbar and 0◦C conditions from the temperature and
pressure measured in the Nephelometer. Using ˚Angstr¨om exponents, light scattering was interpolated to the MAAP wavelength yielding the single-scattering albedo (ω0)of the aerosol.
2.3.4 Instrument calibrations
Prior to deployment, the CPCs were calibrated with the aid of an electrometer (Model 3068, TSI Inc., St. Paul, MN, USA). The calibration setup was principally the same as is described in the technical paper by Agarwal and Sem (1978). Silver particles were produced by heating silver in an oven to 1000– 1060◦C in a nitrogen atmosphere.
The calibration setup was used to determine the parti-cle number concentrations and cut-off diameter of the CPCs against the reference electrometer in the single particle counting mode (103–104cm−3). Ideally, the particle number concentrations measured with the CPCs and the electrometer would be the same (slope 1:1). The slope was determined with 50 nm particles, well above the cut-off diameter of the CPCs. In the photometric mode, the CPCs were compared against each other onsite with 50 nm sodium chloride parti-cles and operated side-by-side with the DMPS.
The cut-off diameters were determined both with and without aerosol driers inline. In this way, we were able to estimate the effect of diffusional losses in the driers, repre-sented by an equivalent length of tube losses in the sampling line. The CPC (Model 3772, TSI Inc., St. Paul, MN, USA) used in the DMPS had a cut-off diameter of 6 nm. With the NAPHION (Permapure LLC, Toms River, NJ, USA) diffu-sion drier in the DMPS the cut-off size was 13 nm. From these results, the equivalent length of the drier was calculated to be 13.3 m. The cut-off diameter of the TSI 3022 CPC was 5 nm. With its Topas (Topas GmbH, Dresden, Germany) dif-fusion drier, the cut-off was at 7 nm. This was calculated to be equivalent to 2.7 m of sampling line. Diffusional losses in the DMA and sampling line were compensated for dur-ing the inversion of the DMPS measurement data. The deter-mined equivalent length of the diffusion drier of the DMPS was added to the actual sampling line length. Thus, all re-ported DMPS size distributions were compensated for diffu-sional losses throughout the system.
The high voltage supply for the DMA was calibrated be-tween 0 and 1 kV and a similar slope was assumed for the whole range. This was verified by sampling 404 nm latex par-ticles and changing the sheath flow of the DMA.
The sheath flow of the DMA was controlled with a mass flow meter (Series 4000, TSI Inc., St. Paul, MN, USA) with HEPA filters both upstream and downstream of the device. The aerosol flow was calibrated using a flow meter (Model DC-1, Bios Inc., Butler, NJ, USA). The slope and the off-set were determined by linear regression and were fed into
the DMPS software. During routine maintenance, the aerosol flows were checked.
2.4 New particle formation event analysis
New particle formation (NPF) depends on the competition between the initial growth of the nuclei and their scavenging by the pre-existing particle population (Kulmala et al., 2005). The condensation sink (CS) is a measure of the molecule loss from gas phase to the existing particle surface via condensa-tion (Dal Maso et al., 2002; Kulmala et al., 2005). Modest source rates (Q) are enough for small particles to form and grow when the CS is low. However, when the CS is high, the vapour concentration needs to be higher in order for particles to form, grow, and survive to observable sizes (Kulmala et al., 2005). While CS can be a limiting factor for NPF, the occur-rence of these NPF events at heavily polluted areas is an in-dication of high concentrations of condensable vapours. The vapour concentration (Cvap) needed to explain the growth
was calculated using Eq. (8) in Nieminen et al. (2010) for sulphuric acid (H2SO4)
Cvap=
2ρvdv αmmv1t
r
π mv
8kT
2x1+1
x1(x1+1)−
2x0+1
x0(x0+1)
+2 ln x
1(x0+1) x0(x1+1)
. (2)
Here,ρvis the condensed-phase density of the vapour,mvits
molecular mass, anddvthe diameter of the vapour molecule. αm is the mass accommodation coefficient (assumed to be unity in the calculations), T the ambient temperature, and
kthe Boltzmann constant. In this equation,x1 =dv/dp,final
andx0 =dv/dp,initial.dp,initialrefers to the initial particle di-ameter and dp,final refers to the final particle diameter after the time interval1t. The equation provides the relationship between particle growth in time (1t) andCvapfromdp,initial
todp,final for a given substance with a negligible saturation
vapour pressure (H2SO4). To sustain the observed growth,
the steady-state production rate (Q) of the condensing vapour was calculated asQ=CS·Cvap.
The NPF event days and the formation rates of particles were determined according to the method described by Dal Maso et al. (2005). The formation rate (J) was calculated using particle concentrations in the size range 6–20 nm for the DMPS data and 2–3 nm for the NAIS data, denotedJ6
andJ2,TOT, respectively. The formation rate of 6 nm particles (J6)was determined by
J6=
dN6
dt +CoagS·N6+
GR
1dp
·N6 (3)
according to Kulmala et al. (2012). Here,N6is the number
concentration of 6–20 nm particles, CoagS is the coagulation sink of the pre-existing particles,1dpis the width of the 6–
number size distributions with the method presented by Kul-mala et al. (2001). For the growth-rate calculations we first determined the times of the concentration maxima in each of the size bins. Linear least-square fits were made to these points. The slope of these fits is the GR. A more thorough description of the method is given by Hirsikko et al. (2005) and Yli-Juuti et al. (2011).
The NAIS also measures naturally charged particles down to 0.8 nm in diameter, thus enabling us to observe the first steps of NPF events. The calculations of 2 nm ion formation rates (J2)from 2–3 nm ion concentrations (of both polarities)
were done according to Kulmala et al. (2012) as
J2±=dN
± 2
dt +CoagS·N
± 2+
GR
1dp
·N2±+α·N2±·N2∓−β·N2·N2± (4)
where the superscripts±denote the particle charge. There are now two additional terms in comparison to Eq. (3). Addi-tional losses for the ions occur via ion-ion collisions, was estimated assuming a recombination coefficient (α) value of 1.6×10⁻⁶cm3s−1 (Tammet and Kulmala, 2005).
Ion-neutral attachment was taken into account with the ion-neutral attachment coefficient (β)of 10−8cm3s−1(Tammet and Kulmala, 2005).
Sulphuric acid is closely linked to atmospheric NPF (e.g. Sipil¨a et al., 2011). As no measurements of sulphuric acid were done at the campaign site, we estimated the concentra-tions using the method presented by Pet¨aj¨a et al. (2009). In steady-state conditions the proxy for sulphuric acid concen-tration is
H2SO4=k· [SO2] ·GlobRad/CS. (5)
Here, [SO2] is the sulphur dioxide concentration, GlobRad
is solar radiation intensity, and CS the condensation sink by the pre-existing aerosol. For the scaling factork, we used a value of 1.4×10⁻⁷ · GlobRad−0.7m2W−1s−1. This is based on measurements in a boreal forest environment in Fin-land (Pet¨aj¨a et al., 2009), and, therefore, the absolute values should be considered as indicatory concentrations.
3 Results and discussion
The results presented were measured between 10 October 2010 and 10 January 2011 and are representative of the spring and early summer in S˜ao Paulo region. In spring, bursts of intense rainfall become gradually more frequent. This holds true for the measurement period and the transition from spring to summer in general. During summer months, rainfall culminates (Oliveira et al., 2003). During the period, there were 79 days with clear skies, 12 days with overcast clouds, and 23 rainy days. The remaining 14 days were days with a partial cloud-cover during the day.
All the times mentioned below are in Coordinated Univer-sal Time (UTC)−3 h, which is the local S˜ao Paulo winter-time and will be referred to as local winter-time (LT).
3.1 Overview of the observed aerosol concentrations
Table 1 summarises the central aerosol parameters. From Ta-ble 1, it is evident that among the cities compared, the one that resembles S˜ao Paulo the most is Mexico City. Mexico City is also populated by roughly the same amount of peo-ple (20 million) and has almost the same population density (2800 km−2)as S˜ao Paulo (2200 km−2). The observed
parti-cle growth rates and partiparti-cle number concentrations are simi-lar. However,ω0at S˜ao Paulo was significantly lower than in
Mexico City, so the aerosols may have different climatic im-pacts. In the work by Baumgardner et al. (2002), they stress the importance of the contribution by diesel vehicles, which are known to be strong BC sources. Moreover, the combus-tion of short-chained hydrocarbons (such as ethanol) is ex-pected to result in less BC than the combustion of gasoline or diesel (Baumgardner et al., 2002). In general, Beijing has twice the concentrations we observed at S˜ao Paulo. Based on the comparison, also New Delhi has far worse air quality issues and airborne particulate matter than S˜ao Paulo.
The three-month average total particle number con-centration was 2.35×104cm−3 (standard deviation
1.04×104cm−3). This is roughly half of what has been
measured in springtime in Beijing in 2004 (5.4×104cm−3,
Wehner et al., 2004). In comparison, Hyv¨arinen et al. (2010) reported a mean concentration of 2.26×104cm−3 for
a rural site 25 km from the centre of New Delhi. The maximum 24-h average concentration during autumn in New Delhi (M¨onkk¨onen et al., 2005) was twice as high (6.28×104cm−3, standard deviation 1.78×104cm−3)
in comparison to 3.56×104cm−3 (standard deviation 0.55×104cm−3), which we measured in S˜ao Paulo. During the course of weekdays, the range of the hourly median values of σSP and σAP was 21–57 Mm−1 and
13–35 Mm−1, respectively. Using Eq. (1), the σAP range
is equivalent to 2.0–5.4 µg m−3 of BC. This is in the same
range (σSP=53 Mm−1andσAP =11 Mm−1mean values at
525 nm) as a remote site in northern India, mostly dominated by long range transport, i.e. the atmospheric brown cloud in Asia (Hyv¨arinen et al., 2009). The median σAP (and BC) were overall lower during weekends, between 9.2 and 30.3 Mm−1(equivalent to 1.4–4.6 µg m−3of BC).
3.2 Diurnal cycle of aerosol number concentrations
Table 1.Summary of observed, measured, and calculated aerosol parameters. The single values shown represent the averages and the two values the range of observations. The cities presented are S˜ao Paulo – Brazil, Beijing – China, New Delhi – India, Wukteshwar – India, and
Mexico City – Mexico. The surroundings of the sites were classified into Urban (U), Sub-urban (S), and Remote (R) locations.N: number
concentration, GR: growth rate, CS: condensation sink,σAP: absorption coefficient,σSP: scattering coefficient,ω0=single-scattering albedo.
The optical properties are atλ=637 nm unless stated otherwise below.
City/Average N GR CS σAP σSP ω0
(104cm−3) (nm h−1) (10−3s−1) (Mm−1) (Mm−1) –
S˜ao Paulo (U) 2.35 9–25 6–17 12–33 21–64 0.59–0.76
Beijing1,2,3(U) 5.4 0.1–11 6–43 52 361 0.86
New Delhi4,5(S) 2.26 11–18 50–70 81 758 0.92
Mukteshwar6,7(R) 0.15–0.48 1–3 – 11 53 0.81
Mexico City8,9(U) >2.1 6–18 – 7–33 50–175 0.75–0.92
1Wehner et al. (2004). 2Garland et al. (2009)σ
APandω0values are reported at 532 nm andσSPat 550 nm wavelengths. 3Wu et al. (2007).
4M¨onkk¨onen et al. (2005). 5Hyv¨arinen et al. (2010)σ
APandσSPreported at 520 and 670 nm wavelengths, respectively.ω0(at 670 nm) was estimated using a
λ−1wavelength dependency forσAP. 6Hyv¨arinen et al. (2009)σ
APandω0values are reported at 520 nm andσSPat 525 nm wavelengths. 7Neitola et al. (2011).
8Kalafut-Pettibone et al. (2011). 9Baumgardner et al. (2007)σ
AP,ω0,σSPpresumably at 565 nm wavelength.
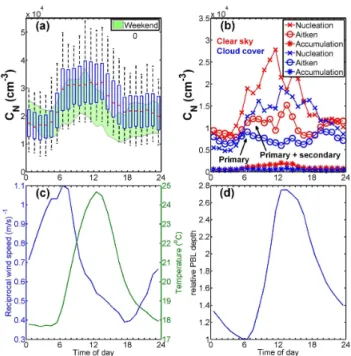
hours (07:00–15:00 LT), the median concentrations reached up to 3.2×104cm−3. The drop in total particle number con-centrations in the afternoon can also be partially explained by the heat island effect (discussed in more detail further on) and the geographical location of the measurement site at the western edge of the MASP. In the evening, the median values were typically 2.2×104cm−3. In the background of Fig. 2a,
the 25th and 75th percentiles of the weekend data are shown in green (compare with the blue edges of the boxes for week-days). The black whiskers in Fig. 2a mark the weekday 5th and 95th percentiles. Evidently, the weekend rush-hour oc-curred later than during the weekdays and was less intense. Thus, to isolate the traffic effects, we chose to focus the diur-nal adiur-nalysis on weekdays.
Wet deposition due to precipitation partly explains the lower extremes. The median particle number concentration during precipitation with an intensity of 3 mm h−1 or more was 1.4×104cm−3. The upper extremes of the particle num-ber concentration originate from NPF events or by inci-dental nearby anthropogenic emissions (Allen et al., 2009; Hyv¨arinen et al., 2009, 2010).
Figure 2b presents the diurnal cycle of the median modal number concentration of the nucleation (6–25 nm), the Aitken (25–90 nm), and the accumulation mode (90– 800 nm). The three modes were fitted to the size distributions using the method described by Hussein et al. (2005). The fig-ure is restricted to weekdays only and split into cloudy and sunny days by comparing modelled and measured solar irra-diance. Days with precipitation (23 of 93 days) were omitted in this plot because precipitation scavenges particles.
In Fig. 2b, cloud-cover and clear-sky number concen-trations of nucleation-mode particles show a similar
be-haviour. However, the number concentrations were lower during cloudy days. During the early morning, there was a sharp increase from nighttime to rush-hour concentrations. Throughout the day, the clear-sky nucleation-mode trations were higher than during cloudy days. The concen-tration difference, especially around noon (10:00–14:00 LT), can be attributed to NPF events. In addition to NPF events, vehicular emissions are a source of nucleation-mode parti-cles, profuse in urban areas. Otherwise, the diurnal cycles of the cloud-cover and clear-sky nucleation-mode concen-trations were similar, except for the difference in concentra-tions.
The production of low vapour pressure species that are able to form and grow particles depends on photochemistry. The degradation of VOCs, a process that favours the accu-mulation of O3 in the presence of NOx, which in turn is
a vital source of OH, depends on photochemistry (Jenkin and Clemitshaw, 2000; Kroll and Seinfeld, 2008). A pathway which favours the accumulation of O3is the photochemical
dissociation of aldehydes (Seinfeld, 1989) or their reactions with OH radicals (Atkinson, 2000), which subsequently re-acts with NO (Seinfeld, 1989; Tanner et al., 1988). Conse-quently, O3accumulates and allows for low vapour pressure
species to be formed, as discussed in the introduction section. H2SO4is also a product of photochemistry and closely linked
Fig. 2.Total particle number concentrations and the
meteorolog-ical conditions affecting these.(a)Three month diurnal cycle of
weekday total particle number concentrations (median values are in red). The upper and lower edges of the blue boxes are the 75th and 25th percentiles. The black whiskers indicate the 95th and 5th percentiles. In comparison, weekend total particle number concen-tration 75th and 25th percentile interval is shown in the background,
in green.(b)Modal median number concentrations were obtained
by fitting up to three modes to the number size distributions. Only weekday and precipitation free data are shown in this plot,
distin-guishing between cloudy and clear-sky days.(c)Diurnal reciprocal
wind speed as a measure of atmospheric stagnation and diurnal
tem-perature.(d)Modelled relative boundary layer depth from NOAA –
CIRES 20th century reanalysis data at the nearest grid point to S˜ao
Paulo (23.809◦S, 46.875◦W).
There is a notable difference in the diurnal cycles of the Aitken-mode particle number concentrations during sky and cloud-covered conditions (Fig. 2b). During clear-sky morning rush hours, there was a gradual increase in the Aitken-mode particles from nighttime concentrations (median 0.8×104cm−3between 00:00 and 06:00 LT)
un-til 10:00 LT (median 1.2×104cm−3). Furthermore, during
cloud-covered conditions, the Aitken-mode peak concentra-tion was more distinct (0.9×104cm−3 between 06:00 and
07:00 LT) and declined until past noon (0.6×104cm−3
be-tween 12:00 and 13:00 LT). Arguably, we attribute the dis-crepancy to the change in photochemical activity, in the ul-traviolet (UV) spectrum, suppressed by overcast conditions (Schafer et al., 1996). UV radiation is significantly reduced by overcast conditions, although less attenuated than the to-tal solar irradiance (Estupinan et al., 1996). UV radiation is vital for generating degradation initiating oxidants yielding secondary aerosol mass (Crutzen and Zimmermann, 1991;
Seinfeld, 1989). The inorganic nitrates and sulphates com-mon in urban aerosols depend on the production of H2SO4
and nitric acid (HNO3) through photochemistry. Thus, we
attribute the discrepancy to the secondary aerosol (inorganic and SOA) forming potential between the different conditions as indicated in Fig. 2b. The hypothesis is supported by the fact that the ground level O3concentrations, an indicator of
photochemical activity in an urban environment (Jenkin and Clemitshaw, 2000), were on average 48 % lower during over-cast conditions than during clear-sky conditions.
Past noon, both clear-sky and cloudy condition Aitken-mode particles had a second peak (between 13:00 and 14:00 LT for clear-sky conditions, and between 14:00 and 15:00 LT for cloud-covered conditions). Relative to the nucleation-mode particles the trend was opposite, suggesting that nucleation-mode particles had grown into the Aitken-mode. It further indicates an abundance of low or semi-volatile species. Again, the attenuation of UV radiation by clouds is the likely explanation for the difference between clear-sky and cloud-covered conditions.
The accumulation-mode number concentration peak oc-curred when the sun was directly overhead, at midday. Dur-ing cloudy days (precipitation periods omitted), there was less of a difference between the nighttime low (440 cm−3 between 02:00 and 03:00 LT) and the midday peak con-centrations (830 cm−3between 13:00 and 14:00 LT).
Clear-sky accumulation-mode particles peaked in the afternoon (2000 cm−3 between 12:00 and 13:00 LT) and accounts for
only a small fraction of the total particle number concentra-tion.
In the evening, especially after sunny days (18:00 LT and onwards), Aitken-mode particle concentrations had a num-ber concentration increase, while nucleation-mode particle concentrations dropped (Fig. 2b). There was a shift from nucleation-mode particles to Aitken-mode particles as the largest contributor to total particle number concentrations. The physical processes that lead to the shift are favoured in the evening, as the PBL becomes shallow and air grad-ually stagnates (Fig. 2c, d). The reaction between NO2and
O3form the NO3radical (Crutzen and Zimmermann, 1991),
which will not photodissociate during nighttime, and is a po-tent scavenger of VOCs. Nighttime nitrogen chemistry can, therefore, produce low-volatile organic species by reactions with NO3 radical (Crutzen and Zimmermann, 1991; Kroll
and Seinfeld, 2008). Thus, pre-existing nucleation-mode par-ticles can grow into the Aitken-mode regime as suggested from their inverse behaviour. In addition, sulphates and inor-ganic nitrates are likely to coat the particles too. The same behaviour has been reported for New Delhi. There, the geo-metric mean diameter (GMD) was low in the afternoon and increased into the night (M¨onkk¨onen et al., 2005).
a mean hourly variation from 0.9 to 2.6 m s−1, measured at
the Osasco station (Fig. 1). The reciprocal wind speed (i.e. inverse wind speed) is a measure of air mass stagnation and thus a measure of the potential of air pollution accumula-tion. Figure 2c shows that the stagnation was the highest in the early morning (around 06:00 LT) and when the air mass starts to warm the air masses start moving.
The diurnal variation of ground level pollution is also gov-erned by PBL depth and the stability of the PBL. During the measurement period, the PBL was convectively driven, as the predominance of moderate wind speeds (less than 4 m s−1)
were unlikely to cause mechanically driven PBL mixing. To aid the interpretation of the aerosol observations we used the NOAA – CIRES 20th century reanalysis version 2 data (Compo et al., 2011) on PBL depth at the closest grid point (23.809◦S, 46.875◦W) in the reanalysis data set
approxi-mately 30 km away to the south west, at an elevation 900 m. The reanalysis data used was available until the end of 2010 and; therefore, the plot is based on modelled data from 10 October 2010 until 31 December 2010.
The stagnant air mass during early mornings and the shal-low PBL exacerbate morning rush-hour pollution (Fig. 2c– d). These conditions help to build up aerosol pollution as-sociated with primary emissions. Traffic is the main source of primary aerosol particles, being most intense during early office hours, as well as in the afternoon rush hour. At noon, the relative PBL height was modelled to be 2.8 times higher than between 06:00 and 07:00 LT. This is in agreement with an earlier study by Bischoff-Gauß et al. (1998) in the area. In the late afternoon, the air mass was on the move and the PBL depth was high (Fig. 2c–d). Then, convectional mixing of ground level pollution with the air mass above, through-out the PBL, will not favour the accumulation of ground level pollutants. Just after sunrise, when the air tempera-ture starts to rise, the PBL height increases to a maximum at noon (Fig. 2d). Thus, PBL dynamics reflects observed aerosol number concentration diurnal patterns.
However, there were other factors playing in too. The mea-surement site was located at the western edge of the MASP. In the study by Oliveira et al. (2003), they conclude sea breeze, mountain valley circulation and urban heat island ef-fects are the key features of the diurnal variations in air mass movement, in the MASP. The surface air within the city is warmer than the surrounding rural areas and, therefore, a heat island in comparison to its surrounding (Oke, 1982). This leads to warm air ascending at the centre of the heat island generating low level horizontal surface winds towards the centre from peripheral, rural areas (Kusaka and Kimura, 2004). Since the site was located at the western edge of the MASP, a heat island effect would show up as westerly winds especially during clear-sky conditions.
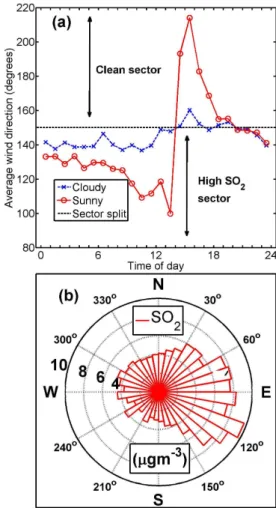
Figure 3a shows the mean diurnal wind direction mea-sured at the Osasco monitoring station. In the afternoon (14:00–18:00 LT), during sunny days, there was an over 100◦
wind shift towards southwest, suggesting a heat island
ef-Fig. 3.The diurnal cycle of wind direction and wind direction
de-pendence of SO2.(a)Diurnal cycle of average wind direction and
(b)the average sulphur dioxide (SO2)mass concentrations
mea-sured at the Osasco monitoring station in each wind direction sec-tor. The average wind direction was split into a clean sector and a
sector associated with elevated concentrations of SO2indicated by
the dashed line.
fect. SO2 is linked to fossil fuel combustion and thus
an-thropogenic emissions. Figure 3b shows the SO2
concentra-tions as a function of wind direction. Easterly winds originate from the geographical centre of the MASP and, therefore, exposed to anthropogenic emissions within the city, which explains the high SO2concentrations between 60◦and 140◦
(Fig. 3b). The wind shift towards the low SO2sector is
ar-guably the sector associated with less anthropogenic emis-sions. Bischoff-Grauß et al. (1998) showed that sea breeze (from the southeast) can reach the eastern suburbs of S˜ao Paulo and transport SO2from the industry area of Cubat˜ao
3.3 Diurnal cycles of aerosol optical properties
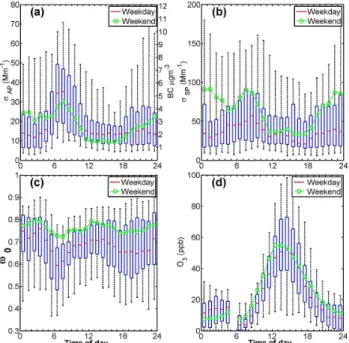
Aerosol optical properties are known to be of climatologi-cal significance (e.g. Haywood and Boucher, 2000; Haywood and Shine, 1995). The diurnal cycles of the aerosol optical properties and O3are shown in Fig. 4. Most notably, during
stagnant atmospheric conditions there was a morning rush-hour peak inσAP (and BC). Between 06:00 and 08:00 LT,
medianσAPpeaked at 35 Mm−1(equivalent to 5.3 µg m−3of
BC according to Eq. 1) during weekdays. Both coefficients had minima in the afternoon (Fig. 4a–b). In the afternoon, the weekday median σAP dropped to 13.8 Mm−1(12:00–13:00
LT), i.e. the morning rush-hour concentrations were 2.5 times higher. The growth of the PBL height (Fig. 2d) mixes ground level pollutants throughout the PBL and thus explains the ob-served decrease inσAP. At noon, the relative PBL height was 2.8 times higher than between 06:00 and 07:00 LT and con-sistent with the observed drop inσAP.
The weekday σSP also had a morning rush-hour peak, however, one hour later (08:00–09:00 LT) thanσAP. While
aerosol light absorption is dominated by BC particles, light-scattering species are mostly of secondary origin such as sul-phates, nitrates, and SOA. These groups are governed by the atmospheric reactivity of their precursors, and thus the con-centration of the initiating oxidants which affects the sec-ondary aerosol yield. Consequently, increased atmospheric reactivity will favour the accumulation of secondary aerosol mass and eventually impact light scattering coefficients. The formation and accumulation of nitrous acid (HONO) during the night is a known source of OH radicals when it photodis-sociates at sunrise. Subsequently, this leads to OH and HO2
radicals during early mornings (Aumont et al., 2003; Jacob, 2000), prior to the accumulation of O3which is a main
con-tributor of OH radicals during the day. These oxidants and the following sequence of reactions are likely contributors to the increase inσSP through secondary aerosol formation,
how-ever, one hour later than for the primary aerosol drivenσAP,
during the early morning rush hours. WeekdayσSP peaked at 08:00–09:00 LT (σSP=57.0 Mm−1). As was the case for the
Aitken-mode particles (Fig. 2b),σSP also had a somewhat
smaller midday peak (37.2 Mm−1, 13:00–14:00 LT).
Similar morning rush-hour peaks have been observed in, for example, Mexico City (Baumgardner et al., 2007; Paredes-Miranda, 2009) and Beijing (Garland et al., 2009). All report the highest light absorption and light scattering coefficients during morning rush hours and the lowest co-efficients in the afternoon. In the study by Baumgardner et al. (2007) the absorption coefficient reached just above 30 Mm−1 measured with a Particle Soot Absorption Pho-tometer (presumably at a wavelength of 565 nm). This is somewhat lower than the median 35 Mm−1we obtained (at a wavelength of 637 nm) considering an assumedλ−1 wave-length dependency. By using a more sophisticated measure-ment technique, they showed the average coating thickness to
Fig. 4.The diurnal cycle of aerosol optical properties and O3.
Diur-nal weekday cycle of(a)light absorption coefficients and BC mass
concentrations (on the right y-axis),(b)light scattering coefficients,
(c)single-scattering albedo at 637 nm and(d)ozone (O3)
concen-trations. The edges of the blue boxes represent the 75th and 25th percentiles and the black whiskers the 95th and 5th percentiles. Weekday diurnal median values are in red and weekends in green.
be the smallest during early mornings and thickest just past noon.
When BC particles get coated with sulphates, nitrates and organics their single-scattering albedo (ω0)increases, since these are light scattering species. In the morning, ω0 was at its lowest (Fig. 4c), especially during weekday mornings (ω0=0.59 between 06:00 and 07:00 LT) and peaked in the
afternoon (ω0=0.71 between 14 and 15:00 LT for
week-days). The diurnalω0maximum 0.76 occurred at night,
be-tween 03:00 and 04:00 LT. The minimum was consistent with the absorption peak discussed earlier, indicating a sig-nificant fraction of BC mass. During morning rush hour, the nocturnal boundary layer had not yet broken up (Fig. 2d), while traffic was heavy. When it broke up, the primary BC was diluted due to convectional mixing, and σAP
de-creased at ground level. At the same time, photochemistry becomes relevant and will cause gas-phase pollutants to par-tition between the gas phase and the condensed phase, thus coating the pre-existing particles, increasing the overallω0. Secondary aerosol formed through the photodissociation of HONO (which releases OH) is a likely contributor to the early morning increase inω0 (Fig. 4c, between 06:00 and
08:00 LT for weekdays), whereas O3(which is also a source
In the evening, there was a gradual decrease inω0, co-inciding with the evening rush hour. Nighttime atmospheric conditions are most stable and stagnant during the night. Af-ter sunset, NO3is formed (Crutzen and Zimmermann, 1991)
which is a known nighttime scavenger of organics and forms organic nitrates (Hallquist et al., 2009). Nighttime NO3will
contribute to additional secondary aerosol mass and thus in-crease theω0of the aerosol. In the stable nocturnal PBL, the
process can be observed for a longer period than during sun-light hours, which is whyω0 has its highest value at night
(between 03:00 and 04:00 LT).
There is a difference inω0 during weekdays and
week-ends. On the average, weekendω0was 0.072 higher than on
weekdays (0.706 for weekdays and 0.778 for weekends). A partial explanation would be less heavy-duty diesel vehicles on the road during weekends. However, this does not explain the higherσSPduring weekends (Fig. 4b).
Chemical transport models have shown a coupling be-tween O3 and particulate matter in an urban environment
(Meng et al., 1997). Thus, O3 is also linked to the optical
properties of the aerosol through secondary aerosol forma-tion. Although studies have shown that a high ethanol blend can reduce NOx emissions by 45 % (Graham et al., 2008)
the model run by Meng et al. (1997) predicts only a minor change in O3and PM2.5levels, given only NOxis reduced.
The study by Jang and Kamens (2001) points out the role of heterogeneous chemistry between the gas phase aldehyde functional groups and particulate matter in the presence of an acid catalyst, e.g. H2SO4. Furthermore, they argue that
considering the vapour pressures of atmospheric aldehydes (with less than eight carbons) they are unlikely to be accom-modated in the condensed-phase unless they first undergo heterogeneous reactions. Jacob (2000) points out the possi-bility of organic carbon aerosols as sinks for O3since they
have a high reactivity towards O3. The rates at which these
heterogeneous and multiple phase reactions become relevant forω0through a gain in secondary aerosol mass at the site
remains unknown. Although both O3concentrations andω0
peak at the same time during the day (Fig. 4c, d), the ω0
at the site was considerably lower than for the other cities listed in Table 1. A gain in secondary aerosol mass will in-crease the ω0 of the aerosol. The low ω0 of the aerosol,
in comparison to the other sites, is likely a consequence of less secondary aerosol mass (organic and inorganic) present in the aerosol at the site. It suggests that the formation of secondary aerosol mass from ethanol combustion associated emissions can be slow, in comparison to sites with little or no ethanol usage, since increased aldehyde emissions have pre-viously been linked to the formation of photochemical smog (Haagen-Smit, 1952; Tanner et al., 1988; Atkinson, 2000).
According to Ramanathan et al. (2001),ω0values below
0.85 result in a TOA positive climate forcing in general. Al-though strongly dependent onω0, the radiative properties of
an aerosol burden layer also depends on surface reflectance, cloud cover and the upscatter fraction (β) of the aerosol,
(Haywood and Boucher, 2000; Haywood and Shine, 1995; Ramanathan et al., 2001). According to Oke (1988), the sur-face reflectance for urban areas is on average 0.14 ranging between 0.09 and 0.27. Haywood and Shine (1995) report the critical single-scattering albedoωcrit at a givenβ. In the case ofω0< ωcrit, the TOA radiative forcing is positive (i.e. warming of the atmosphere). Considering the low surface re-flectance of urban areas, for the given range ofω0, the TOA
radiative forcing effect can be either positive or negative for the sources within the MASP. Since backscattering coeffi-cient were not measured it is not possible to calculateωcritfor
the data set. Another climatic effect of lowω0is related to the
fact that they may affect the vertical temperature structure in the lower troposphere with implications to atmospheric con-vection and cloud formation (Hansen et al., 1997; Herrmann and Hanel, 1997). Satheesh et al. (2010) show that a polluted continental aerosol layer will increase the temperature of the atmosphere and thus reduce it at the surface.
Further studies on howω0evolves downwind of the city are needed to uncover the true climatic implications for the aerosol pollution enforced by the sources within the MASP. Acetaldehyde, which is formed during ethanol combustion, can form peroxyacetyle nitrate (PAN) in the presence of NO2
(Tanner et al., 1988). The reaction is reversible which can lead to the formation O3downwind of the source with
possi-ble implications on the aerosol optical properties.
3.4 Observed evaporation of submicron aerosol
The growth of particles by condensable vapours depends on their concentration. Degradation initiating oxidants are able to start reactions which lower the saturation vapour pressure of gas-phase pollutants. As discussed earlier, the oxidation process will make them more likely to condense. If the con-densational growth of the particles stops, the condensation and evaporation processes are at steady state. Should the at-mospheric conditions change in a way that the concentration of the precursor vapour decreases (e.g. PBL growth), the con-densed semi-volatile species start to evaporate, and thus mak-ing the particles shrink in size. Other mechanisms may also cause particle mass to evaporate. For instance, the reversible reaction of ammonia (NH3)and HNO3produces ammonium
nitrate (NH4NO3)that is a well-known constituent of aerosol
particles. The amount of particulate NH4NO3depends on the
HNO3/NH3/NH4NO3equilibrium. If HNO3levels drop the
equilibrium can be shifted to favour the gas phase causing particulate NH4NO3to evaporate.
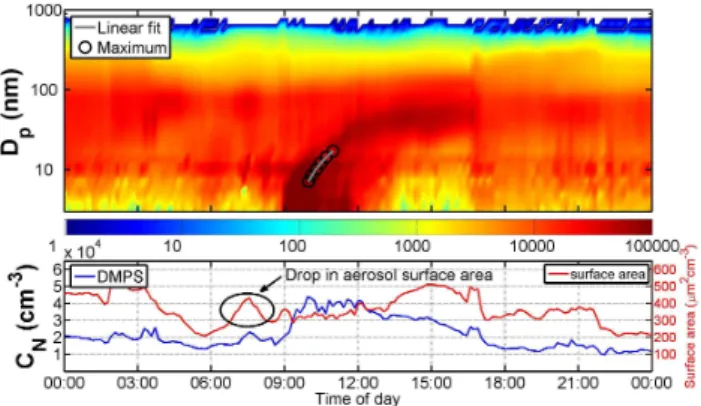
Fig. 5.Class II type event during morning hours and a shrinking mode in the early afternoon on 12 October 2010. The evaporation
rate of the shrinking mode was calculated to be 5.2 nm h−1(upper
panel). The split between NAIS and DMPS data in the picture is at 15 nm. During the evaporation (from 14:00 to 17:00 LT) the total
particle concentration (CN)declines constantly (middle panel). In
the middle panel, DMPS concentrations between 6 and 800 nm and CPC concentrations between 5 nm and 2.5 µm are shown. The lower
panel shows the H2SO4proxy concentration, and global irradiance
(Glob).
until 11:00 LT, it was partly cloudy (Fig. 5) and after 12:00 LT there was little or no cloud cover. Either a stable noctur-nal boundary layer broke up, or the boundary layer mixing height increased. This would dilute ground-level total par-ticle concentrations and the trace-gas levels thus explaining the observed evaporation. Aerosol mass spectrometer mea-surements would be vital in order to give a conclusive expla-nation for the observed evaporation.
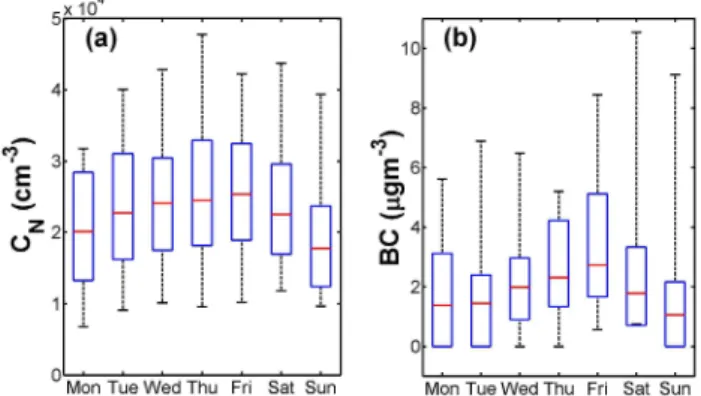
3.5 Weekly patterns
The total particle number concentration and BC mass con-centrations as a function of the day of the week is shown in Fig. 6. In general, the weekend particle number concen-trations were lower than during weekdays, because there is less traffic during weekends (Silva J´unior et al., 2009). Sun-day had the lowest and FriSun-day the highest median particle number concentrations, 1.78×10⁴and 2.53×104cm−3
re-spectively (Fig. 6a). A similar weekly cycle can also be seen for BC (Fig. 6b). BC concentrations were the lowest on Sun-days (1.1 µg m−3)and the highest on Fridays (2.7 µg m−3).
Seemingly, Saturdays were busy in terms of traffic and pol-lution associated with it. However, since Friday shows the highest concentrations (Fig. 6) there were likely carryovers from Friday to Saturday which, at least partly, explain the elevated concentrations on Saturday. This argumentation is supported by Fig. 2a which show elevated total particle num-ber concentrations during late night on weekends (half of which are Saturdays). This same diurnal cycle is also
evi-Fig. 6.The weekly cycle of total particle number concentrations and BC. Median values are in red, 75th and 25th percentiles in
blue and 95th and 5th percentiles as black whiskers. (a) The
weekly cycle of the total particle number concentration. Sundays
had the lowest and Fridays the highest concentrations, 1.78×10⁴
and 2.53×104cm−3, respectively, at STP conditions.(b)Median
BC mass concentrations show a similar pattern with the lowest
me-dian value of 1.06 µg m−3on Sundays, and the highest on Fridays
2.71 µg m−3.
dent from Fig. 4a–b showing BC mass concentrations and light scattering coefficients. Furthermore, there seems to be distinctively different traffic patterns during weekends and during weekdays (e.g. weekend evening BC concentrations were higher than during weekdays). The higher concentra-tions are not necessarily related to more traffic, but rather to traffic during a stable nocturnal boundary layer and in stag-nant air (Fig. 2c, d).
Vehicular emissions are a known source of nucleation-mode particles in urban environments (e.g. Kittelson et al., 2004; Sturm et al., 2003; Zhu et al., 2002). Subsequently, physical processes will shape the size distribution of the ve-hicular emissions which has been the focus of a number of studies (e.g. Kerminen et al., 2004; Kittelson, 2004; Wehner et al., 2002; Zhu et al., 2002). These studies have shown, however, to a varying degree, the persistence of the nucle-ation mode. Therefore, three log-normal modes were fitted to the size distributions (Fig. 7) using the method described by Hussein et al. (2005). Figure 7 shows the median particle number size distribution for weekdays and weekends. The distribution is the median concentration of each size-segment separated into weekdays and weekends.
During weekdays, nucleation-mode particles contributed the most to the total particle number concentration. Their me-dian concentration was 11 500 cm−3, whereas the medians
of the Aitken-mode and accumulation-mode particle concen-trations were 9300 cm−3and a 610 cm−3, respectively. Dur-ing weekends, the median concentrations of the nucleation and Aitken mode particles were roughly the same, 9400 and 9000 cm−3, respectively. The median concentration of the accumulation-mode particles on weekends was 640 cm−3.
Fig. 7. Three month median number size distribution with three modes fitted to the data. Weekday (weekend) modal peaks of the nucleation, Aitken, and accumulation mode particles are at 18 (18), 50 (48) and 213 (206) nm, respectively. Weekday (weekend) median modal particle concentrations are 11 500 (9400), 9300 (9000) and
610 (640) cm−3. The widths (σ )of the mode fits are 1.83 (1.89),
1.89 (1.92) and 1.40 (1.40).
18 nm. Weekday Aitken mode particles peak at 50 nm and accumulation mode at 213 nm. During weekends, nucleation, Aitken and accumulation mode particles peak at 18, 48 and 206 nm. Weekday (weekend) widths of the log-normal distri-butions (σ )were calculated to be 1.83 (1.89) for nucleation mode, 1.92 (1.92) for Aitken mode and 1.40 (1.40) for the accumulation mode particles. The peak of the median parti-cle number size distribution was at 24 nm during weekdays and at 29 nm during weekends.
3.6 New particle formation events
In addition to vehicular emissions, NPF events are a source of nucleation-mode particles. 10 NPF events were observed during 93 days (Table 2). They were classified into three classes. NPF events where growth was observed from the start, and the freshly formed particle grew continuously for several hours were classified as Class Ia events. Events which showed a growth of nucleation-mode particles, however, not from the beginning, were classified as Class Ib. Class II events were events for which no growth of the formed nucleation-mode particles could be calculated. In brief, this is the procedure for classifying described by Dal Maso et al. (2005), for regional nucleation events. Four class Ia events could be further analysed. The Class Ib events were likely local NPF events passing by the measurement station which would explain the absence of the initiation of the event. Two Class II type events were observed (Table 2). The rest of the days were classified as non-event days.
The most intense (i.e. the highestJ2,TOT formation rate)
NPF event observed had a GR of 9.3 nm h−1. The particle number size distributions measured during the event are pre-sented in Figs. 8 and 9. The event begins at 09:00 LT. The fast growth of the particles resulted in that the event showed
Fig. 8.The nucleation event measured on 2 November 2010. A
growth rate (GR6−20)of 9.3 nm h−1was calculated using DMPS
data from 6 to 20 nm. The black circles in the upper panel indicate peaks of the size distribution. The split between NAIS and DMPS data in the picture is at 15 nm.
Fig. 9. The nucleation event measured on 2 November 2010 by
the NAIS and the H2SO4 proxy concentration. The upper panel
shows naturally positively charged particle number size distribution (0.8–42 nm) measured with the NAIS on 2 November 2010. The
lower panel shows number concentrations of cluster (<1.8 nm),
in-termediate (1.8–7 nm) and large (7–42 nm) ions. The sulphuric acid
(H2SO4)proxy concentration is shown on the right axis.
up roughly the same time in both the DMPS and the NAIS. In Fig. 8, we can see a similar drop in total aerosol sur-face area before the event begins as was reported for Bei-jing, China (Wehner et al., 2004). The sulphuric acid proxy concentration (H2SO4)is shown in the lower panel of Fig. 9.
The proxy concentration was calculated using Eq. (5). The H2SO4proxy started to increase already at 08:00 LT, an hour
earlier than the NPF event. Later, when the H2SO4 proxy
concentration decreased just before noon, no new particles were formed, while the freshly nucleated particles contin-ued to grow into larger sizes. There are a couple of possi-bilities for this behaviour. Either there was a H2SO4
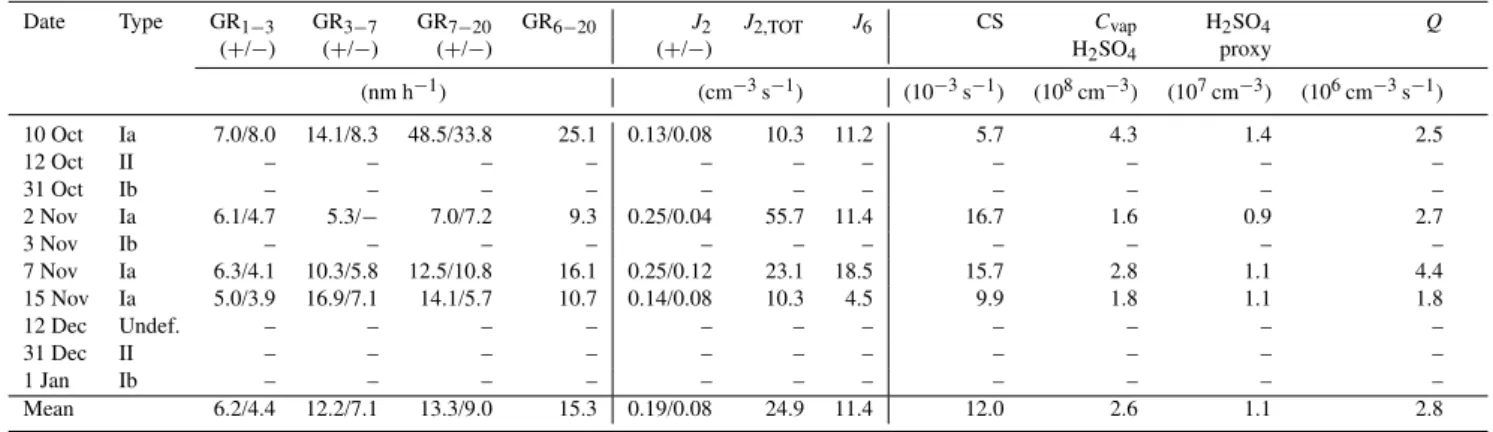
Table 2.Summary of observed new particle formation events between 10 October 2010 and 10 January 2011. They were classified according
to Dal Maso et al. (2005). The growth rates (GR) and particle fluxes (J) with two values were calculated from ion spectrometer data for both
polarities (+and−).J2,TOTwas calculated from corona-charged (negative) particles. The condensation sink (CS), vapour concentration
(Cvap)and production rates (Q) were calculated from DMPS data. The H2SO4proxy was calculated from SO2data (Pet¨aj¨a et al., 2009).
Date Type GR1−3 GR3−7 GR7−20 GR6−20 J2 J2,TOT J6 CS Cvap H2SO4 Q
(+/−) (+/−) (+/−) (+/−) H2SO4 proxy
(nm h−1) (cm−3s−1) (10−3s−1) (108cm−3) (107cm−3) (106cm−3s−1)
10 Oct Ia 7.0/8.0 14.1/8.3 48.5/33.8 25.1 0.13/0.08 10.3 11.2 5.7 4.3 1.4 2.5
12 Oct II – – – – – – – – – – –
31 Oct Ib – – – – – – – – – – –
2 Nov Ia 6.1/4.7 5.3/− 7.0/7.2 9.3 0.25/0.04 55.7 11.4 16.7 1.6 0.9 2.7
3 Nov Ib – – – – – – – – – – –
7 Nov Ia 6.3/4.1 10.3/5.8 12.5/10.8 16.1 0.25/0.12 23.1 18.5 15.7 2.8 1.1 4.4
15 Nov Ia 5.0/3.9 16.9/7.1 14.1/5.7 10.7 0.14/0.08 10.3 4.5 9.9 1.8 1.1 1.8
12 Dec Undef. – – – – – – – – – – –
31 Dec II – – – – – – – – – – –
1 Jan Ib – – – – – – – – – – –
Mean 6.2/4.4 12.2/7.1 13.3/9.0 15.3 0.19/0.08 24.9 11.4 12.0 2.6 1.1 2.8
for a different site. Furthermore, when there were no more nucleating vapours, the solar irradiation still increased to a maximum between 11:00 and 12:00 LT. The decline in the sulphuric acid proxy between 09:00 and 10:00 LT was due to less SO2, not solar irradiation. Increasing mixing height
due to thermal convection, as the day grew older, mixed the ground-level SO2 throughout the boundary layer. This
re-duced SO2concentrations, and consequently H2SO4proxy
concentrations, which are closely linked to NPF events. Since the trace gas monitoring station (used to derive the H2SO4proxy) was some 6 km away from the measurement
site, it adds uncertainties to both the timeframe and absolute concentrations. However, as the timing of the H2SO4proxy
and the NPF event match, we can expect to have nucleating particles at both stations. At a boreal forest environment in Finland, Nieminen et al. (2009) reported an order of mag-nitude lower threshold concentration of 3×105cm−3based
on measured H2SO4. The H2SO4 concentration needed to
explain the growth, calculated using Eq. (2) was on the av-erage, 2.6×108cm−3for S˜ao Paulo (Table 2). The average H2SO4proxy concentration was over an order of magnitude
less (1.1×107cm−3). However, still considering the uncer-tainties, there were most likely other vapours (e.g. organics) present in these NPF events contributing to particle growth (Jimenez et al., 2009; Orlando et al., 2010; Zhang, 2010). This is consistent with observations at other locations (e.g. Kulmala et al., 2001; Wehner et al., 2005).
A summary of the parameters derived from the NPF events as described in the methods section of this paper is given in Table 2. We chose to compare the results with re-sults from New Delhi, India (M¨onkk¨onen et al., 2005), Bei-jing, China (Wehner et al., 2004), and Mexico City Mex-ico (Dunn et al., 2004; Kalafut-Pettibone et al., 2011). In S˜ao Paulo, we observed GRs between 9 and 25 nm h−1. In New Delhi, India similar GRs have been observed (11– 18 nm h−1, M¨onkk¨onen et al., 2005). For Beijing, lower
growth rates have been reported (Wu et al., 2007). Also for Mexico City similar GRs have been reported ranging from 6 to 18 nm h−1 (Kalafut-Pettibone et al., 2011). This
is an order of magnitude higher GRs than what has been reported for a remote site in the Indian Himalayas (Neitola et al., 2011). M¨onkk¨onen et al. (2005) reported NPF with a CS in the range of 50–70×10−3s−1 which is by a fac-tor of 3–11 more than what was measured in S˜ao Paulo (in the range of 6–17×10−3s−1). Similarly, the vapour
produc-tion rate in New Delhi (9×10⁶–14×106cm−3s−1)was up
to one order of magnitude more than for S˜ao Paulo (1.5– 3.5×106cm−3s−1). In contrast to NPF in pristine
con-ditions (e.g. Dal Maso et al., 2005), we observed NPF events with a much higher pre-existing aerosol population of 2×104cm−3on 2 November 2010 (Fig. 8).
4 Summary and conclusions
The MASP has a population of 20 million and a vehicular fleet of 8.4 million, which is one fifth of the Brazilian ve-hicular fleet (CETESB, 2007). Although megacities cover a small area of land they have wide spread implications on the hydrological cycle, health and even the regional climate (IPCC, 2007; Lohmann and Feichter, 2005; Nel, 2005). De-mographic differences between cities result in a different pol-lution burden (Gurjar et al., 2008). A feature of the area is the use of bioethanol by the vehicular fleet. Ethanol as vehi-cle fuel results in increased acetaldehyde and formaldehyde emissions which favours the formation of O3(Atkins, 2000;
Graham et al., 2008; Seinfeld, 1989). The formation of O3
has a central role in the production of degradation initiating oxidants responsible for the photochemical smog which is characteristic for polluted areas (Atkinson, 2000; Jenkin and Clemitshaw, 2000; Kroll and Seinfeld, 2008).