AMTD
7, 6743–6790, 2014Multi-station intercomparison of
column-averaged methane
A. Ostler et al.
Title Page
Abstract Introduction
Conclusions References
Tables Figures
◭ ◮
◭ ◮
Back Close
Full Screen / Esc
Printer-friendly Version Interactive Discussion
Discussion
P
a
per
|
Discus
sion
P
a
per
|
Discussion
P
a
per
|
Discussion
P
a
per
|
Atmos. Meas. Tech. Discuss., 7, 6743–6790, 2014 www.atmos-meas-tech-discuss.net/7/6743/2014/ doi:10.5194/amtd-7-6743-2014
© Author(s) 2014. CC Attribution 3.0 License.
This discussion paper is/has been under review for the journal Atmospheric Measurement Techniques (AMT). Please refer to the corresponding final paper in AMT if available.
Multi-station intercomparison of
column-averaged methane from NDACC
and TCCON: impact of dynamical
variability
A. Ostler1, R. Sussmann1, M. Rettinger1, N. M. Deutscher3,4, S. Dohe2, F. Hase2,
N. Jones3, M. Palm4, and B.-M. Sinnhuber2
1
Karlsruhe Institute of Technology, IMK-IFU, Garmisch-Partenkirchen, Germany
2
Karlsruhe Institute of Technology, IMK-ASF, Karlsruhe, Germany
3
University of Wollongong, New South Wales, Australia
4
Institute of Environmental Physics, University of Bremen, Germany
Received: 10 April 2014 – Accepted: 4 June 2014 – Published: 10 July 2014
Correspondence to: A. Ostler ([email protected])
AMTD
7, 6743–6790, 2014Multi-station intercomparison of
column-averaged methane
A. Ostler et al.
Title Page
Abstract Introduction
Conclusions References
Tables Figures
◭ ◮
◭ ◮
Back Close
Full Screen / Esc
Printer-friendly Version Interactive Discussion
Discussion
P
a
per
|
Discus
sion
P
a
per
|
Discussion
P
a
per
|
Discussion
P
a
per
|
Abstract
Dry-air column-averaged mole fractions of methane (XCH4) retrieved from
ground-based solar Fourier transform infrared (FTIR) measurements provide valuable infor-mation for satellite validation, evaluation of chemistry-transport models, and source-sink-inversions. In this context, Sussmann et al. (2013) have shown that mid-infrared
5
(MIR) soundings from the Network for the Detection of Atmospheric Composition Change (NDACC) can be combined with near-infrared (NIR) soundings from the Total Carbon Column Observing Network (TCCON) without the need to apply an
overall intercalibration factor. However, in spite of efforts to reduce a priori impact,
some residual seasonal biases were identified, and the reasons behind remained
10
unclear. In extension to this previous work, which was based on multi-annual
quasi-coincident MIR and NIR measurements from the stations Garmisch (47.48◦N, 11.06◦E,
743 m a.s.l.) and Wollongong (34.41◦S, 150.88◦E, 30 m a.s.l.), we now investigate
up-graded retrievals with longer temporal coverage and include three additional stations
(Ny-Ålesund, 78.92◦N, 11.93◦E, 20 m a.s.l.; Karlsruhe, 49.08◦N, 8.43◦E, 110 m a.s.l.;
15
Izaña, 28.31◦N, 16.45◦W, 2.370 m a.s.l.). Our intercomparison results (except for
Ny-Ålesund) confirm that there is no overall bias between MIR and NIR XCH4 retrievals,
and all MIR and NIR time series reveal a quasi-periodic seasonal bias for all stations, except for Izaña.
We find that dynamical variability causes MIR–NIR differences of up to ∼30 ppb
20
for Ny-Ålesund, ∼20 ppb for Wollongong, ∼18 ppb for Garmisch, and ∼12 ppb for
Karlsruhe. The mechanisms behind this variability are elaborated via two case studies, one dealing with stratospheric subsidence induced by the polar vortex at Ny-Ålesund and the other with a deep stratospheric intrusion event at Garmisch. Smoothing
ef-fects caused by the dynamical variability during these events are different for MIR and
25
AMTD
7, 6743–6790, 2014Multi-station intercomparison of
column-averaged methane
A. Ostler et al.
Title Page
Abstract Introduction
Conclusions References
Tables Figures
◭ ◮
◭ ◮
Back Close
Full Screen / Esc
Printer-friendly Version Interactive Discussion
Discussion
P
a
per
|
Discus
sion
P
a
per
|
Discussion
P
a
per
|
Discussion
P
a
per
|
troposphere/lower stratosphere (UTLS) region. About 35 % of the FTIR measurement days at Garmisch are impacted by STE, and about 23 % of the measurement days at Ny-Ålesund are influenced by polar vortex subsidence. The exclusion of data af-fected by these dynamical situations resulted in improved agreement of MIR and NIR seasonal cycles for Ny-Ålesund and Garmisch.
5
We found that dynamical variability is a key factor in constraining the accuracy of MIR and NIR seasonal cycles. The only way to avoid this problem is to use more real-istic a priori profiles that take these dynamical events into account (e.g. via improved models), and/or to improve the FTIR retrievals to achieve a more uniform sensitivity at all altitudes (possibly including profile retrievals for the TCCON data).
10
1 Introduction
Atmospheric methane (CH4) is the most important anthropogenic greenhouse gas
af-ter carbon dioxide. The radiative forcing (RF) from emissions of CH4 for 2011 relative
to the pre-industrial time (1750) is 0.97 W m−2reflecting a significant contribution to the
total anthropogenic RF of 2.29 W m−2(Stocker et al., 2013). There is a diverse range of
15
sources of CH4emissions from the Earth, coming from biogenic, thermogenic and
py-rogenic formation processes. Among these three groups there are several sources that are driven by anthropogenic activities (livestock breeding, rice cultivation and,
exploita-tion of fossil fuels), whereas other main sources of CH4 are not directly influenced by
humans (natural wetlands, bio mass burning, termites). However, there are large
pos-20
itive CH4 feedbacks on climate warming such as increased emissions from wetlands
and melting hydrates (Dlugokencky et al., 2011). The latter process has attracted
spe-cial interest because a fast CH4 release from the insulated hydrate reservoir would
cause a massive warming effect within a few years (Archer, 2007).
Oxidation of atmospheric CH4 by hydroxyl radicals (OH) is responsible for about
25
90 % of the global CH4 sink. The remainder is absorbed by soils and by reactions
AMTD
7, 6743–6790, 2014Multi-station intercomparison of
column-averaged methane
A. Ostler et al.
Title Page
Abstract Introduction
Conclusions References
Tables Figures
◭ ◮
◭ ◮
Back Close
Full Screen / Esc
Printer-friendly Version Interactive Discussion
Discussion
P
a
per
|
Discus
sion
P
a
per
|
Discussion
P
a
per
|
Discussion
P
a
per
|
Another minor oxidation sink is the reaction with chlorine radicals in the marine bound-ary layer (Allan et al., 2007).
As a consequence of an imbalance between CH4 sources and sinks, the global
CH4 surface concentration has increased to ∼1803 ppb in 2011, thereby exceeding
the pre-industrial levels by about 150 % (Stocker et al., 2013). Attributing the changes
5
of atmospheric CH4 to source variations on historical time scales (Houweling et al.,
2008; Sapart et al., 2012) as well as in the recent past (Bousquet et al., 2006, 2011; Kirschke et al., 2013) has been subject of extensive research, but is still associated
with uncertainties. The ability to locate CH4emissions (anthropogenic and natural) on
small spatial and temporal scales will be essential for future climate policy with regard
10
to emission trading schemes. For this purpose, forward models and inversions need to
be improved. As these rely strongly on CH4measurements, it is necessary to increase
the network of CH4observations and to improve the accuracy of CH4measurements.
Indeed, the spatio-temporal coverage of atmospheric CH4measurements has been
consistently improved since the early 1980s (Kirschke et al., 2013). Global networks
15
for surface-based in situ measurements (i.e. Advanced Global Atmospheric Gases Ex-periment, AGAGE and network of National Oceanic and Atmospheric Administration, Earth System Research Laboratory, Global Monitoring Division, NOAA ESRL GMD) have been developed and airborne measurements in the free troposphere have been performed (e.g. Wofsy et al., 2011). Furthermore, remote-sensing measurements of
20
CH4 columns have been achieved by satellite instruments like SCIAMACHY
(Scan-ning Imaging Absorption Spectrometer for Atmospheric Cartography) aboard ENVISAT (Environmental Satellite) and TANSO (Thermal And Near-infrared Sensor for carbon Observation) on GOSAT (Greenhouse Gases Observing Satellite). The ground-based equivalents of the satellite observations are represented by the high-precision
Fourier-25
AMTD
7, 6743–6790, 2014Multi-station intercomparison of
column-averaged methane
A. Ostler et al.
Title Page
Abstract Introduction
Conclusions References
Tables Figures
◭ ◮
◭ ◮
Back Close
Full Screen / Esc
Printer-friendly Version Interactive Discussion
Discussion
P
a
per
|
Discus
sion
P
a
per
|
Discussion
P
a
per
|
Discussion
P
a
per
|
Because of their high accuracy for column-integrated CH4measurements, both
TC-CON (Butz et al., 2011; Schneising et al., 2012; Yoshida et al., 2013; Fraser et al., 2013) and NDACC (Sussmann et al., 2005; De Mazière et al., 2008) data have been used for satellite validation. Satellite retrievals are used extensively in top-down
esti-mates of CH4 emissions (Bergamaschi et al., 2009, 2013; Fraser et al., 2013; Monteil
5
et al., 2013; Houweling et al., 2013), therefore, NDACC/TCCON FTIR retrievals have a strong indirect influence on the accuracy of inversions. In addition, ground-based FTIR measurements can be directly utilized for validation of models (Houweling et al., 2010; Saito et al., 2012; Belikow et al., 2013) and inversions (Fraser et al., 2013). Thus,
it is obvious that ground-based FTIR retrievals of column-averaged CH4are a
corner-10
stone for satellite retrievals, chemistry transport models and inverse models.
By comparing column-averaged dry air mole fractions of methane (XCH4) from
NDACC and TCCON retrieved at the sites Garmisch (47.5◦N) and Wollongong
(34.5◦S), Sussmann et al. (2013) showed that the data from both networks can be
directly combined without performing an intercalibration. Because of its wider spatial
15
and temporal coverage such a joint data set can provide major benefits for validation as well as for long-term trend analysis. However, the obtained agreement between NDACC and TCCON retrievals was not perfect despite applying a refined
intercom-parison strategy accounting for differing a priori profiles and averaging kernels. The
reasons for these residual differences remained unexplained from this previous study.
20
In this paper we extend the previous work by Sussmann et al. (2013) by
updat-ing the FTIR time series and includupdat-ing three additional stations (Ny-Ålesund, 78.9◦N,
Karlsruhe, 49.1◦N, and Izaña, 28.3◦N), thereby covering diverse geophysical
condi-tions. Besides the intercomparison of NDACC and TCCON measurements, the main
focus of this study is understanding the impact of dynamical effects like stratospheric
25
subsidence and stratosphere-troposphere exchange (STE) processes on the residual
differences observed between NDACC and TCCON retrievals of CH
4.
AMTD
7, 6743–6790, 2014Multi-station intercomparison of
column-averaged methane
A. Ostler et al.
Title Page
Abstract Introduction
Conclusions References
Tables Figures
◭ ◮
◭ ◮
Back Close
Full Screen / Esc
Printer-friendly Version Interactive Discussion
Discussion
P
a
per
|
Discus
sion
P
a
per
|
Discussion
P
a
per
|
Discussion
P
a
per
|
After explaining the intercomparison strategy the corresponding results are shown in Sect. 3. Section 4 investigates in quantitative terms the impact of dynamical variability
on residual differences between MIR and NIR retrievals. This is performed via analysis
of one case study showing strong stratospheric subsidence induced by the polar vortex at Ny-Ålesund and another case study for a deep stratospheric intrusion event above
5
Garmisch. Finally, Sect. 5 gives a summary and conclusions.
2 Ground-based soundings of columnar methane in the MIR and NIR
The NDACC infrared working group currently consists of 22 sites with measurements dating back up to two decades. The NDACC retrievals are obtained from solar absorp-tion spectra recorded in the mid-infrared (MIR) spectral range. Since the establishment
10
of TCCON in 2004, solar absorption measurements in the near-infrared (NIR) have
started to provide high-precision retrievals of climate gases, like CO2, CH4, and N2O
(Wunch et al., 2011a). Today, there are around 20 operational TCCON sites.
The observational data set obtained from ground-based solar absorption measure-ments at Garmisch and Wollongong is extended by one year from the previous study
15
of Sussmann et al. (2013), until the end of 2012. Additionally, the intercomparison data set is supplemented by FTIR measurements from three further sites (Ny-Ålesund, Karlsruhe, Izaña), thereby covering diverse geophysical conditions (Table 1). The solar FTIR systems of the individual sites are described in Appendix A. The intercompari-son of MIR and NIR measurements requires that both MIR and NIR observations are
20
performed in alternating mode.
For the analysis of NDACC- and TCCON-type measurements we used the spectral fitting software SFIT (or PROFFIT) and GFIT, respectively (Pougatchev et al., 1995; Hase et al., 2004; Wunch et al., 2011a). The MIR and NIR retrieval strategies are iden-tical to the strategies used in Sussmann et al. (2013), with the exception of the update
25
AMTD
7, 6743–6790, 2014Multi-station intercomparison of
column-averaged methane
A. Ostler et al.
Title Page
Abstract Introduction
Conclusions References
Tables Figures
◭ ◮
◭ ◮
Back Close
Full Screen / Esc
Printer-friendly Version Interactive Discussion
Discussion
P
a
per
|
Discus
sion
P
a
per
|
Discussion
P
a
per
|
Discussion
P
a
per
|
et al., 2011) is used for retrieving XCH4from measurements in the mid-infrared spectral
region (2613–2921 cm−1). Within SFIT (or PROFFIT) a full profile retrieval is set up
us-ing a Tikhonov-L1 regularization with an altitude-constant regularization strength. One fixed a priori volume mixing ratio (vmr) profile is used per site, derived from the Whole
Atmosphere Chemistry Climate Model (WACCM, Garcia et al., 2007). The MIR XCH4
5
is calculated by dividing the retrieved total column by the corresponding dry pressure column.
For the NIR retrievals GFIT uses an iterative method of scaling the a priori profile to provide the best fit to the measured spectrum in the near-infrared spectral region
(5938–6076 cm−1). The retrieved total column is divided by the dry pressure column
10
derived from the simultaneously measured oxygen column (Wunch et al., 2011a) and subsequently scaled by the calibration factor 0.976. This calibration is used to account for spectroscopic uncertainties and was determined from various campaigns using co-incident airborne in situ measurements calibrated to the WMO scale (Wunch et al., 2010; Geibel et al., 2012). In contrast to that, MIR retrievals are used without
calibra-15
tion.
Further details of the retrieval strategies can be found in Sussmann et al. (2013). Note that the MIR measurements of Karlsruhe and Izaña were analyzed with the
re-trieval code PROFFIT instead of SFIT. Differences in these retrieval codes are not
expected to have an impact on the MIR retrievals as shown by Hase et al. (2004).
20
3 Intercomparison
3.1 Method
In addition to the direct intercomparison of MIR and NIR retrievals obtained with their individual retrieval a priori profiles, we will also investigate the intercomparison
re-sults after reducing the impact of differing a prioris of the MIR versus NIR retrievals.
25
AMTD
7, 6743–6790, 2014Multi-station intercomparison of
column-averaged methane
A. Ostler et al.
Title Page
Abstract Introduction
Conclusions References
Tables Figures
◭ ◮
◭ ◮
Back Close
Full Screen / Esc
Printer-friendly Version Interactive Discussion
Discussion
P
a
per
|
Discus
sion
P
a
per
|
Discussion
P
a
per
|
Discussion
P
a
per
|
see Eq. (1) therein. This strategy applies two crucial benefits: (i) Effects from diff
er-ing a priori profiles are eliminated by an a posteriori adjustment of the sounder-ings to
a common a priori profile x
common; (ii) differing smoothing terms caused by the
dif-fering averaging kernels are minimized by using time-dependent and site-dependent
profilesx
common that are as close as possible to the true profile xtrue at a site at the
5
moment of observation. As in Sussmann et al. (2013) we use 3-hourly sampled CH4
model profiles forx
common. The model profiles are provided by the Center for Climate
System Research/National Institute for Environmental Studies/Frontier Research Cen-ter for Global Change (CCSR/NIES/FRCGC) atmospheric general circulation model (AGCM) based CTM (hereafter, ACTM; Patra et al., 2009, 2011). The ACTM
simu-10
lations are operated at T42 spectral truncation in the horizontal and 67 vertical levels reaching from the Earth’s surface to the mesosphere (80 km). See Appendix B in Suss-mann et al. (2013) for more details on the ACTM profiles.
Although the use of Eq. (1) in Sussmann et al. (2013) eliminates the impact of
differing a priori profiles differences (MIR–NIR) can still arise because of a special
15
smoothing effect as explained in the following. The smoothing term for the MIR
re-trieval is (1−al
MIR)(x
l
common−x
l
true) wherea
l
MIR is the total column averaging kernel of
the MIR retrieval for model layerl. The analogous smoothing term for the NIR retrieval
(1−al
NIR)(x
l
common−xltrue) is different because in general it holds thata
l
MIR6=a
l
NIR. This
aspect is crucial for understanding the origin of possible residual XCH4 differences
20
(NIR–MIR). The magnitude of such residual XCH4differences (MIR–NIR) depends on
season because the averaging kernels show zenith angle dependence and, therefore, a seasonal behavior, shown in Fig. 2 in Sussmann et al. (2013). This seasonality of
residuals will be discussed in Sect. 3.2 below. The differences are largest when the
model differs the most from the true atmospheric profile, which is most likely to occur
25
in special atmospheric situations. Examples for this can be cases with strong
strato-spheric subsidence or stratostrato-spheric intrusions. Case studies that illustrate this effect
AMTD
7, 6743–6790, 2014Multi-station intercomparison of
column-averaged methane
A. Ostler et al.
Title Page
Abstract Introduction
Conclusions References
Tables Figures
◭ ◮
◭ ◮
Back Close
Full Screen / Esc
Printer-friendly Version Interactive Discussion
Discussion
P
a
per
|
Discus
sion
P
a
per
|
Discussion
P
a
per
|
Discussion
P
a
per
|
The intercomparison is based on monthly means calculated from individual MIR and
NIR measurements recorded on the same day. Only months with>5 MIR and>5 NIR
measurements have been included.
3.2 Results
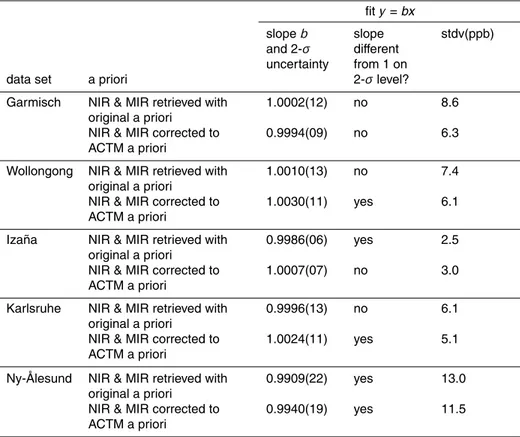
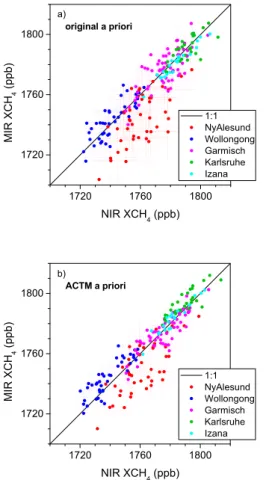
Figure 1a shows a scatter plot of the MIR and NIR monthly means containing data from
5
all five FTIR sites as retrieved with their original retrieval a priori profiles. Error bars on
data points are 2-σuncertainties derived from the standard deviation (stdv) of the linear
slope fit (2 stdv/√2) determined separately for each site, see Sussmann et al. (2013)
for a discussion of this error characterization. The linear MIR/NIR slopes (obtained from
linear fits forced through zero) are not significantly different from 1 for three stations,
10
i.e. 1.0002(12) for Garmisch, 1.0010(13) for Wollongong and 0.9996(13) for Karlsruhe,
see Table 2. However, they are significantly different from 1 for Izaña (0.9986(06)) and
for Ny-Ålesund (0.9909(22)). The slope for Izaña corresponds to a small bias in XCH4
(1.4 per mille) whereas there is a relatively big bias for Ny-Ålesund of 9.1 per mille. This means that the results of the direct intercomparison confirm the conclusion of
Suss-15
mann et al. (2013), that the MIR and NIR data set could be used together without the need of an intercalibration (except for Ny-Ålesund; possible reasons will be discussed in Sect. 4).
Figure 1b is the same as Fig. 1a but using ACTM profiles as common prior. The linear MIR/NIR slopes (obtained from linear fits forced through zero) are not significantly
dif-20
ferent from 1 for Garmisch (0.9994(09)) and Izaña (1.0007(07)). However, the MIR/NIR
slopes are different from 1 for Karlsruhe (1.0024(11)), Wollongong (1.0030(11)), and
Ny-Ålesund (0.9940(19)). It is not obvious that there is a significant improvement in
the overall agreement of the MIR and NIR XCH4 monthly means after the adjustment
to the common prior, except at Ny-Ålesund, where the difference of the linear slope
25
AMTD
7, 6743–6790, 2014Multi-station intercomparison of
column-averaged methane
A. Ostler et al.
Title Page
Abstract Introduction
Conclusions References
Tables Figures
◭ ◮
◭ ◮
Back Close
Full Screen / Esc
Printer-friendly Version Interactive Discussion
Discussion
P
a
per
|
Discus
sion
P
a
per
|
Discussion
P
a
per
|
Discussion
P
a
per
|
common ACTM a priori is that the seasonalities of the MIR and NIR XCH4time series
are in a better agreement.
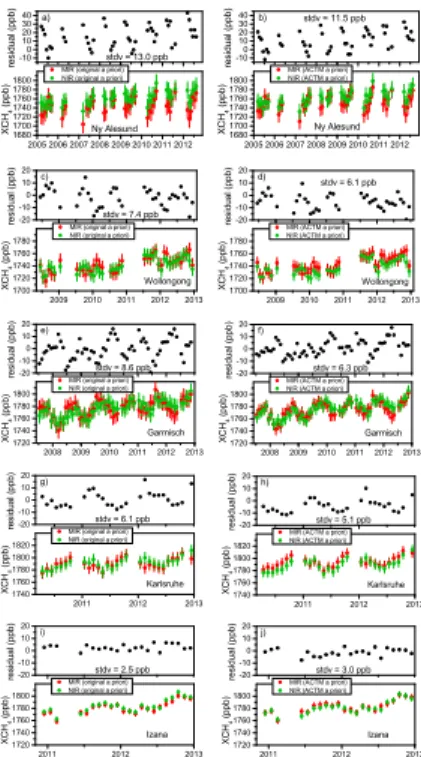
The MIR and NIR monthly mean time series for all stations are shown in Fig. 2a–j, retrieved with both their original retrieval a prioris and with the common ACTM prior.
It can be seen that for all stations except Izaña the stdv of the difference time series
5
(Fig. 2a–j, upper trace) is reduced by using the ACTM profiles as common prior. For Izaña there is no reduction of the stdv (Fig. 2j) because the MIR and NIR time series
are already in very good agreement (stdv=2.5 ppb) without applying the a posteriori
adjustment to a common a priori profile (Fig. 2i). This is probably due to generally fa-vorable measurement conditions at Izaña with a high fraction of days with unperturbed
10
clear sky conditions. An overview of all stdv’s and MIR/NIR slopes is given in Table 2. Although the use of ACTM as a common prior leads to an improved agreement
be-tween MIR and NIR XCH4, there are still differences, which can reach levels up to
30 ppb for Ny-Ålesund (Fig. 2b), 20 ppb for Wollongong (Fig. 2d), 18 ppb for Garmisch (Fig. 2f), and 12 ppb for Karlsruhe (Fig. 2h). Furthermore, Fig. 2 shows a periodicity in
15
the occurrence of the maximum differences at all stations except Izaña. These diff
er-ences could potentially lead to biases in the inferred seasonal CH4flux patterns if used
in model studies.
A principal explanation for such seasonal differences (MIR–NIR) has been given in
Sect. 3.1, i.e. ACTM profiles cannot completely resolve the local dynamical
variabil-20
ity caused by atmospheric processes like stratospheric subsidence or
stratosphere-troposphere exchange processes. In order to investigate this effect in quantitative terms
in the following section we present a case study of stratospheric subsidence induced by the polar vortex at Ny-Ålesund and another case study of a deep stratospheric intrusion event at Garmisch.
AMTD
7, 6743–6790, 2014Multi-station intercomparison of
column-averaged methane
A. Ostler et al.
Title Page
Abstract Introduction
Conclusions References
Tables Figures
◭ ◮
◭ ◮
Back Close
Full Screen / Esc
Printer-friendly Version Interactive Discussion
Discussion
P
a
per
|
Discus
sion
P
a
per
|
Discussion
P
a
per
|
Discussion
P
a
per
|
4 Effects of dynamical variability
4.1 Impact of subsidence
The motivation of this case study is to demonstrate and explain the effects of polar
sub-sidence on the MIR and NIR retrievals (Sect. 4.1.1). Furthermore, the total impact on the intercalibration results for Ny-Ålesund is inferred by excluding FTIR measurements
5
that are affected by polar vortex subsidence (Sect. 4.1.2).
4.1.1 Case study I: Ny-Ålesund on 25 March 2011
As shown by Lindenmaier et al. (2012) and Sinnhuber et al. (2011) the meteorological conditions during winter/spring 2011 formed a strong polar vortex that persisted into April. Besides that, high potential vorticity (PV) values of 46 PVU (potential vorticity
10
unit) on the 450 K potential temperature (PT) surface (ECMWF re-analysis, European Centre for Medium-Range Weather Forecasts) strongly indicate that Ny-Ålesund was underneath the area of the polar vortex on 25 March 2011.
Therefore, we investigate the impact of replacing the ACTM-based a priori profile with
a strongly subsided CH4 profile, which is typical for intra-vortex conditions and may
15
be more realistic for 25 March 2011 above Ny-Ålesund. Such a profile (labeled MIR
a priorisubsided) is given in Fig. 3a along with the ACTM profile for 25 March 2011 and
the standard retrieval a prioris. This subsided profile corresponds to the MIR standard retrieval a priori from WACCM, which has been modified to account for subsidence according to Toon et al. (1992), see Appendix B for details.
20
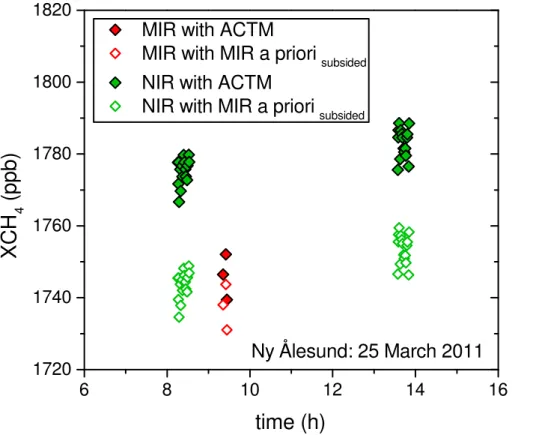
Figure 4 shows the MIR and NIR XCH4 as computed using the original ACTM as
common prior along with the case using MIR a priorisubsided. It can be seen that in the
case of using the original ACTM as a common prior, there is a significant difference
between the NIR and MIR retrievals (∼29 ppb for the time period 08:00–10:00 UT),
while there is good agreement if using the subsided profile MIR a priorisubsided (mean
25
AMTD
7, 6743–6790, 2014Multi-station intercomparison of
column-averaged methane
A. Ostler et al.
Title Page
Abstract Introduction
Conclusions References
Tables Figures
◭ ◮
◭ ◮
Back Close
Full Screen / Esc
Printer-friendly Version Interactive Discussion
Discussion
P
a
per
|
Discus
sion
P
a
per
|
Discussion
P
a
per
|
Discussion
P
a
per
|
from the fact that the NIR data based on ACTM prior are reduced by∼31 ppb (for the
time interval 08:00–10:00 UT) if MIR a priorisubsided is used instead. For the MIR data
the reduction due to the use of MIR a priorisubsided is only ∼8 ppb. This is due to the
fact that the NIR total column kernels are not as sensitive as the MIR total column kernels in the lower stratosphere (see Fig. 3b). Figure C1 shows an analogous plot
5
with the MIR and NIR retrievals based on their original standard a prioris. The effect of
using the subsided profile (MIR a priorisubsided) instead of the original standard retrieval
a prioris is very similar to the effect described with regard to Fig. 4, i.e. the difference
between the NIR and MIR retrievals is reduced from∼37 ppb to∼6 ppb (for the time
period 08:00–10:00 UT). Furthermore, MIR and NIR retrievals are reduced by 4 and
10
35 ppb, respectively, compared to the standard a prioris.
Our case study for Ny-Ålesund shows in quantitative terms that the effect of polar
subsidence on (xl
common−xltrue) can be high enough to significantly impact the
accu-racy of the MIR and NIR retrievals in a different way. Especially the NIR retrievals are
significantly affected when using a priori profiles which do not account for stratospheric
15
subsidence, because their averaging kernels are less sensitive in the stratosphere.
4.1.2 Exclusion of subsidence events
While the case study in Sect. 4.1.1 was focused on the different impacts of
strato-spheric subsidence on the MIR and NIR retrievals for a single day, we now investigate the overall impact of subsidence on the full Ny-Ålesund time series used for the
inter-20
comparison of MIR and NIR XCH4retrievals.
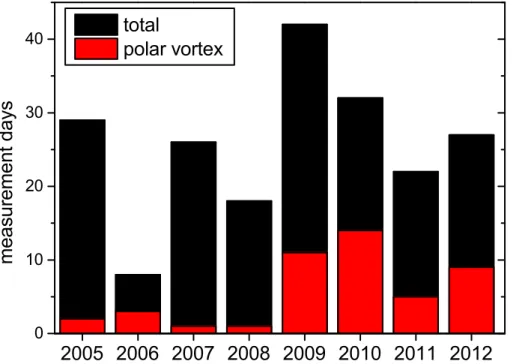
To identify the location of the polar vortex and the onset and breakup dates of the vor-tex, we used the criteria from Nash et al. (1996). Thereby, we determined if Ny-Ålesund was inside the vortex or not at the 450 K potential temperature level (about 18 km alti-tude). Figure 5 shows the number of FTIR measurement days at Ny-Ålesund that were
25
AMTD
7, 6743–6790, 2014Multi-station intercomparison of
column-averaged methane
A. Ostler et al.
Title Page
Abstract Introduction
Conclusions References
Tables Figures
◭ ◮
◭ ◮
Back Close
Full Screen / Esc
Printer-friendly Version Interactive Discussion
Discussion
P
a
per
|
Discus
sion
P
a
per
|
Discussion
P
a
per
|
Discussion
P
a
per
|
with the polar vortex period is limited to early spring. We found that the relative
frac-tion of FTIR measurement days influenced by the polar vortex is∼63 % in March and
∼57 % in April (averaged for the time period 2005–2012).
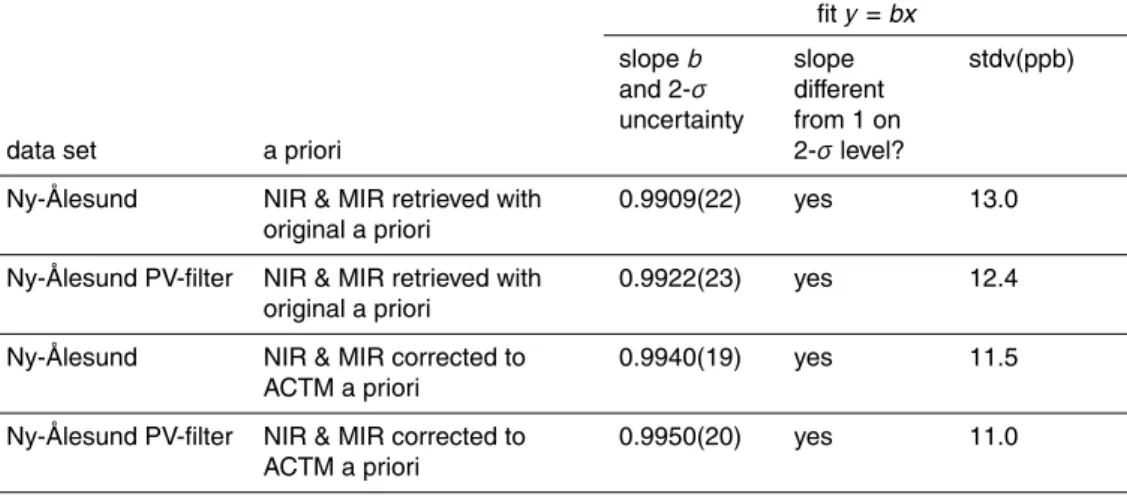
FTIR measurement days influenced by the polar vortex were excluded from the MIR/NIR intercomparison and monthly mean scatter plots (MIR versus NIR) were
ana-5
lyzed via linear fits. The parameters from these fits are listed in Table 3. The linear MIR/NIR slope of the data set that is corrected to ACTM as common prior is im-proved from 0.9940(19) to 0.9950(20) and the stdv is further reduced from 11.5 ppb to 11.0 ppb.
Despite these positive effects of the exclusion of polar vortex situations on the overall
10
intercomparison, there are still significant residual XCH4differences (MIR–NIR) for
Ny-Ålesund, which vary temporally (see Fig. C2). Hence, we speculate that deviations of the ACTM profiles from the true profiles in the stratosphere also occur outside the early spring period. Indeed, besides subsidence, there are further dynamical processes in
the UTLS region that may contribute to a variability of the CH4profile not captured by
15
ACTM. This assumption is supported by the fact that the residual XCH4 differences
from the stations Garmisch, Wollongong, and Karlsruhe cannot be linked to the polar vortex subsidence because of their geographical position. Therefore, the emphasis of Sect. 4.2 lies on the impact of dynamical variability caused by stratosphere-troposphere exchange (STE) processes.
20
4.2 Impact of stratosphere-troposphere exchange processes
Stratosphere-troposphere exchange (STE) processes cause the transport of air-masses across the tropopause. For a detailed overview of the extensive research related to STE processes with some focus on processes in the extra tropics we re-fer to Stohl et al. (2003). A considerable part of STE research dealt with the
im-25
pacts of STE on the tropospheric ozone (O3) budget due to its relevance to air quality
AMTD
7, 6743–6790, 2014Multi-station intercomparison of
column-averaged methane
A. Ostler et al.
Title Page
Abstract Introduction
Conclusions References
Tables Figures
◭ ◮
◭ ◮
Back Close
Full Screen / Esc
Printer-friendly Version Interactive Discussion
Discussion
P
a
per
|
Discus
sion
P
a
per
|
Discussion
P
a
per
|
Discussion
P
a
per
|
stratospheric intrusions in springtime of 2010 significantly increased surface ozone at high-elevation western US sites.
Whereas ozone related STE processes have been well studied, the impact of STE
processes on the CH4 budget has not been investigated very much. Nevertheless,
by observing a stratospheric intrusion event on 27 March 2010, Xiong et al. (2013)
5
revealed that areas with depleted CH4 are collocated with enhanced O3. They
ana-lyzed data from Atmospheric Infrared Sounder (AIRS) retrievals and used aircraft in
situ measurements that confirmed that CH4depletion occurred down to 550 hPa with
a decrease in mixing ratios of up to 100 ppb.
In order to investigate the (possibly differing) impact of STE processes on MIR
10
and NIR retrievals of XCH4, Sect. 4.2.1 deals with a stratospheric intrusion event on
6 March 2008 at Garmisch. After that, the aim of Sect. 4.2.2 is to estimate the
percent-age of FTIR measurements that are affected by STE-processes, and to identify the
consequences for the intercomparison of MIR and NIR retrievals at Garmisch.
4.2.1 Case study II: Garmisch on 6 March 2008
15
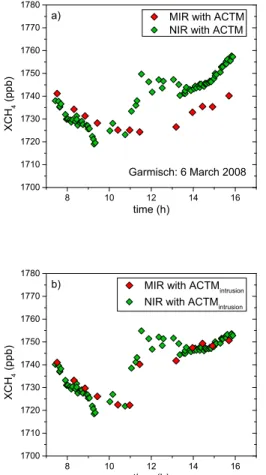
Figure 6a shows the single MIR and NIR XCH4values on 6 March 2008 as computed
with the a posteriori adjustment to the common ACTM prior. It is obvious that the
agree-ment between MIR and NIR XCH4is very good until 11:00 UTC, but then the NIR XCH4
increases by about 25 ppb within one hour. In contrast to that the MIR XCH4increases
only slightly, and this results in high XCH4residuals (NIR–MIR∼15 ppb).
20
We will show in the following that this significant increase in XCH4differences within
a short time scale of one hour is caused by a deep stratospheric intrusion event that was observed by the tropospheric ozone lidar at Garmisch. Details and illustrations of lidar sounding series detecting stratospheric intrusions very similar to our 6 March 2008 case can be found e.g. in Trickl et al. (2010). The lidar sounding series of 6 March 2008
25
AMTD
7, 6743–6790, 2014Multi-station intercomparison of
column-averaged methane
A. Ostler et al.
Title Page
Abstract Introduction
Conclusions References
Tables Figures
◭ ◮
◭ ◮
Back Close
Full Screen / Esc
Printer-friendly Version Interactive Discussion
Discussion
P
a
per
|
Discus
sion
P
a
per
|
Discussion
P
a
per
|
Discussion
P
a
per
|
range 6–10 km. Both regions are characterized by enhanced O3 volume mixing ratios
(typically up to 125 ppb). These layers with elevated ozone concentrations correspond
to areas of depleted CH4 volume mixing ratios. According to the lidar sounding, after
11:00 UTC there remains only one layer with ozone rich air masses, i.e. CH4-depleted
air masses in the UTLS region (8–15 km).
5
To respond to the dynamical variability induced by the stratospheric intrusion the MIR and NIR retrievals were re-corrected (Fig. 6b). The ACTM profiles were modified
in a simple manner to represent the depletion of CH4before 11:00 UTC (ACTMintrusion1)
and after 11:00 UTC (ACTMintrusion2). The magnitudes of the CH4 depletions used in
Fig. 7a correspond to typical values reported in the study by Xiong et al. (2013).
10
The transformation of O3lidar soundings into CH4profiles is just a semi-quantitative
approach. However, the re-correction of the MIR and NIR retrievals to the modified ACTM a priori profiles of Fig. 7a results in a nearly perfect agreement between MIR
and NIR XCH4 as shown in Fig. 6b. The re-correction effect on the NIR retrievals
is small (<5 ppb) because the NIR total column retrievals shows high sensitivity in
15
the troposphere and the lowest stratosphere (see Fig. 7b). The effect on the MIR
re-trievals, however, is twofold: although the MIR total column kernels are not perfectly
sensitive in the troposphere (Fig. 7b) there is almost no re-correction effect on the
MIR retrievals until 11:00 UTC. This is because of two smoothing effects, which
com-pensated each other before the re-correction was applied. The lower-layer CH4
deple-20
tion (Fig. 7a, ACTMintrusion1, 2–4 km) was underestimated (see MIR averaging kernel
in Fig. 7b) while the upper-layer CH4depletion (Fig. 7a, ACTMintrusion1, 6–10 km) was
overestimated (see MIR averaging kernel in Fig. 7b). Therefore, there was no net effect
on the MIR retrievals before 11:00 UTC. However, after 11:00 UTC, MIR XCH4was
sig-nificantly lower than NIR XCH4 because of an overestimation of the CH4 depletion in
25
the UTLS region (Fig. 7a, ACTMintrusion2, 8–15 km, see MIR averaging kernel in Fig. 7b).
The re-correction effect on MIR retrievals after 11:00 UTC corresponds to an increase
AMTD
7, 6743–6790, 2014Multi-station intercomparison of
column-averaged methane
A. Ostler et al.
Title Page
Abstract Introduction
Conclusions References
Tables Figures
◭ ◮
◭ ◮
Back Close
Full Screen / Esc
Printer-friendly Version Interactive Discussion
Discussion
P
a
per
|
Discus
sion
P
a
per
|
Discussion
P
a
per
|
Discussion
P
a
per
|
the re-corrected MIR and NIR XCH4 (Fig. 6b) in relation to the basic features of the
stratospheric intrusion above Garmisch.
Finally, we can understand the significant step in both MIR and NIR XCH4which can
be seen after 11:00 UTC. The two tropospheric layers of CH4-depleted air in the time
period until their dissipation at 11:00 UTC have a bigger impact on XCH4compared to
5
the CH4depletion in the UTLS after 11:00 UTC because the relative fraction of air mass
is higher in the troposphere. Therefore, the mean XCH4 (NIR, MIR) before 11:00 UTC
is about 20 ppb lower than for the time period after 11:00 UTC. This is the first time that
such a significant intra-day increase in XCH4(1.15 %) could be detected from
ground-based FTIR retrievals and explained by the dynamical variability of a stratospheric
10
intrusion event.
4.2.2 Exclusion of STE-events
For the detection of stratospheric intrusions coincident to FTIR measurements at Garmisch we adapted an approach for the analysis of stratospheric intrusions that was introduced by Trickl et al. (2010). This strategy uses STE trajectories based on
15
ECMWF data. These STE trajectories represent a small subset of four-day forward tra-jectories calculated with the Lagrangian Analysis Tool (LAGRANTO; Wernli and Davies, 1997) and are defined through two requirements: they are (i) initially residing in the stratosphere and then (ii) during the following four days are descending by more than 300 hPa into the troposphere.
20
For each day, STE trajectories have been calculated for the start times 00:00 UTC and 12:00 UTC, and distributed by automated electronic mail by ETH Zürich (Swiss Federal Institute of Technology). As an example, Fig. 8 shows the intrusion trajectories initiated on 16 August 2007 at 12:00 UTC. For the identification of the stratospheric
in-trusions at Garmisch we defined a detection area of±1◦(latitude and longitude) around
25
AMTD
7, 6743–6790, 2014Multi-station intercomparison of
column-averaged methane
A. Ostler et al.
Title Page
Abstract Introduction
Conclusions References
Tables Figures
◭ ◮
◭ ◮
Back Close
Full Screen / Esc
Printer-friendly Version Interactive Discussion
Discussion
P
a
per
|
Discus
sion
P
a
per
|
Discussion
P
a
per
|
Discussion
P
a
per
|
In addition, trajectory calculations were carried out with the HYSPLIT model. The HYSPLIT trajectories were evaluated according to the approach by Trickl et al. (2010, Sect. 2.3 therein) for identifying stratospheric intrusions at Garmisch. (Note that the detection analysis of stratospheric intrusions could not be made for the complete FTIR data set because of some missing trajectories. Nevertheless, the analysis covers the
5
majority of the FTIR measurements.)
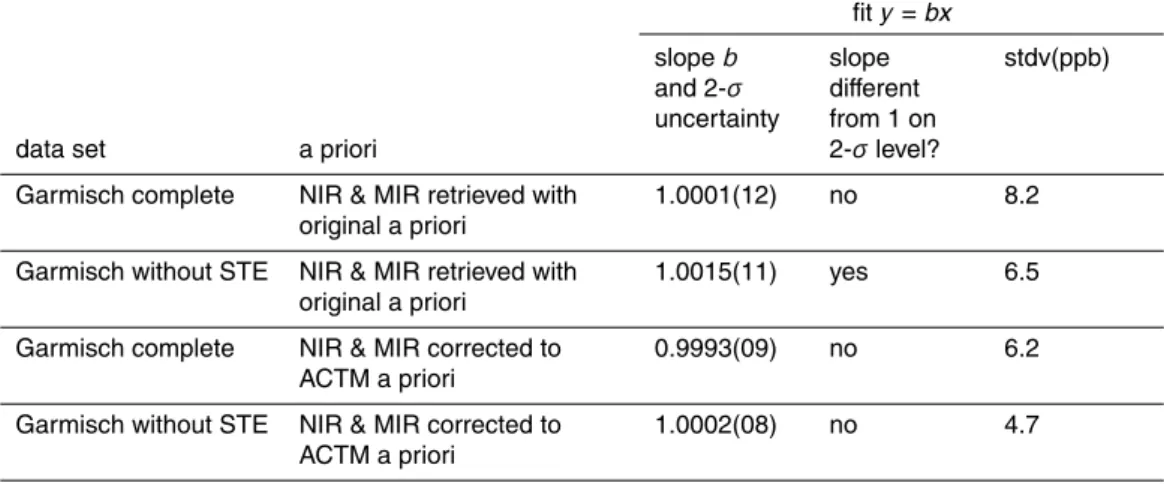
Our analysis reveals that ∼35 % of the FTIR measurement days at Garmisch are
influenced by STE processes. The exclusion of the affected XCH
4 data yields a
sig-nificantly improved agreement between MIR and NIR retrievals as retrieved with their original retrieval a priori profiles. The same holds true using ACTM as common prior,
10
see Fig. 9a and b, respectively. The stdv of the difference time series NIR–MIR using
the original and common ACTM priors (see Fig. C3) is reduced from 8.2 ppb to 6.5 ppb and from 6.2 ppb to 4.7 ppb, respectively. All fit parameters for the data sets of the STE analysis at Garmisch are given in Table 4.
The improved agreement is achieved by the fact that measurement days with high
15
residual XCH4 differences, caused by different smoothing terms related to STE, are
filtered out. Winter months are particularly affected by this extra filter criterion. This is
in accordance with Sprenger and Wernli (2003), who showed that STE in the Northern Hemisphere has a distinct seasonal cycle with a flat maximum from December to April and a pronounced minimum in August and September.
20
Another outcome from Sprenger and Wernli (2003) is that at a subtropical site like Izaña the frequency of STE events is much lower than at mid-latitude sites like Garmisch, Karlsruhe, or Wollongong. Hence, the overall impact of STE processes on Izaña MIR and NIR retrievals is small compared to the other sites. This is confirmed by the very good agreement between MIR and NIR seasonalities at Izaña. Also, the polar
25
site Ny-Ålesund is more influenced by STE processes than Izaña and thereby the MIR
and NIR retrievals at Ny-Ålesund are affected by a second mechanism of dynamical
variability in addition to polar subsidence. Besides that, we expect that remaining XCH4
differences (NIR–MIR) are caused by near-surface CH
AMTD
7, 6743–6790, 2014Multi-station intercomparison of
column-averaged methane
A. Ostler et al.
Title Page
Abstract Introduction
Conclusions References
Tables Figures
◭ ◮
◭ ◮
Back Close
Full Screen / Esc
Printer-friendly Version Interactive Discussion
Discussion
P
a
per
|
Discus
sion
P
a
per
|
Discussion
P
a
per
|
Discussion
P
a
per
|
different MIR and NIR retrieval sensitivities. As the high mountain site Izaña is usually
located above the planetary boundary layer (PBL), there should not be an impact on MIR and NIR retrievals. In contrast to that, Garmisch is located inside the PBL and
therefore MIR and NIR retrievals are affected by this CH
4 variability. For this reason,
MIR and NIR retrievals at Izaña are expected to be in better agreement compared
5
to Garmisch (and this is in line with our results), although retrievals affected by STE
processes have been excluded for Garmisch.
Finally, the qualitative findings from the STE analysis of MIR and NIR retrievals at Garmisch can be transferred directly to the sites Karlsruhe, Wollongong, and Ny-Ålesund. As explained above, they are consistent with the site-specific characteristics
10
at Izaña.
5 Summary and conclusions
We have compared MIR (NDACC) and NIR (TCCON) retrievals of XCH4 obtained at
the sites Garmisch, Karlsruhe, Izaña, Wollongong, and Ny-Ålesund. Our intercompar-ison results (Table 2) confirm the major findings from Sussmann et al. (2013). That is,
15
there is no need to apply an MIR/NIR intercalibration factor due to very good overall agreement of the original MIR and NIR data sets as retrieved (except Ny-Ålesund). Furthermore, we showed that the remaining seasonal bias could be reduced by using a realistic site-specific and time-dependent common prior (ACTM). However, residual
differences in Sussmann et al. (2013) and also in the present study reached
signifi-20
cant levels (up to∼30 ppb for Ny-Ålesund), limiting the accuracy of the MIR and NIR
seasonal cycles.
In this paper we were able to show that dynamical variability is the main source
for these residual differences. Thereby, we complement the outcomes from Sussmann
et al. (2013) with important additional findings about the characteristics of MIR and NIR
25
AMTD
7, 6743–6790, 2014Multi-station intercomparison of
column-averaged methane
A. Ostler et al.
Title Page
Abstract Introduction
Conclusions References
Tables Figures
◭ ◮
◭ ◮
Back Close
Full Screen / Esc
Printer-friendly Version Interactive Discussion
Discussion
P
a
per
|
Discus
sion
P
a
per
|
Discussion
P
a
per
|
Discussion
P
a
per
|
In extreme scenarios of atmospheric variability, i.e. stratospheric subsidence or deep
STE-events, the approach using a common model prior to reduce differing smoothing
errors fails because the model profile is likely to deviate from the true atmospheric CH4
profile. By means of a case study we showed that stratospheric subsidence at
Ny-Ålesund is associated with large differences between MIR and NIR retrievals (∼29 ppb
5
for the time period 08:00–10:00 UT on 25 March 2011). Another case study indicated
that a deep stratospheric intrusion at Garmisch gives rise to residual differences of up
to∼15 ppb. Due to the different vertical sensitivities (averaging kernels), the
smooth-ing effects of MIR and NIR retrievals are unequal for both case studies. While NIR
re-trievals are affected by stratospheric subsidence more than MIR retrievals, the situation
10
is reversed for STE-processes like deep stratospheric intrusions. As a consequence,
both the exclusion of Ny-Ålesund retrievals affected by stratospheric subsidence and
the exclusion of Garmisch retrievals affected by STE-processes resulted in improved
agreement of MIR and NIR seasonal cycles (Tables 3 and 4).
We found that 23 % of the FTIR measurement days at Ny-Ålesund are influenced by
15
the polar vortex and 35 % of the FTIR measurement days at Garmisch are influenced
by STE. Considering that the high increase in XCH4 of ∼25 ppb within one hour at
Garmisch is related to a deep stratospheric intrusion, it is obvious that such
STE-processes are able to introduce a remarkable variation in XCH4. From the geographical
and seasonal variability of STE presented in Sprenger and Wernli (2003) we conclude
20
that, in contrast to Izaña, the other mid-latitude sites (Karlsruhe, Wollongong) and the
polar site (Ny-Ålesund) are also affected by STE-processes. This is in line with the very
good agreement of the MIR and NIR seasonal cycles for Izaña.
We conclude that atmospheric variability is a key factor in constraining the accuracy of MIR and NIR seasonal cycles. The quality of MIR and NIR data is directly linked
25
to smoothing effects. Therefore, NIR retrievals at polar sites may be improved by
ac-counting for stratospheric subsidence in the standard retrieval a priori. Improving the
quality of MIR retrievals affected by STE seems to be more complicated due to the
AMTD
7, 6743–6790, 2014Multi-station intercomparison of
column-averaged methane
A. Ostler et al.
Title Page
Abstract Introduction
Conclusions References
Tables Figures
◭ ◮
◭ ◮
Back Close
Full Screen / Esc
Printer-friendly Version Interactive Discussion
Discussion
P
a
per
|
Discus
sion
P
a
per
|
Discussion
P
a
per
|
Discussion
P
a
per
|
from high-resolution models reflecting small-scale processes could help to reduce MIR
smoothing effects. An alternative method to overcome this problem would be to further
improve the FTIR retrievals with the target to achieve a more uniform sensitivity at all altitudes. i.e., if the MIR averaging kernel was more evenly weighted with altitude then the MIR dependence on STE should be reduced. Also, using a formal optimal
estima-5
tion (OE) inverse technique in GFIT could foreseeably help to improve the sensitivity of NIR retrievals to subsidence.
Besides that, the outcomes of this paper confirm that the inclusion of an accurate model representation of atmospheric transport is essential for inverse models when
using MIR and NIR retrievals of XCH4. For instance, within inverse models MIR and NIR
10
XCH4variations from dynamical variability will be attributed incorrectly to distributions
and magnitudes of CH4emissions if the atmospheric transport model is not precise.
When using NDACC and/or TCCON XCH4 data, it is critical to be aware of the
ef-fects of dynamical events on the accuracy of the relevant data set. Depending on the
requirements on data accuracy, NDACC and/or TCCON XCH4data can be used with or
15
without the exclusion of dynamical events. Methods to detect these events have been presented in this study. Given a proper data use based on the findings in this paper, a joint NDACC and TCCON data set will result in wider spatial and longer temporal
coverage of XCH4 data for the validation of top-down estimates, satellite validation,
and trend studies.
20
Appendix A: Description of FTIR sounding sites
A1 Garmisch
The Garmisch solar FTIR system (47.48◦N, 11.06◦E, 743 m a.s.l.) is operated by the
group “Variability and Trends” at the Institute of Meteorology and Climate Research – Atmospheric Environmental Research (IMK-IFU), Karlsruhe Institute of Technology
25
AMTD
7, 6743–6790, 2014Multi-station intercomparison of
column-averaged methane
A. Ostler et al.
Title Page
Abstract Introduction
Conclusions References
Tables Figures
◭ ◮
◭ ◮
Back Close
Full Screen / Esc
Printer-friendly Version Interactive Discussion
Discussion
P
a
per
|
Discus
sion
P
a
per
|
Discussion
P
a
per
|
Discussion
P
a
per
|
a Bruker IFS125HR interferometer. NIR forward and backward single-scan
measure-ments are recorded with an InGaAs detector by using a maximum optical path diff
er-ence of 45 cm. In the MIR spectral range the solar absorption spectra are detected with
an InSb detector using a maximum optical path difference of 175 cm and averaging six
scans with an integration time of approximately seven minutes.
5
The Garmisch FTIR system took part in the aircraft calibration campaign of the EU project IMECC (Infrastructure for Measurement of the European Carbon Cycle) (Messerschmidt et al., 2011; Geibel et al., 2012). Garmisch FTIR measurements have been used for satellite validation (de Laat et al., 2010; Morino et al., 2011; Wunch et al., 2011b), carbon cycle research (Chevallier et al., 2011), and studies of
atmo-10
spheric variability and trends (e.g., Borsdorff and Sussmann, 2009; Sussmann et al.,
2009, 2012). The intercalibration of MIR and NIR measurements in this study covers the time period from July 2007–December 2012.
A2 Wollongong
The Wollongong solar FTIR system (34.41◦S, 150.88◦E, 30 m a.s.l.) is operated by
15
the Center for Atmospheric Chemistry at the University of Wollongong, Australia. The intercomparison uses the Wollongong time series of June 2008–December 2012. In this time period the FTIR measurements were performed with a Bruker IFS125HR in-strument. The settings for NIR measurements are identical to those at Garmisch. In the MIR spectral range solar absorption spectra were recorded with an InSb detector, using
20
an optical path difference of 257 cm and averaging two scans with an integration time
AMTD
7, 6743–6790, 2014Multi-station intercomparison of
column-averaged methane
A. Ostler et al.
Title Page
Abstract Introduction
Conclusions References
Tables Figures
◭ ◮
◭ ◮
Back Close
Full Screen / Esc
Printer-friendly Version Interactive Discussion
Discussion
P
a
per
|
Discus
sion
P
a
per
|
Discussion
P
a
per
|
Discussion
P
a
per
|
A3 Karlsruhe
The Karlsruhe solar FTIR system (49.08◦N, 8.43◦E, 110 m a.s.l.) is operated by the
group “Ground-based remote-sensing” at the Institute for Meteorology and Climate Research – Atmospheric Trace Gases (IMK-ASF), KIT, Germany. In 2009 a new FTIR container with a Bruker IFS125HR interferometer has been set up for solar absorption
5
measurements in the MIR and NIR.
The settings for NIR measurements are identical to those at Garmisch. MIR
mea-surements are performed with an InSb detector using a maximum optical path diff
er-ence of 180 cm. Four scans are averaged with an integration time of 9.5 min. This study uses MIR and NIR measurements out of the time period from March 2010–December
10
2012. The Karlsruhe FTIR system participated in the aircraft calibration campaign of the EU project IMECC.
A4 Izaña
The Izaña solar FTIR system (28.31◦N, 16.45◦W, 2370 m a.s.l.) is located on the
Ca-nary Island of Tenerife and is part of a collaboration between the Meteorological State
15
Agency of Spain (Spanish acronym: AEMET) and KIT. It is operated by the Izaña At-mospheric Research Center and the responsibility for the FTIR experiment lies with IMK-ASF of the Karlsruhe Institute for Technology (KIT).
Because measurements from 2007–2010 are affected by laser sampling ghosts the
intercalibration only uses FTIR data from December 2010–December 2012 which have
20
been recorded with a Bruker IFS125HR interferometer. The settings for NIR measure-ments are identical to those at Karlsruhe. The interferograms for the MIR retrievals are
operated with an InSb detector using a maximum optical path difference of 180 cm
be-fore averaging six scans with an integration time of about seven minutes. Izaña FTIR measurements have been used for a long-term validation of tropospheric
column-25
AMTD
7, 6743–6790, 2014Multi-station intercomparison of
column-averaged methane
A. Ostler et al.
Title Page
Abstract Introduction
Conclusions References
Tables Figures
◭ ◮
◭ ◮
Back Close
Full Screen / Esc
Printer-friendly Version Interactive Discussion
Discussion
P
a
per
|
Discus
sion
P
a
per
|
Discussion
P
a
per
|
Discussion
P
a
per
|
have also been part of technical study about a method for ghost correction in historic near-infrared FTIR measurements (Dohe et al., 2013).
A5 Ny-Ålesund
The Ny-Ålesund solar FTIR system (78.92◦N, 11.93◦E, 20 m a.s.l.) is part of the the
joint French-German Polar Research Base AWIPEV (Alfred Wegener Institute for Polar
5
and Marine Research and the French Polar Institute Paul Emile Victor) on the Sval-bard archipelago. The intercalibration contains FTIR measurements from March 2005– August 2012 which have been performed with a Bruker 120HR interferometer by the AWI Potsdam and the University of Bremen. Ground-based solar absorption measure-ments are operated from the end of March until the end of September when the polar
10
night begins.
Column-averaged methane is retrieved from double-scan TCCON-type
measure-ments recorded with an InGaAs diode using a maximum optical path difference of
30 cm. No DC/solar intensity variation correction was applied to Ny-Ålesund data. MIR
retrievals are recorded with an InSb detector by using an optical path difference of
15
180 cm. Two scans are averaged with an integration time of approximately 2.5 min.
Appendix B: Derivation of a typical strongly subsided CH4profile for Ny-Ålesund
Inside the polar vortex stratospheric subsidence leads to a depletion of the total columns of tropospheric source gases, whereas outside the polar vortex the columns of these gases remain unchanged. Based on the assumption that this variation of total
20
columns is the result of vertical transport alone, Toon et al. (1992) derived a mapping transformation which links points on the vmr profile outside the vortex to the same vmr inside according to the relation
vmrsubsided(z)=vmr(z(1+DOS)), (B1)
where DOS is the degree of subsidence.
AMTD
7, 6743–6790, 2014Multi-station intercomparison of
column-averaged methane
A. Ostler et al.
Title Page
Abstract Introduction
Conclusions References
Tables Figures
◭ ◮
◭ ◮
Back Close
Full Screen / Esc
Printer-friendly Version Interactive Discussion
Discussion
P
a
per
|
Discus
sion
P
a
per
|
Discussion
P
a
per
|
Discussion
P
a
per
|
As explained in Sect. 4.1.1 Ny-Ålesund was affected by strong subsidence on
25 March 2011. Therefore, we decided to use a typical maximum DOS value of 0.44 to account for subsidence in the MIR and NIR retrievals on 25 March 2011. Equation (B1) was applied to the MIR original a priori profile (from WACCM) above the tropopause to
get a subsided common prior (see Fig. 3a, MIR a priorisubsided).
5
Acknowledgements. We are indebted to P. K. Patra (JAMSTEC) for providing ACTM model data and thank T. Blumenstock (KIT) and O. E. García-Rodríguez (AEMET) for making Izaña FTIR data available. Furthermore, we thank D.W.T. Griffith (University of Wollongong)
and J. Notholt (IUP) for providing FTIR data from Wollongong and Ny-Ålesund, respectively. We thank H. P. Schmid (IMK-IFU) for his continual interest in this work. Provision of the GFIT code
10
by G. Toon (JPL) is gratefully acknowledged. Our work has been performed as part of the ESA GHG-cci project via subcontract with the University of Bremen. In addition we acknowledge funding by the EC within the INGOS project. We thank the ECMWF for providing access to the meteorological data. We thank for support by the Deutsche Forschungsgemeinschaft and Open Access Publishing Fund of the Karlsruhe Institute of Technology. The Wollongong work
15
was funded through the Australian International Science Linkage grant CG130014 and the Australian Research Council, grants DP0879468 and DP110103118.
The service charges for this open access publication have been covered by a Research Centre of the
20
Helmholtz Association.
References
Allan, W., Struthers, H., and Lowe, D. C.: Methane carbon isotope effects caused by atomic
chlorine in the marine boundary layer: global model results compared with Southern Hemi-sphere measurements, J. Geophys. Res., 112, D04306, doi:10.1029/2006JD007369, 2007.
25
AMTD
7, 6743–6790, 2014Multi-station intercomparison of
column-averaged methane
A. Ostler et al.
Title Page
Abstract Introduction
Conclusions References
Tables Figures
◭ ◮
◭ ◮
Back Close
Full Screen / Esc
Printer-friendly Version Interactive Discussion
Discussion
P
a
per
|
Discus
sion
P
a
per
|
Discussion
P
a
per
|
Discussion
P
a
per
|
Belikov, D., Maksyutov, S., Miyasaka, T., Saeki, T., Zhuravlev, R., and Kiryushov, B.: Mass-conserving tracer transport modelling on a reduced latitude-longitude grid with NIES-TM, Geosci. Model Dev., 4, 207–222, doi:10.5194/gmd-4-207-2011, 2011.
Bergamaschi, P., Frankenberg, C., Meirink, J. F., Krol, M., Villani, M. G., Houweling, S., Den-tener, F., Dlugokencky, E. J., Miller, J. B., Gatti, L. V., Engel, A., and Levin, I.: Inverse
model-5
ing of global and regional CH4emissions using SCIAMACHY satellite retrievals, J. Geophys.
Res., 114, D22301, doi:10.1029/2009JD012287, 2009.
Bergamaschi, P., Houweling, S., Segers, A., Krol, M., Frankenberg, C., Scheepmaker, R. A., Dlugokencky, E.,Wofsy, S. C., Kort, E. A., Sweeney, C., Schuck, T., Brenninkmeijer, C., Chen, H., Beck, V., and Gerbig, C.: Atmospheric CH4 in the first decade of the 21st
cen-10
tury: inverse modeling analysis using SCIAMACHY satellite retrievals and NOAA surface measurements, J. Geophys. Res., 118, 7350–7369, doi:10.1002/jgrd.50480, 2013.
Borsdorff, T. and Sussmann, R.: On seasonality of stratomesospheric CO above midlatitudes:
New insight from solar FTIR spectrometry at Zugspitze and Garmisch, Geophys. Res. Lett., 36, L21804, doi:10.1029/2009GL040056, 2009.
15
Bousquet, P., Ciais, P., Miller, J. B., Dlugokencky, E. J., Hauglustaine, D. A., Prigent, C., Van der Werf, G. R., Peylin, P., Brunke, E. G., Carouge, C., Langenfels, R. L., Lathiere, J., Papa, F., Ramonet, M., Schmidt, M., Steele, L. P., Tyler, S. C., and White, J.: Contribution of an-thropogenic and natural sources to atmospheric methane variability, Nature, 443, 439–443, 2006.
20
Bousquet, P., Ringeval, B., Pison, I., Dlugokencky, E. J., Brunke, E.-G., Carouge, C., Cheval-lier, F., Fortems-Cheiney, A., Frankenberg, C., Hauglustaine, D. A., Krummel, P. B., Langen-felds, R. L., Ramonet, M., Schmidt, M., Steele, L. P., Szopa, S., Yver, C., Viovy, N., and Ciais, P.: Source attribution of the changes in atmospheric methane for 2006–2008, Atmos. Chem. Phys., 11, 3689–3700, doi:10.5194/acp-11-3689-2011, 2011.
25
Butz, A., Guerlet, S., Hasekamp, O., Schepers, D., Galli, A., Aben, I., Frankenberg, C., Hart-mann, J. M., Tran, H., Kuze, A., Keppel-Aleks, G., Toon, G., Wunch, D., Wennberg, P., Deutscher, N., Griffith, D., Macatangay, R., Messerschmidt, J., Notholt, J., and Warneke, T.:
Toward accurate CO2and CH4observations from GOSAT, Geophys. Res. Lett., 38, L14812,
doi:10.1029/2011GL047888, 2011.
30
Chevallier, F., Deutscher, N., Conway, C. J., Ciais, P., Ciattaglia, L., Dohe, S., Fröh-lich, M., Gomez-Pelaez, A. J., Griffith, D., Hase, F., Haszpra, L., Krummel, P., Kyrö, E.,