www.atmos-chem-phys.net/6/1293/2006/ © Author(s) 2006. This work is licensed under a Creative Commons License.
Chemistry
and Physics
Inter-comparison of stratospheric O
3
and NO
2
abundances retrieved
from balloon borne direct sun observations and
Envisat/SCIAMACHY limb measurements
A. Butz1,2, H. B¨osch1,*, C. Camy-Peyret2, M. Chipperfield5, M. Dorf1, G. Dufour2,**, K. Grunow6, P. Jeseck2, S. K ¨uhl1, S. Payan2, I. Pepin2, J. Pukite1,7, A. Rozanov3, C. von Savigny3, C. Sioris4, T. Wagner1, F. Weidner1, and K. Pfeilsticker1
1Institut f¨ur Umweltphysik, University of Heidelberg, Heidelberg, Germany
2Lab. de Physique Mol´eculaire pour l’Atmosph`ere et l’Astrophysique (LPMAA), Univ. Pierre et Marie Curie, Paris, France 3Institute of Environmental Physics and Institute of Remote Sensing, University of Bremen, Bremen, Germany
4Harvard-Smithsonian Center for Astrophysics, Cambridge, USA
5Institute for Atmospheric Science, School of Earth and Environment, University of Leeds, Leeds, UK 6Meteorologisches Institut, Freie Universit¨at Berlin, Berlin, Germany
7Institute of Atomic Physics and Spectroscopy, University of Latvia, Riga, Latvia *now at: Jet Propulsion Laboratory, California Institute of Technology, Pasadena, USA **now at: Department of Chemistry, University of Waterloo, Ontario, Canada
Received: 15 August 2005 – Published in Atmos. Chem. Phys. Discuss.: 27 October 2005 Revised: 2 February 2006 – Accepted: 24 February 2006 – Published: 24 April 2006
Abstract. Stratospheric O3 and NO2 abundances mea-sured by different remote sensing instruments are inter-compared: (1) Line-of-sight absorptions and vertical pro-files inferred from solar spectra in the ultra-violet (UV), visible and infrared (IR) wavelength ranges measured by the LPMA/DOAS (Limb Profile Monitor of the Atmo-sphere/Differential Optical Absorption Spectroscopy) bal-loon payload during balbal-loon ascent/descent and solar oc-cultation are examined with respect to internal consistency. (2) The balloon borne stratospheric profiles of O3and NO2 are compared to collocated space-borne skylight limb ob-servations of the Envisat/SCIAMACHY satellite instrument. The trace gas profiles are retrieved from SCIAMACHY spec-tra using different algorithms developed at the Universities of Bremen and Heidelberg and at the Harvard-Smithsonian Center for Astrophysics. A comparison scheme is used that accounts for the spatial and temporal mismatch as well as differing photochemical conditions between the balloon and satellite borne measurements. It is found that the balloon borne measurements internally agree to within ±10% and ±20% for O3and NO2, respectively, whereas the agreement with the satellite is ±20% for both gases in the 20 km to 30 km altitude range and in general worse below 20 km.
Correspondence to:A. Butz ([email protected])
1 Introduction
Stratospheric NOx(=NO+NO2) is responsible for up to 70% of the stratospheric O3loss (Crutzen, 1970; Portmann et al., 1999). NOx reactions dominate the catalytic destruction of O3between 25 and 40 km altitude via
NO+O3−→NO2+O2 (R1)
NO2+h·ν −→NO+O (R2)
NO2+O−→NO+O2. (R3)
Reactions (R1) and (R2), account for more than 90% of NOx chemistry in the lower stratosphere (Del Negro et al., 1999; Cohen et al., 2000). Thus, NO2and O3measurements are of primary importance to study the photochemistry of strato-spheric O3. Recent studies by Dufour et al. (2005) indicate that for selected geophysical conditions the agreement be-tween measured and photochemically modeled O3and NOx is better than 10%. Accordingly, high precision measure-ments are required to constrain or to be compared with pho-tochemical models.
(1957a,b). As far as vertical profiling of trace gases is con-cerned, historically first the solar occultation technique (e.g. Mauldin et al., 1985; Russell III et al., 1988; Camy-Peyret et al., 1993; Sasano et al., 1993) was applied to the UV/visible and IR spectral ranges and only more recently the satellite-borne UV/visible skylight limb technique became available (e.g. Mount et al., 1984; Rusch et al., 1984; Burrows et al., 1995; von Savigny et al., 2003; Sioris et al., 2003; Rozanov et al., 2005b).
The SCanning Imaging Absorption spectroMeter for At-mospheric CHartographY (SCIAMACHY) instrument on-board the European Envisat satellite is a UV/visible/near-IR spectrometer designed to measure direct and scattered sun-light in various viewing directions (Burrows et al., 1995; Bovensmann et al., 1999). An exciting new feature of SCIA-MACHY is to probe the atmosphere in subsequent and spa-tially overlapping nadir and limb scanning observations. This will eventually allow to discriminate between the measured total atmospheric column amounts (nadir) and total strato-spheric columns obtained from integrated stratostrato-spheric pro-files to yield tropospheric column amounts of the targeted gases (Sioris et al., 2004; Sierk et al., 2006).
Here, we present O3 and NO2 stratospheric profiles re-trieved from SCIAMACHY skylight limb observations using first retrieval exercises developed at the Universities of Bre-men (IUP-BreBre-men) and Heidelberg (IUP-Heidelberg) and at the Harvard-Smithsonian Center for Astrophysics (Har-vard). The present study aims at estimating the accuracy of the inferred vertical profiles of stratospheric O3and NO2 by comparison to the corresponding data retrieved from tra-ditional balloon borne solar occultation measurements per-formed by the LPMA/DOAS (Limb Profile Monitor of the Atmosphere/Differential Optical Absorption Spectroscopy) balloon payload (Camy-Peyret, 1995; Ferlemann et al., 1998; Harder et al., 1998; B¨osch et al., 2003). For ENVISAT vali-dation purposes, LPMA/DOAS has been deployed at differ-ent launch locations and in differdiffer-ent seasons during the recdiffer-ent past. It allows us to perform simultaneous measurements of targeted gases in various wavelength ranges covering the UV to the IR.
Therefore in a first exercise, the internal consistency of the LPMA/DOAS observations is checked by comparing slant column amounts of O3 and NO2 (taken from the balloon to the sun) inferred from the visible and IR spectral ranges. Since instrumental setup and retrieval algorithms are inher-ently different for the DOAS and LPMA instrument but the line-of-sight is inherently the same, inferred line-of-sight ab-sorptions are compared and discussed with respect to preci-sion and accuracy of the instruments. Further, the vertical profiles are analyzed regarding altitude resolution and impli-cations for satellite validation. In the second part, the balloon borne profiles of O3and NO2are compared with collocated profiles inferred from SCIAMACHY skylight limb observa-tions. Spatial and temporal coincidences of the balloon and satellite borne measurements are identified using air mass
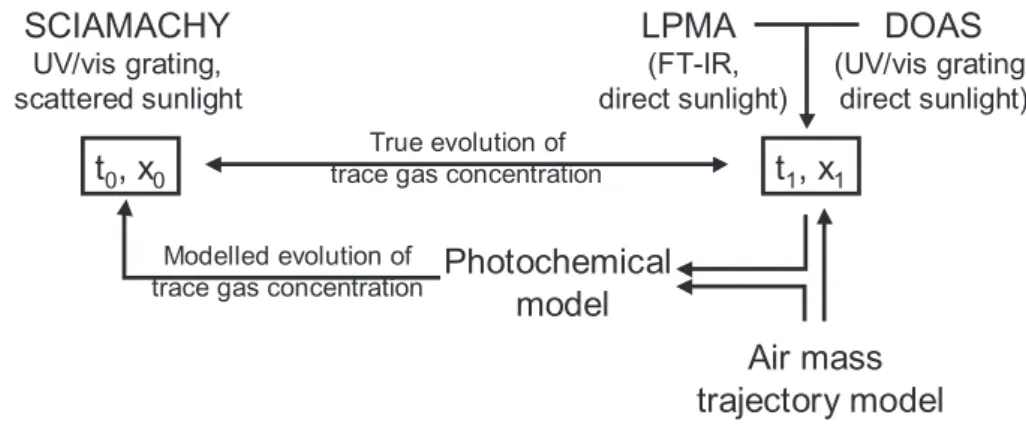
trajectory calculations based on ECMWF analyses. In ad-dition, for the photochemically short-lived NO2radical, the diurnal variation is modelled on the calculated air mass tra-jectory in order to consider the different daylight hour of the satellite and the balloon borne observations. Finally, after ac-counting for the spatial and temporal mismatch as well as the differing photochemical conditions, the balloon and satellite borne measurements are inter-compared and discussed with respect to inherent errors and possible further improvements of the involved algorithms. A schematic drawing which il-lustrates the presented comparison and validation strategy is shown in Fig. 1.
2 Methods
2.1 O3 and NO2profiles inferred from LPMA/DOAS ob-servations
Since details on the instrumental setup and performance of the French/German LPMA/DOAS balloon payload have been reported elsewhere (Camy-Peyret, 1995; Ferlemann et al., 1998), only a short description of the instrumental fea-tures important for the present study is given here. The payload is mounted on an azimuth-controlled gondola and comprises a sun-tracker (Hawat et al., 1998) and three opti-cal spectrometers which analyze direct sunlight over virtu-ally the entire wavelength range from the UV to the mid-IR. Sunlight is collected by the automated sun-tracker (beam diameter 10 cm), which points to the center of the solar disk within 30 arcsec. It directs the inner core (beam di-ameter 5 cm) of the solar beam into a Fourier Transform spectrometer (FT-IR) operated by LPMAA (effective field of view FOV≃0.2◦
) while two small telescopes (diameter 1 cm each, effective field of view FOV≃0.53◦) mounted into the beam’s outer fringe feed the collected sunlight into the two DOAS spectrometers via glass fibre bundles. This op-tical setup guarantees that the UV/visible (DOAS) and IR (LPMA, FT-IR) spectrometers analyze direct sunlight which traversed almost the same atmospheric air masses, (except for the slightly different effective FOV of both spectrome-ters). The measurements are performed during balloon as-cent/descent and in solar occultation geometry with moderate spectral resolution in the UV/visible (UV: FWHM≃0.5 nm, visible: FWHM≃1.5 nm) and high spectral resolution in the IR (apodized resolution≃0.02 cm−1).
In addition to the spectrometers observing direct sunlight a small versatile UV/visible spectrometer has been operated in limb scattering geometry aboard the same balloon gondola since 2002. The instrumental setup, performance and first results are published in Weidner et al. (2005). The inferred O3and NO2abundances show overall good agreement with the data inferred from the direct sun measurements.
SCIAMACHY
UV/vis grating, scattered sunlight
DOAS
(UV/vis grating, direct sunlight)
LPMA
(FT-IR, direct sunlight)
True evolution of trace gas concentration
Air mass
trajectory model
Photochemical
model
Modelled evolution of trace gas concentration
t
1, x
1t
0, x
0Fig. 1. Schematic drawing of the presented comparison and validation strategy. SCIAMACHY observations are conducted at timet0and locationx0. Prior to the balloon flight dedicated to SCIAMACHY validation, the air mass trajectory model is used to optimize the timet1 and locationx1of the LPMA/DOAS balloon borne observations, e.g. by optimizing the launch time of the balloon. After the balloon flight, the trajectory model calculates the air mass history in order to identify satellite measurements which actually sampled the same air masses as the balloon borne instruments. In a Lagrangian approach the illumination history of the coincident air masses is fed into a photochemical model to reproduce the evolution of the considered trace gases between satellite and balloon borne observations as realistically as possible. First the balloon borne LPMA and DOAS measurements are checked for internal consistency, then they are compared to SCIAMACHY data accounting for the photochemical history of the sampled air parcels.
concentrations integrated along the line-of-sight (Slant Col-umn Densities (SCDs)) are inferred from individual solar spectra. Then the SCDs are inverted to vertical profiles of the respective trace gases.
2.1.1 DOAS O3and NO2SCD retrieval
The UV/visible spectra recorded by the two DOAS spec-trometers are analyzed for trace gas absorptions applying the DOAS retrieval algorithm (Platt, 1994; Stutz and Platt, 1996). Each spectrum is evaluated with respect to a solar reference spectrum guaranteeing the removal of solar Fraun-hofer lines. The solar reference spectrum usually is the spec-trum for which the air mass along the line-of-sight and the residual trace gas absorption are minimal. The residual ab-sorption in the solar reference is determined using Langley’s extrapolation to zero air mass.
O3 SCDs are retrieved from the differential structures in the Chappuis absorption band between 545 nm and 615 nm where the temperature and pressure dependence of the O3 absorption cross section taken from Anderson et al. (1992) is negligible (Burkholder et al., 1994; Orphal, 2003). Remain-ing trace gas absorptions are dealt with by simultaneously fit-ting two NO2absorption cross sections recorded at T≃218 K and T≃238 K in the laboratory, wavelength aligned to cross sections from Voigt et al. (2002) and orthogonalized with re-spect to each other. Further, an oxygen dimer (O4) absorption cross section taken from Hermans (2002) and an H2O ab-sorption cross section generated from HITRAN 2000 (Roth-man et al., 2003) by convolution to our spectral resolution are considered. Rayleigh and Mie scattering are accounted for by including a third order polynomial in the fitting proce-dure. In addition we allow for a first order polynomial which
is subtracted from the measured intensity before any alge-braic manipulation to correct for instrumental straylight. In the final evaluation the relative wavelength alignment of the absorption cross sections and the solar reference spectrum is fixed and only the measured spectrum is allowed to shift and stretch.
The line-of-sight absorptions of NO2are inferred from the 435 nm to 485 nm wavelength range. Interfering absorption features come from O4(Hermans, 2002) and O3. Two O3 ab-sorption cross sections recorded in the laboratory at T≃230 K and T≃244 K, aligned to cross sections from Voigt et al. (2001), are orthogonalized and fitted simultaneously. Broad band spectral features are represented by a fourth order poly-nomial. Instrumental straylight correction and wavelength alignment are treated as in the case of the O3analysis. Addi-tional complications arise from the temperature dependence of the NO2 absorption cross section while the pressure de-pendence is negligible at our spectral resolution (Pfeilsticker et al., 1999; Orphal, 2003). The NO2analysis is performed using absorption cross sections recorded in our laboratory scaled and aligned to convolved cross sections from Harder et al. (1997) at T=217 K, T=230 K, T=238 K and T=294 K. The resulting four sets of NO2SCDs are linearly interpolated to the effective NO2concentration weighted temperature along the line-of-sight for each spectrum.
section (2%) and from the convolution to our spectral reso-lution (1%) are taken into account. The statistical error com-prises the 1-σ fitting error, errors coming from systematic residual absorption features and from shift and stretch of the fitted spectrum. The error of the residual absorber amount in the solar reference spectrum is dominated by the estimated accuracy (5%) of the overhead air mass. The errors of the retrieved O3SCDs are governed by the latter error contribu-tion while, for NO2, fitting errors become important when NO2abundances are very low. In total, typical accuracies of the DOAS O3and NO2measurements are better than 5% and 10%, respectively.
Typical optical densities range between 10−1and 10−3for both gases. All DOAS data presented in this study originate from spectra in the visible wavelength range. NO2 SCDs are also retrieved in the 370 nm to 390 nm wavelength range measured by the UV spectrograph. As NO2SCDs inferred from the UV and the visible do not differ significantly, only data inferred from the visible spectrograph are shown ex-hibiting smaller error bars. Evaluating O3in the UV is diffi-cult due to the strong temperature dependence and the strong absorption (optical densities≃1) below 350 nm which ren-ders the DOAS approach questionable (Frankenberg et al., 2005). For further information on the spectral retrieval see Harder et al. (1998, 2000), Ferlemann et al. (1998, 2000), and B¨osch et al. (2003).
2.1.2 LPMA O3and NO2SCD retrieval
The SCD retrieval of O3, NO2, NO, HNO3, N2O, CH4, HCl, CO2and ClONO2 is performed simultaneously using a multi fit of 6 to 11 micro-windows. The possibility to retrieve all species depends on the actual filters and beam-spliters used for the FT-IR measurements. The target micro-windows for O3and NO2are 3040.03 cm−1to 3040.85 cm−1 and 2914.36 cm−1to 2915.16 cm−1, respectively. Typically the O3 absorption lines in the main target window become saturated during deep solar occultation reducing the sensi-tivity of the retrieval to changes in O3 abundances along the line-of-sight. Thus, an additional micro-window be-tween 1818.09 cm−1 and 1820.98 cm−1 with non-saturated O3absorption features is added if available. Interfering ab-sorbers in the O3and NO2 target windows are H2O, CO2, NO, CH4and H2O, O3, CH4, respectively. Additional infor-mation on ozone SCDs comes from weak absorption in the micro-windows dedicated to NO2(2914.36–2915.16 cm−1), and CO2(1933.89–1940.00 cm−1). For NO2, weak absorp-tion in the HCl micro-window (2944.71–2945.11 cm−1) im-proves the SCD retrieval. Based on absorption line parame-ters from HITRAN 2004 (Rothman et al., 2005) and a reason-able a priori guess for the trace gas profiles, a forward model calculates synthetic spectra which are fitted to the measured ones by a non-linear Levenberg-Marquardt algorithm. The calculation of the synthetic spectra relies on atmospheric pa-rameters taken from nearby radiosonde launches and
clima-tological and meteorological model data. Fitting parameters include a polynomial of up to third order, a zero order wave-length shift and several parameters to adjust the instrumental line shape (ILS). All auxiliar ILS parameters are determined separately in various test runs and finally set to a fixed value for all spectra during a balloon flight.
The error bars comprise the statistical error of the fitting routine (1-σ), the uncertainty in determining the instrumen-tal line shape (∼5%), the error coming from the ambient at-mospheric parameters (<1%) and their impact on the spec-troscopic parameters and the stated error bars of the latter (5% to 10% for O3, 2% to 5% for NO2 (Rothman et al., 2005)). In total the systematic contribution to the SCD er-ror is estimated to 10% for both gases. Since the pre-flight alignment and in-flight stability of the LPMA instrument im-proved during the suite of considered balloon flights between 1996 and 2003, the analysis of earlier balloon flights usually yields larger errors than analysis of the more recent ones. Typical errors of the retrieved O3SCDs range between 10% and 15% and are dominated by the accuracies of the spec-troscopic parameters and the estimated accuracy of the in-strumental line shape function. The errors of the NO2SCDs range between 10% and 25%. As in the case of the DOAS error budget, fitting errors become important for NO2when its abundances are very low e.g. for the flight from Kiruna in February 1999, where NO2SCDs are close to the detection limit of the LPMA instrument. For earlier work on LPMA data see Payan et al. (1998, 1999) and Dufour et al. (2005). 2.1.3 LPMA/DOAS O3and NO2profile retrieval
Each spectrum yields an O3and NO2SCD according to the specifications described above. Vertical trace gas profiles are inferred separately from the measurements during bal-loon ascent and solar occultation. We refer to the respective set of SCDs as the measurement vectory. In keeping with the standard notation the true trace gas profile is denotedx
(Rodgers, 2000). The forward model which links the mea-surements and the vertical profile is straight forward to ob-tain by raytracing the path of the incoming light from the sun to the detector. Assuming a spherical, layered atmosphere including refraction, the elementsKij of the weighting func-tion matrixKare given by the ratio of the slant path through layerjand the height of layerjfor the observation geometry of spectrumi. The inversion problem can be stated in linear form
y = Kx +ǫ, (1)
where ǫ represents the measurement error. A variety of methods exists to invert the weighting function matrix K
linear Maximum A Posteriori inversion algorithm described in Rodgers (2000)
ˆ
x = (KTSǫ−1K+Sa−1)−1(KTSǫ−1y+Sa−1xa), (2) where the superscriptT indicates transposed matrices. A pri-ori,Sa, as well as measurement covariance matrices,Sǫ, are
assumed to be diagonal. The a priori profilexais taken from the satellite retrievals described below or from the SLIMCAT chemical transport model (Chipperfield, 1999). Error propa-gation is handled by calculating the corresponding error co-variance matrixSˆ via
ˆ
S =(KTSǫ−1K+ Sa−1)−1. (3)
The square roots of the variancesSˆiirepresent the errors at-tributed to the retrieved trace gas profilexˆ.
The quality of the retrieval can be characterized by the av-eraging kernel matrixAwhich gives the relation between the true trace gas profilexand the retrieved onexˆ
ˆ
x = xa +A(x −xa) +error terms. (4) For the Maximum A Posteriori retrievalAis given through
A = ˆS KTSǫ−1K. (5) The width of averaging kernels given by the rows ofAis a measure for the altitude resolution of the measurement. As altitude resolution depends on the weighting function matrix
Kand measurement errorSǫ the altitude resolution of the retrieved trace gas profiles is different for the three sensors presented in this study. When comparing trace gas profiles the differing altitude resolution can be accounted for by de-grading the altitude resolution of the high resolution profile. First, the profile inversion of the high resolution measure-ment is performed on the same altitude grid as the inversion of the low resolution data set, then the resulting trace gas pro-filexˆhis smoothed by the averaging kernel matrix of the low resolution measurementAl. Accordingly, the smoothed trace
gas profilexˆs is given by ˆ
xs =xa +Al(xˆh − xa), (6)
wherexa is the a priori profile simultaneously used for both retrievals (Connor et al., 1994; Hendrick et al., 2004). When-ever smoothed profiles are shown in this study they are gen-erated according to Eq. (6).
2.2 O3 and NO2 profiles inferred from Envisat/ SCIA-MACHY limb observations
The SCIAMACHY instrument, which was put into a sun-synchronous orbit onboard the European Envisat satellite on 28 February 2002, is a UV/visible/near-IR spectrome-ter (220 nm–2380 nm, FWHM: 0.2 nm–1.5 nm) designed to measure either direct sunlight during solar occultation, di-rect moonlight during lunar occultation or sunlight scat-tered by the Earth’s atmosphere in nadir or limb direction
(e.g. Burrows et al., 1995; Bovensmann et al., 1999). In limb scattering mode SCIAMACHY scans the Earth’s at-mosphere vertically in steps of 3.3 km from the ground to about 100 km tangent height (vertical field of view at tangent point, FOV≃2.8 km, horizontal field of view at tangent point, FOV≃110 km). In addition a horizontal scan is performed at each tangent height covering in total about 960 km at the tan-gent point. Here, results obtained by the LPMA/DOAS bal-loon payload since 2003 are used to validate SCIAMACHY limb observations.
O3and NO2profiles are inferred from SCIAMACHY limb measurements using algorithms developed at the university of Bremen (IUP-Bremen). In the case of NO2, also data re-trieved at the Harvard Smithsonian Center for Astrophysics (Harvard) and a limited data set retrieved by the university of Heidelberg (IUP-Heidelberg) are available. To our knowl-edge no official ESA products are on hand to be compared with the presented data.
2.2.1 IUP-Bremen O3retrieval
The stratospheric ozone profiles are derived from SCIA-MACHY limb scattering observations with the Stratozone code (version 1.62) using the method described in von Savi-gny et al. (2005c). The altitude range from about 15–40 km can be covered with this technique with a vertical resolution of about 4 km. The retrieval technique exploits the absorp-tion in the Chappuis bands of ozone using only three dis-crete wavelengths as described in Flittner et al. (2000). A non-linear optimal estimation (OE) scheme drives the radia-tive transfer model SCIARAYS (Kaiser and Burrows, 2003), which is run online to calculate weighting functions and to forward-model the limb radiance profiles. The main error sources are incorrect knowledge of the stratospheric aerosol loading, surface albedo, cloud cover, as well as tangent height errors (von Savigny et al., 2005b). The estimated total error between 15 and 35 km is about 8–14%. The SCIA-MACHY limb observations are affected by errors in the tan-gent height information of up to 2.5 km (von Savigny et al., 2005a), particularly before the improvement of the or-bit propagator model on-board the Envisat spacecraft in De-cember 2003. Note that tangent height errors of only 500 m lead to errors in the ozone concentrations of up to 10%. For the stratospheric ozone profile retrievals presented here a tan-gent height offset for each orbit was derived from the limb measurements in the UV-B spectral range prior to the ozone profile retrieval, using the method described in Kaiser et al. (2004). The precision of the tangent height retrieval method is about 200–300 m.
2.2.2 IUP-Bremen NO2retrieval
transfer model (Rozanov et al., 2005a,b), assuming cloud free conditions. In spherical mode the SCIATRAN model calculates the limb radiance properly considering the single scattered radiance and using an approximation to account for multiple scattering. Vertical distributions of NO2 are retrieved from SCIAMACHY limb measurements using the spectral information in the 420–470 nm wavelength interval. To improve the retrieval quality the vertical profiles of O3 are estimated in combination with NO2 retrievals using the same spectral information. Limb measurements performed at tangent heights from 12 to 40 km are considered. To re-duce the impact of the Fraunhofer structure and incorrect in-strument calibration all selected limb scans are divided by the reference limb measurement obtained at a tangent height of about 43 km. To account for broadband features result-ing from unknown scatterresult-ing properties of the atmosphere as well as instrument calibration issues, a cubic polynomial is subtracted from all spectral ratios. The temperature depen-dent absorption cross sections of O3and NO2measured by the SCIAMACHY PFM Satellite Spectrometer are used in the forward model (Bogumil et al., 1999). Pressure and tem-perature profiles are taken from the corresponding ECMWF data. The SCIAMACHY pointing errors are accounted for by applying appropriate tangent height corrections obtained using the TRUE retrievals (Kaiser et al., 2004). The retrieval is performed as described in Rozanov et al. (2005b) using a two-step retrieval procedure. During the preprocessing step which is done for each tangent height independently a pos-sible misalignment of the wavelength grids of the limb spec-tra, of the reference spectrum and of the forward model is ac-counted for. Additionally, known corrections, namely, under-sampling, Ring spectrum, stray light correction and instru-ment calibration functions, are applied. The main retrieval step is based on the solution of Eq. (1) employing the op-timal estimation technique. Different from the description given in Sect. 2.1.3, the measurement vectorycontains the differences between ratios of simulated and measured dif-ferential limb spectra at all tangent heights selected for the retrieval with all corrections from the preprocessing step ap-plied. The state vectorxcontains relative differences of trace gas number densities (with respect to a priori values) at all altitude layers for all gases to be retrieved. The final solu-tion is found employing the informasolu-tion operator approach (Hoogen et al., 1999; Rozanov, 2001) which ensures an ad-ditional noise filtering, resulting in more stable profiles. 2.2.3 Harvard NO2retrieval
The Harvard-SAO algorithm is described in Sioris et al. (2004) and references therein. Cloud top height is retrieved from channel 6 and is used to define the lower limit of the retrieval. Tangent height (TH) registration is determined by the multi-wavelength∼305 nm knee method (Sioris et al., 2003). The calculated orbital median TH offset is applied to all limb scans if greater than the orbital standard
devi-ation of the TH offsets. The NO2 fitting window consists of 256 pixels in the 434–495 nm range and the simulations are performed at SCIAMACHY channel 3 spectral resolution (0.5 nm), leading to 114 wavelengths in the same fitting win-dow. The analysis uses a classic two-step approach: spec-tral fitting followed by inversion of SCDs to a number den-sity profile. The reference spectrum is the co-addition of all spectra between the retrieval upper altitude limit (∼40 km) and 70 km. Absorption cross sections included in the fitting process are NO2and O3from Bogumil et al. (2003), and the collisional oxygen dimer (O4) from Greenblatt et al. (1990). The temperature dependence of the NO2and O3absorption cross section is handled by performing three runs with ab-sorption cross sections corresponding to T=203 K, T=223 K, T=243 K (Bogumil et al., 2003). At each tangent height the run which exhibits the smallest errors is chosen for profile re-trieval. The inversion of the SCDs to number densitiy profiles is direct, thus a priori is not required in the retrieval range. 2.2.4 IUP-Heidelberg NO2retrieval
approximately 15 km to 40 km where averaging kernels are larger than 0.7. The accuracy in this altitude range is approx-imately 15–25%. Tangent height corrections are performed according to the monthly averaged SCIAMACHY pointing errors given in von Savigny et al. (2005a).
2.3 Air mass trajectory modelling
Balloon borne measurements exhibit several inherent con-straints with respect to the time and location of the balloon launch. Balloon launches are possible at a few sites around the world, only. The launching possibility depends on the local surface weather conditions and the balloon’s trajec-tory is determined by the tropospheric and stratospheric wind fields. Furthermore, the LPMA/DOAS payload is supposed to be launched temporally close to local sunset or sunrise as LPMA/DOAS performs measurements during solar oc-cultation. In practise, these constraints make it difficult to get a direct temporal and spatial coincidence with individual satellite measurements such as SCIAMACHY limb observa-tions. In part, the use of air mass trajectory models can help to overcome the shortcomings in balloon borne satellite val-idation (Bacmeister et al., 1999; Lu et al., 2000; Danilin et al., 2002a,b).
For that purpose, an air mass trajectory model is applied within the framework of Envisat/SCIAMACHY validation (Langematz et al., 1987; Reimer and Kaupp, 1997). It uses the operational ECMWF analyses and forecasts given ev-ery 6 h on a 2.5◦×2.5◦latitude/longitude grid. Forward and backward trajectories are calculated on isentropic levels from the surface up to 1600 K with interpolation between the lev-els. The internal time step is 10 minutes and the diabatic and climatological heating rates are based on Newtonian cooling. The results (trajectory points) are stored for each hour.
Backward and forward trajectories start at the balloon measurement locations. For the remote-sensing payload LPMA/DOAS these starting points are the balloon location and the tangent points for balloon ascent and solar occulta-tion, respectively. For post-flight analysis air mass trajecto-ries are calculated for up to 10 days forward and backward in time, but for balloon flight planning purposes the time range is limited by the available ECMWF forecasts: the latest anal-ysis is from 12:00 UT the day before, forecasts are available every 6 h up to 72 h into the future.
The actual geolocations of Envisat/SCIAMACHY obser-vations are provided by the SCIAMACHY Operational Sup-port Team (SOST) through its website (http://atmos.af.op. dlr.de/projects/scops/). For each Envisat orbit, overpass time, geolocation and detailed measurement specifications (e.g. swath, measurement duration, ground pixel size) can be downloaded. For the air mass trajectory based match-ing technique only the area covered by the tangent points of SCIAMACHY limb is considered. This information is used to find satellite measurement points along the individ-ual air mass trajectories, for which the spatial and
tempo-ral mismatch is as small as possible. The match criteria are chosen based on the experience of the ozone Match exper-iment (von der Gathen et al., 1995). The maximum time mismatch between the satellite observation and the air mass trajectory started at the balloon observation is one hour and the maximum area mismatch is 500 km with respect to the center of the SCIAMACHY limb ground pixel. In case, no Envisat/SCIAMACHY observation satisfies these limits, the distance criterion is weakened to a maximum spatial mis-match of 1000 km.
2.4 Photochemical modelling
On timescales important for this study, i.e. the time be-tween satellite and correlative balloon borne measurement (<1 day), the photochemical variation of O3is found negli-gible. Hence, we focus our modelling on the photochemical variation of NO2. For the impact of the photochemistry of NO2on solar occultation measurements and validation stud-ies see also Kerr et al. (1977), Roscoe and Pyle (1987) and Bracher et al. (2005). We use output from a simulation of the SLIMCAT 3-D off-line chemical transport model (CTM) (Chipperfield, 1999) to initialize a 1-D chemistry model of the stratosphere. SLIMCAT output of run 323 is saved at 00:00 UT every 2 days interpolated to the launching sites of the balloon flights. Both photochemical models include a comprehensive set of the relevant gas-phase and heteroge-nous reactions as given by the JPL-2002 report on Chemical Kinetics and Photochemical Data (Sander et al., 2003). The 1-D chemistry model is an updated version of the model used in B¨osch et al. (2003). Stratospheric chemistry is modelled on 19 potential temperature (2) levels between 2=336 K (≃11 km) and2=1520 K (≃42 km). Aerosol loadings are taken from Deshler et al. (2003) as recommended by Dufour et al. (2005). Photolysis rates are interpolated with respect to pressure, temperature, overhead ozone and solar zenith angle (SZA) from a lookup table where the actinic fluxes are calcu-lated as recommended by Lary and Pyle (1991) and validated for JNO2 by B¨osch et al. (2001).
Fig. 2. Slant Column Densities of O3(panelsaandb) and NO2(panelscandd) retrieved from LPMA (red triangles) and DOAS (black boxes) direct solar spectra measured at Kiruna on 23 March 2003, during balloon ascent (panels a and c) and sunset (panels b and d). Each panel consists of two sub-panels showing the measured SCDs on the left and the corresponding relative errors and deviations (blue open stars), i.e. SCD(DOAS) / SCD(LPMA) - 1, on the right. For clarity not all DOAS data points are shown.
are scaled at initialization in a way that the model can repro-duce the balloon borne O3and NO2profiles in the evening (Bracher et al., 2005).
In general, each spectrum measured by SCIAMACHY as well as by the balloon borne instruments is a composite of several photochemical conditions since the SZA varies along the line-of-sight through the atmosphere. All satellite mea-surements presented here are conducted in the morning far from sunset or sunrise where the photochemical variation of NO2is weak. Hence, we assume a fixed SZA for the SCIA-MACHY observations. However, the time-lag to the valida-tion measurements is on the order of several hours and bal-loon borne profiles are inferred from measurements close to sunset when the photochemical variation of NO2is strongest. Introducing the photochemical weighting factorsκkj, balloon observations are scaled to the photochemical conditions of the satellite measurements. Given the model data along the SZA timeline of a given air mass trajectory,κkj is defined by
κkj =
akj
bj
, (7)
where bj is the modelled NO2 concentration at altitude j and the SZA of the SCIAMACHY measurement andakj the modelled NO2concentration at altitudejand SZAk. When tracing the light through the atmosphere from the sun to the balloon borne detector, each point on the line-of-sight can be identified through its altitude and its local SZA. Assuming a layered atmosphere the slant path through layerj at local SZAkis multiplied byκkj. Hence, we obtain a photochemi-cally corrected weighting function matrixK˜. ReplacingKby
˜
variation of NO2. These parameters include the O3 pro-file (−33%, +50%), overhead ozone (±74%), the temper-ature for each 2-level (±7 K), the rate constants of Re-actions (R1) and (R2) (±20%), the aerosol surface area (±40%) and the γ-coefficient for N2O5 uptake on liquid aerosol (−50%,+100%). For each run two photochemically scaled trace gas profiles are generated corresponding to a backward and a forward satellite match in the morning be-fore and after the balloon flight, respectively. The root mean square deviation of the vertical profiles from the standard run yields the estimate of the modelling error. The modelling er-ror increases from less than 10% at balloon float altitude to 20% at 20 km altitude. Between 20 km and balloon float alti-tude the error is governed by the factors which influence the photolysis of NO2via Eq. (R2). The modelling error for the backward match grows to 30% at 15 km and up to 50% be-low 15 km, mainly due to the sensitivity of NOxchemistry to the O3profile through Eq. (R1). The modelling error of the forward match calculations remains constant at 20% down to 15 km. Below 15 km it rises up to 35% caused by sensitivity to the O3profile. Whenever photochemically corrected trace gas profiles are shown the modelling error is added applying Gaussian error propagation.
3 Internal LPMA/DOAS comparison
3.1 Comparison of LPMA/DOAS O3and NO2Slant Col-umn Densities
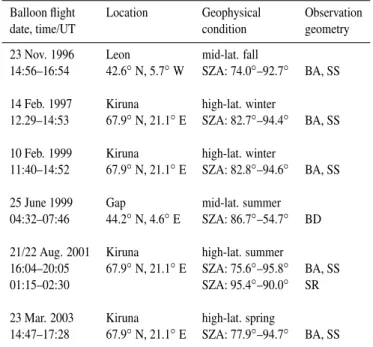
Table 1 summarizes the geophysical conditions of the bal-loon flights chosen for the comparison of the LPMA/DOAS O3 and NO2 SCDs. We present data of six joint LPMA/DOAS balloon flights where the corresponding geo-physical conditions range from high-latitude winter and sum-mer to mid-latitude fall comprising measurements inside as well as outside the northern polar vortex. Due to bad data quality or instrumental malfunction and the considerable ef-fort necessary for data re-analysis we restrict the comparison study to six out of the 13 flights conducted to date.
The quality of the LPMA/DOAS comparison is illustrated in Fig. 2 showing O3 and NO2 SCDs as well as the corre-sponding errors and relative deviations inferred from obser-vations at Kiruna on 23 March 2003. The particular flight is chosen as an example since all data sets are available allow-ing for a consistent comparison. In addition, relative devia-tions between LPMA and DOAS SCDs are presented as his-tograms in Figs. 3 and 4 for the six considered balloon flights. Relative deviations are calculated by linear interpolation of the DOAS data to the measurement instances of LPMA.
The general agreement of LPMA and DOAS O3SCDs is on the order of 10%. Maximum deviations of up to 30% are observed when slant columns are very low and governed by the O3 abundances above balloon float altitude indicat-ing a problem when applyindicat-ing Langley’s method to retrieve
Table 1. Compendium of joint LPMA and DOAS balloon flights chosen for comparison. BA, BD, SS and SR indicate balloon ascent, balloon descent, sunset and sunrise, respectively.
Balloon flight Location Geophysical Observation
date, time/UT condition geometry
23 Nov. 1996 Leon mid-lat. fall
14:56–16:54 42.6◦N, 5.7◦W SZA: 74.0◦–92.7◦ BA, SS
14 Feb. 1997 Kiruna high-lat. winter
12.29–14:53 67.9◦N, 21.1◦E SZA: 82.7◦–94.4◦ BA, SS
10 Feb. 1999 Kiruna high-lat. winter
11:40–14:52 67.9◦N, 21.1◦E SZA: 82.8◦–94.6◦ BA, SS
25 June 1999 Gap mid-lat. summer 04:32–07:46 44.2◦N, 4.6◦E SZA: 86.7◦–54.7◦ BD
21/22 Aug. 2001 Kiruna high-lat. summer
16:04–20:05 67.9◦N, 21.1◦E SZA: 75.6◦–95.8◦ BA, SS 01:15–02:30 SZA: 95.4◦–90.0◦ SR
23 Mar. 2003 Kiruna high-lat. spring
14:47–17:28 67.9◦N, 21.1◦E SZA: 77.9◦–94.7◦ BA, SS
the residual absorber amount in the DOAS solar reference spectrum. For some of the earlier balloon flights the rel-ative deviations for solar occultation measurements are as large as 20%. During solar occultation the measured O3 IR-absorption lines in the LPMA standard retrieval window be-come saturated. In order to increase retrieval sensitivity we include a micro-window exhibiting weak, unsaturated O3 ab-sorption. Unfortunately the latter micro-window is not avail-able for some of the flights due to usage of spectral filters which cut the respective spectral region. The statistical anal-ysis of all 1032 data points yields that in average DOAS O3 SCDs are larger by 6.1% than the LPMA data. The stan-dard deviation of the relative deviation between LPMA and DOAS amounts to 8.0%, see Fig. 3.
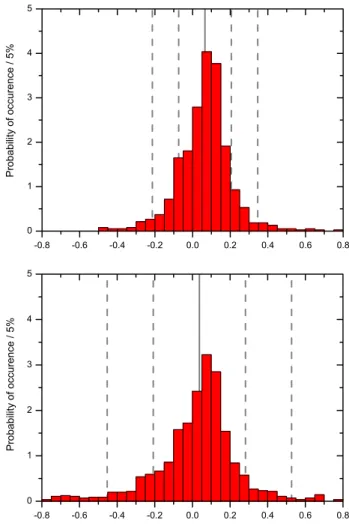
Fig. 3. Histogram of the relative deviations between O3SCDs re-trieved by DOAS and LPMA, i.e. SCD(DOAS) / SCD(LPMA) - 1. The 1032 data points corresponding to the 6 flights of Table 1 are grouped and counted for occurrence in bins of 5% relative devia-tion. The mean and the corresponding standard deviation are 6.1% and 8.0%, respectively. The mean value is shown as grey solid line, grey dashed lines correspond to one and two times standard devia-tion from the mean.
occurs for the flight from Kiruna in 1999 where NO2 abun-dances are very low. In this case, stratospheric temperatures were well below 217 K and an extrapolation of the Harder et al. (1997) data has to be used when accounting for the tem-perature dependence of the NO2 absorption cross sections. However, an extrapolation error alone cannot account for the observed discrepancy which has been tested using the NO2 cross section from Bogumil et al. (2003) at 203 K. The statis-tical analysis of all 1016 data points reveals a mean deviation of +3.7% between DOAS and LPMA with a large standard deviation of 24.5%, see Fig. 4 lower panel. As some of the LPMA data are noisy or close to the detection limit we per-formed another statistical analysis excluding all data where the corresponding SCDs show errors larger than 25%. The resulting set of 753 data points exhibits a mean relative devi-ation between DOAS and LPMA of +6.6% and 14.0% stan-dard deviation, see Fig. 4 upper panel. Overall the combined error bars are a reasonable estimate for the LPMA/DOAS agreement on NO2measurements.
3.2 Comparison of LPMA/DOAS O3and NO2profiles Section 3.1 discussed the level of agreement between the O3 and NO2 SCDs inferred from LPMA and DOAS measure-ments. In this section O3 and NO2 data again taken from balloon ascent and sunset of the flight at Kiruna on March 23, 2003, are chosen to illustrate the characteristics of the profile inversion technique. SCDs are inverted to vertical trace gas profiles via Eq. (2). The profile retrieval is charac-terized by the corresponding averaging kernel matrices given
Fig. 4.Histogram of the relative deviations between NO2SCDs re-trieved by DOAS and LPMA, i.e. SCD(DOAS) / SCD(LPMA) - 1. Lower panel: All 1016 data points corresponding to the 6 flights of Table 1 are grouped and counted for occurrence in bins of 5% relative deviation. The mean and the corresponding standard de-viation are 3.7% and 24.5%, respectively. Upper panel: All data where the corresponding SCDs exhibit relative errors larger than 25% are removed. The remaining 753 data are grouped and counted for occurrence in bins of 5% relative deviation. The mean and the corresponding standard deviation are 6.6% and 14.0%, respectively. Common: The mean value is shown as grey solid line, grey dashed lines correspond to one and two times standard deviation from the mean.
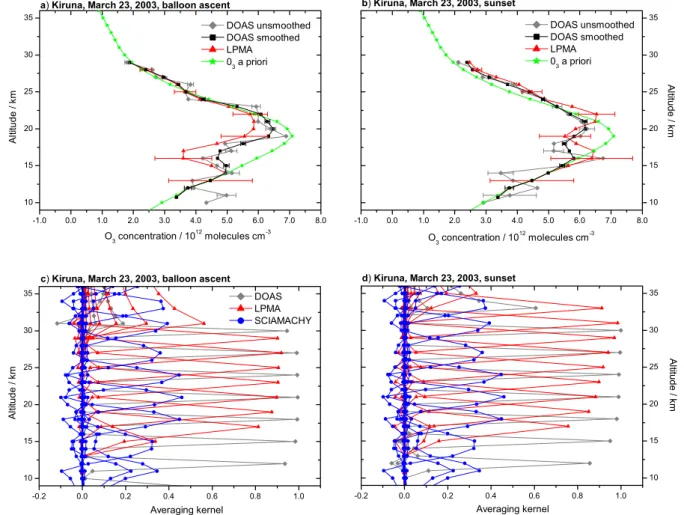
Fig. 5.1.Vertical O3profiles (panelaandb) and corresponding averaging kernels (panelcandd) retrieved from balloon ascent (panel a and c) and sunset (panel b and d) for the flight from Kiruna on 23 March 2003. LPMA data (red triangles) are retrieved on a 2 km, DOAS data (grey diamonds) on a 1 km altitude grid. In addition smoothed DOAS data are shown (black boxes). The green stars represent the O3a priori profile. The averaging kernels of the SCIAMACHY O3retrieval are plotted (blue circles) for comparison.
the coarser altitude resolution of LPMA. The corresponding averaging kernels are shown in the lower panels of Fig. 5.1 and 5.2. For comparison, the averaging kernels of the SCIA-MACHY limb retrievals (IUP-Bremen) are also plotted.
The retrieved O3profiles, Figs. 5.1 and 5.2, reproduce the general behavior of the underlying SCDs shown in Fig. 2. LPMA data underestimate the DOAS data during balloon as-cent below 22 km. Above, the agreement is good. During sunset O3concentrations retrieved from LPMA spectra tend to be higher than those retrieved from DOAS spectra and the shapes of the considered profiles are somewhat different. The general agreement is on the order of the combined error bars as already indicated by the underlying SCDs.
The averaging kernels of the DOAS O3 profile retrieval, Fig. 5.1c and d, are well shaped in the altitude range be-tween 10 km and 30 km for both, the balloon ascent and sun-set measurements. Hence, profile retrieval is possible with 1 km to 2 km altitude resolution in the respective altitude range. The LPMA averaging kernels are reasonably well
Fig. 5.2.Vertical NO2profiles (panelaandb) and corresponding averaging kernels (panelcandd) retrieved from balloon ascent (panel a and c) and sunset (panel b and d) for the flight from Kiruna on 23 March 2003. LPMA data (red triangles) are retrieved on a 2 km, DOAS data (grey diamonds) on a 1 km altitude grid. In addition smoothed DOAS data are shown (black boxes). The green stars represent the O3a priori profile. The averaging kernels of the SCIAMACHY NO2retrieval are plotted (blue circles) for comparison.
The comparison of NO2 vertical profiles for balloon as-cent, Fig. 5.2a, reveals an underestimation of the DOAS by the LPMA data over the entire retrieved altitude range. In the lower stratosphere the discrepancy is substantial and larger than the error bars. For sunset, Fig. 5.2b, LPMA overes-timates the DOAS data between 31 km and 25 km. Below 25 km LPMA and DOAS agree well.
The averaging kernels indicate that it is possible to retrieve NO2 vertical profiles in the range between 12 km and bal-loon float altitude at about 30 km from DOAS measurements during balloon ascent and sunset exhibiting 5 km to 1 km al-titude resolution. However, the NO2 averaging kernels are less well shaped than those of the O3retrieval since the un-derlying NO2 SCDs have larger errors. Hence, in contrast to the O3retrieval, there is a significant decrease in altitude resolution below 20 km. LPMA measurements during bal-loon ascent and solar occultation allow for profile retrieval between 17 km and 30 km altitude with 5 km to 2 km altitude resolution. Due to the larger errors of the NO2 SCDs,
al-titude resolution for the NO2profile retrieval is worse than for the O3retrieval. Comparing the averaging kernels of the LPMA and DOAS data sets it becomes evident that smooth-ing is most significant below 20 km altitude where LPMA measurements yield only little or no information on the NO2 vertical profile. The secondary (and real) maximum at about 15 km altitude seen in the DOAS unsmoothed data is not present in the LPMA retrieval. Hence, according to Eq. (6) the smoothed DOAS profile is drawn toward the a priori.
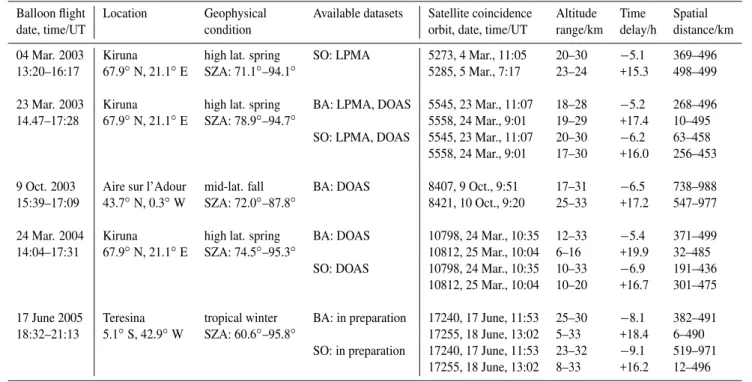
Table 2. Compendium of joint LPMA and DOAS O3and NO2profile measurements and Envisat/SCIAMACHY overpasses. BA and SO indicate balloon ascent and solar occultation measurements, respectively.
Balloon flight Location Geophysical Available datasets Satellite coincidence Altitude Time Spatial
date, time/UT condition orbit, date, time/UT range/km delay/h distance/km
04 Mar. 2003 Kiruna high lat. spring SO: LPMA 5273, 4 Mar., 11:05 20–30 −5.1 369–496 13:20–16:17 67.9◦N, 21.1◦E SZA: 71.1◦–94.1◦ 5285, 5 Mar., 7:17 23–24 +15.3 498–499
23 Mar. 2003 Kiruna high lat. spring BA: LPMA, DOAS 5545, 23 Mar., 11:07 18–28 −5.2 268–496 14.47–17:28 67.9◦N, 21.1◦E SZA: 78.9◦–94.7◦ 5558, 24 Mar., 9:01 19–29 +17.4 10–495
SO: LPMA, DOAS 5545, 23 Mar., 11:07 20–30 −6.2 63–458 5558, 24 Mar., 9:01 17–30 +16.0 256–453
9 Oct. 2003 Aire sur l’Adour mid-lat. fall BA: DOAS 8407, 9 Oct., 9:51 17–31 −6.5 738–988 15:39–17:09 43.7◦N, 0.3◦W SZA: 72.0◦–87.8◦ 8421, 10 Oct., 9:20 25–33 +17.2 547–977
24 Mar. 2004 Kiruna high lat. spring BA: DOAS 10798, 24 Mar., 10:35 12–33 −5.4 371–499 14:04–17:31 67.9◦N, 21.1◦E SZA: 74.5◦–95.3◦ 10812, 25 Mar., 10:04 6–16 +19.9 32–485
SO: DOAS 10798, 24 Mar., 10:35 10–33 −6.9 191–436 10812, 25 Mar., 10:04 10–20 +16.7 301–475
17 June 2005 Teresina tropical winter BA: in preparation 17240, 17 June, 11:53 25–30 −8.1 382–491 18:32–21:13 5.1◦S, 42.9◦W SZA: 60.6◦–95.8◦ 17255, 18 June, 13:02 5–33 +18.4 6–490
SO: in preparation 17240, 17 June, 11:53 23–32 −9.1 519–971 17255, 18 June, 13:02 8–33 +16.2 12–496
3.3 Conclusions on the LPMA/DOAS comparison and im-plications for satellite validation
As presented in Sects. 3.1 and 3.2, O3and NO2abundances inferred from LPMA/DOAS measurements in the IR and vis-ible spectral ranges agree roughly within±10% for O3and ±20% for NO2. Observed discrepancies can be due to in-strumental and retrieval related shortcomings of either tech-nique. The LPMA Fourier Transform spectrometer inher-ently exhibits smaller signal-to-noise-ratio (SNR≃102) than the grating spectrometers operated by DOAS (SNR≃104) causing significantly smaller detection limit and higher pre-cision of the DOAS measurements. In the visible spectral range where the Sun’s intensity peaks the typical integra-tion time for individual spectra is less than 1 s, whereas in the IR it takes about 50 s to record a single interferogram. Hence, the DOAS instruments sample the atmosphere with a much higher rate than the LPMA FT-IR. Taking into ac-count the respective errors of the considered trace gases it is evident that altitude resolution is significantly better for the DOAS observations. When the apparent size of the so-lar disk becomes so-large during soso-lar occultation the smaller field of view of the FT-IR (FOV≃0.2◦
) partly compensates the high integration times and large errors compared to the DOAS measurements (FOV≃0.53◦). On the other hand the small field of view of the FT-IR renders the intensity of the measured interferograms very sensitive to small pointing
4 Validation of SCIAMACHY O3and NO2profiles
4.1 Observations
The validation study reports on four LPMA/DOAS balloon flights, three from ESRANGE, Kiruna, Sweden, and one from Aire sur l’Adour in southern France conducted since 2003. The analysis of a fifth balloon flight at Teresina, Brazil, in June 2005 is currently in preparation. For each balloon flight a satellite coincident measurement is identified in the morning before and after the balloon flight using the trajec-tory matching technique described in Sect. 2.3. In the fol-lowing we refer to these coincidences as backward and for-ward coincidences. If trace gas profiles inferred from balloon ascent and solar occultation are available the satellite coin-cidences are identified separately. For each balloon flight Table 2 provides information on the measurement site, the geophysical condition, the SZA range covered by the bal-loon borne observations, the available data sets and some details on the selected SCIAMACHY limb scans. Besides orbit number, time and date of the satellite measurement, the matching altitude range, the distance with respect to the air masses probed by the balloon borne instruments and the time delay between satellite overpass and balloon flight are given. In general we succeed in identifying satellite coincidences in the altitude range from about 20 km to 30 km. In some cases the characteristics of the satellite coincidences are not perfect for validation purposes, e.g. for the flight from Kiruna in 2004 where the coincident altitude range is be-low 20 km and for the flight from Kiruna on 4 March 2003, where the forward coincidence is restricted to a small alti-tude range. Nevertheless, remembering that coincidence cri-teria are somewhat arbitrary the balloon and satellite borne trace gas profiles are compared in the whole retrieved alti-tude range. For the flight from Aire sur l’Adour on 9 October 2003, the match criterion is weakened to a maximum spa-tial mismatch of 1000 km, as no coincidence is found apply-ing the 500 km criterion. Furthermore assumapply-ing the weak-ened match criterion, the satellite overpass in the morning of 9 October coincides directly with the balloon measure-ment locations. Hence, the backward model calculations for this flight are not performed along the SZA timeline given by air mass trajectory calculations, but are carried out along the SZA timeline corresponding to air masses stationary at Aire sur l’Adour.
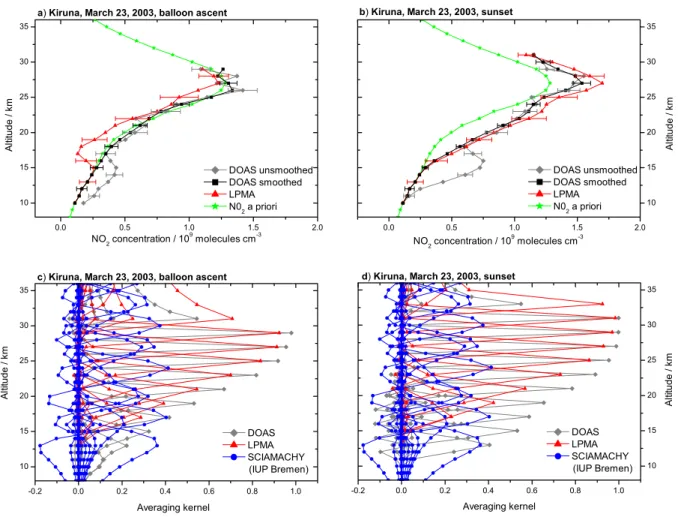
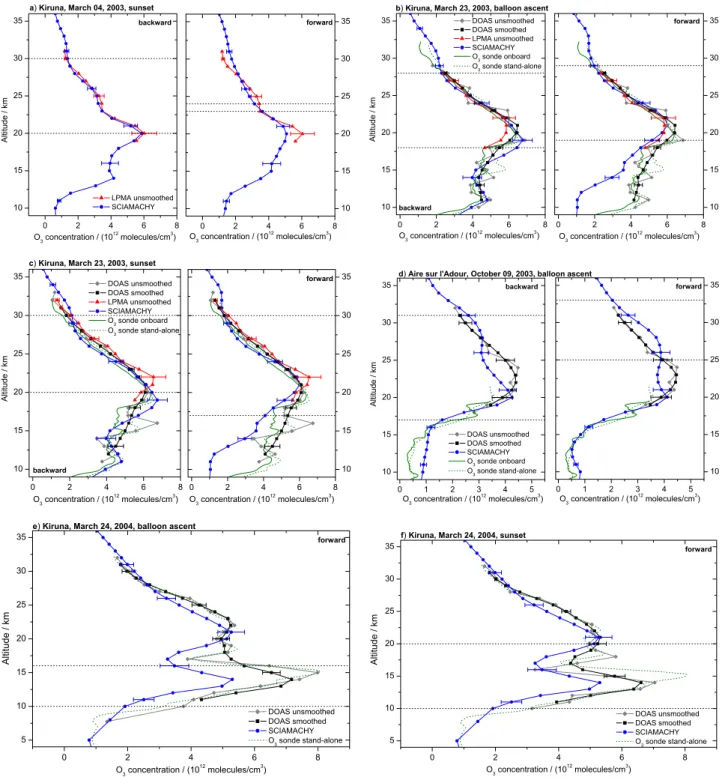
The retrieved vertical trace gas profiles for O3and NO2are shown in Figs. 6 and 7, respectively. Satellite observations in the morning before and after the balloon flight are compared to balloon borne trace gas profiles. We present smoothed and in the case of NO2 also photochemically corrected balloon borne profiles. For reference vertical profiles without pho-tochemical correction at full altitude resolution are plotted. In the case of O3, in-situ sonde data are included if avail-able. The O3sonde data are taken from an electrochemical cell either deployed onboard the gondola or launched from
the ground station shortly after balloon launch. The relative deviations between the satellite and balloon borne measure-ments are assessed in Figs. 8 and 9 for O3and NO2, respec-tively.
LPMA data are available for the two flights at Kiruna in 2003, only. DOAS data are lacking for 4 March 2003, due to instrumental malfunction. According to the findings of Sect. 3.2, DOAS O3 and NO2 profiles are retrieved on the same altitude grid as the satellite profiles. As the altitude res-olution of the DOAS retrieval is significantly better, DOAS profiles are smoothed to match the satellite’s coarser altitude resolution except for NO2 at balloon ascent below 20 km where no smoothing is applied. LPMA trace gas profiles are generated on a 2-km altitude grid applying no smooth-ing as the satellite’s altitude resolution does not differ signif-icantly. Satellite borne O3profiles are inferred using the IUP-Bremen retrieval algorithm. SCIAMACHY NO2profiles are generated by the IUP-Bremen and Harvard retrieval. In two cases also NO2profiles inferred by the IUP-Heidelberg are available. Relative deviations between balloon and satellite borne observations are calculated for the trace gas profiles retrieved at the IUP-Bremen and the balloon borne DOAS measurements, except for the observations at Kiruna on 4 March 2003, where LPMA data are used in the absence of available DOAS measurements.
4.2 Discussion
4.2.1 O3validation study
The internal consistency of the validation data set has been discussed in Sect. 3.1 where a bias of +6.1% between DOAS and LPMA O3measurements is detected. The corresponding standard deviation of the deviations between the two datasets is 8.0%. Accordingly, the inferred vertical profiles mostly agree to within the combined error bars of both data sets. In all cases the agreement between in-situ sonde and remote sensing balloon borne O3 data is good. Sometimes even highly filamented structures, e.g. Fig. 6e, can be observed simultaneously in the high resolution balloon borne and the in-situ observations.
Fig. 6.Comparison of O3profiles inferred from SCIAMACHY limb observations with correlative balloon borne measurements. Panels (a) to (f) correspond to observations at(a)Kiruna on 4 March 2003, at Kiruna on 23 March 2003, during(b)balloon ascent and(c)sunset, at(d)
Fig. 8.Relative deviations between satellite and balloon borne mea-surements of O3profiles. Filled and open symbols correspond to backward and forward coincidences, respectively. Observation sites and conditions are indicated in the legend. The mean deviation of all coincident data in the 20 km–31 km altitude range is 4.3% with 10.8% standard deviation. The grey lines indicate the mean at +0.043 and the one and two times standard deviation boundaries with respect to the 20 km–31 km altitude range. The grey error bars indicate the mean combined errors of the satellite and balloon borne observations. Note the broken abscissa.
where a zigzag shape of the deviations between a validation data set (lidar, SAGE II) and the IUP-Bremen O3retrieval is observed, indicating that O3concentrations at 27 km inferred from SCIAMACHY limb are too low. Albeit different cor-rections for tangent height errors are already included in the SCIAMACHY retrievals there might be a remaining small tangent height error causing the observed deviations. The combined error bars of the balloon and satellite borne obser-vations are on the order of the observed standard deviation of all coincident measurements in the 20 to 30 km altitude range. However, a number of data points differ by more than the combined error bars which might point to a systematic error as suggested above.
Below 20 km SCIAMACHY O3profiles underestimate the balloon borne data in most cases and cannot reproduce the frequently highly filamented O3profiles observed especially at high latitudes during winter, e.g. Fig. 6e and f. The balloon flights from Kiruna on 23 March 2003, and on 24 March 2004, have been conducted close to the polar vortex edge where the gradients in O3 concentration are large on small spatial scales. When identifying coincident balloon and satellite measurements, the air mass trajectory calcula-tions allow for a sizeable mismatch in space and time. Spa-tial mismatch of up to 500 km is possible and, hence, the influence of horizontally inhomogeneous air masses can be important close to the polar vortex edge. Further, SCIA-MACHY measurements represent an average over a 960 km wide horizontal area, whereas the LPMA/DOAS
measure-Fig. 9.Relative deviations between satellite (IUP-Bremen) and bal-loon borne measurements of NO2profiles. Filled and open sym-bols correspond to backward and forward coincidences, respec-tively. Observation sites and conditions are indicated in the legend. SCIAMACHY data corresponding to the backward coincidence on 4 March 2003, at Kiruna are shifted by−2 km. The mean devi-ation of all coincident data in the 20 km–31 km altitude is 1.8% with 12.4% standard deviation. The grey lines indicate the mean at 0.018 and the one and two times standard deviation boundaries with respect to the 20 km–31 km altitude range. The grey error bars indicate the mean combined errors of the satellite and balloon borne observations including modelling error. Note the broken abscissa.
ments average the horizontal trace gas distribution along the line-of-sight from the balloon to the sun. Deviations as in Fig. 6e and f might originate from the difference in horizon-tal averaging. Good agreement is found for the backward co-incidences in Fig. 6b and c. However, the forward coincident measurements in Fig. 6b, c, e and f show large deviations be-tween satellite and balloon borne data. Since the uncertainty of the air mass trajectory calculations increases with increas-ing time-lag to initialization of the trajectory model, the in-fluence of horizontally inhomogeneous air masses might be enhanced for the forward calculations where the time-lag is about ten hours larger than in the backward case. Unfortu-nately, there are no DOAS or LPMA data available for the observations below 19 km at the mid-latitudinal station Aire sur l’Adour, but SCIAMACHY limb profiles and the corre-sponding profiles inferred from in-situ O3sondes agree well, see Fig. 6d. Figure 8 reveals that the combined error bars cannot explain the observed discrepancies below 20 km alti-tude.
4.2.2 NO2validation study
LPMA/DOAS observations in Fig. 7b and c mostly lie within the combined error bars. Nonetheless, for the flight from Kiruna on 23 March 2003, LPMA underestimates the DOAS profile for balloon ascent and overestimates it for sunset as already seen in Fig. 5.2. Remarkable agreement can be ob-served for DOAS profiles retrieved from measurements dur-ing balloon ascent and sunset which are scaled to the pho-tochemical regime of the same SCIAMACHY observation, proofing the validity of our photochemical as well as meteo-rological approach.
The comparison between NO2profiles inferred from the SCIAMACHY limb measurements and the validation data set is presented in Figs. 7 and 9. Although a detailed com-parison of the different retrieval exercises is beyond the scope of the present study, we note that the internal agreement of the satellite data is variable. NO2 profiles inferred by IUP-Bremen and IUP-Heidelberg show good agreement. Devi-ations are observed for 9 October 2003, Fig. 7d, at 30 km altitude and for 24 March 2004, Fig. 7e, below 20 km. In some cases, e.g. Fig. 7d, the Harvard NO2 retrieval yields smaller trace gas concentrations than the IUP-Bremen algo-rithm around 25 to 27 km altitude. In one case, the back-ward coincidence in Fig. 7e and f, where SCIAMACHY was operating in a non-nominal measurement mode and pointing could not be verified, the Harvard profiles are offset by +2 km to +3 km with respect to the other satellite data. For the forward coincidence at Kiruna in 2004, agreement is good. In the following we refer our discussion to the IUP-Bremen records as the latter agree best with the balloon borne data. Implications for the Harvard and IUP-Heidelberg retrievals can be inferred easily.
In the 20 km to 30 km altitude range the agreement be-tween the balloon borne NO2 profiles and the satellite ob-servations is on the order of 20% and most often well rep-resented by the combined error bars. The latter amount to about 1.5 to 3 times the observed standard deviation between the two data sets for all coincident datapoints in the consid-ered altitude range. No clear trend can be observed except for the backward observations at Kiruna on 4 March 2003, Fig. 7a, where an altitude offset of +2 km to +3 km of the SCIAMACHY with respect to the LPMA data is clearly vis-ible. The same might be true for the forward coincidences at Kiruna in 2004, Fig. 7e and f, but the offset is not as clear as for the former comparison.
Below 20 km the level of agreement is variable. Similar to the O3comparison, the backward coincidences in Fig. 7b, c, e and f reveal moderate deviations whereas the correspond-ing forward coincidences exhibit larger differences between the satellite and the balloon borne measurements. Further, as can been seen in Fig. 7e, the SCIAMACHY limb profiles retrieved by the IUP-Bremen, IUP-Heidelberg and Harvard algorithms exhibit sizeable discrepancies below 20 km. This indicates that for low altitudes the SCIAMACHY retrieval might depend on the actual parameters, e.g. a priori informa-tion, used. The latter finding is supported by the
characteris-tics of the corresponding averaging kernels, Fig. 5.2, which grow wider below 20 km altitude. The combined relative er-rors shown in Fig. 9 increase dramatically with decreasing al-titude since, there, the absolute abundances of NO2are very low. The relative errors of SCIAMACHY NO2 measure-ments below 15 km typically are larger than 50%. Adding the rather large modelling error and the error of the balloon borne measurements, the combined error bars are often on the order of the observed deviation. Despite the large com-bined error bars, a systematic underestimation of the balloon by the satellite borne data is obvious.
5 Conclusions
Stratospheric O3and NO2abundances inferred from differ-ent sensors are inter-compared.
In the first part of this study line-of-sight absorptions and vertical profiles retrieved from the UV/vis DOAS spectrom-eter and the LPMA FT-IR both performing balloon borne di-rect sun measurements during balloon ascent and solar oc-cultation are compared. The general agreement is±10% and ±20% for O3and NO2, respectively. The observations in the visible wavelength range exhibit higher precision and better altitude resolution than the FT-IR measurements due to lower instrumental noise and higher sampling frequency. In solar occultation, the smaller field of view of the FT-IR partly com-pensates the deficiency in altitude resolution. A small bias between the data inferred from the visible and from the IR observed for both gases could be explained by errors of the spectroscopic parameters, i.e. absorption cross sections and their pressure and temperature dependencies, or remaining correlations between the retrieval parameters. However, the bias lies within the errors of individual measurements.
cannot be unambiguously attributed to the satellite retrievals or the validation strategy, it is important for future studies to keep the spatial and temporal mismatch between satellite and validation measurements as small as possible. The internal agreement of the satellite NO2retrieval exercises developed by IUP-Bremen, Harvard and IUP-Heidelberg, is promising. Finally, the present study provides a data set which can contribute to the improvement and the validation of future official ESA algorithms currently under development.
The presented balloon borne profiles are made available to the public via our web-site http://www.iup.uni-heidelberg. de/institut/forschung/groups/atmosphere/stratosphere/.
Acknowledgements. The present work has been conducted within ESA contracts AO 146 and AO 465 and funding came through the Bundesministerium f¨ur Bildung und Forschung (BMBF) con-tracts BMBF-07UFE12/8, DLR-50EE0017, and DLR-50EE0027 and the European Union (project TOPOZ-III, EVK2-CT-2001-00102). Some data shown here were calculated on HLRN (High-Performance Computer Center North). Services and support are gratefully acknowledged. Additional support was provided by Vernetzungsfonds of the German Helmholtz-Gemeinschaft and the European Space Agency through the ESABC project. The ECMWF data are made available by the German Weather Service (Deutscher Wetterdienst, DWD). In particular, we thank the team of CNES for the assistance given to perform successfully the balloon flights, and the offered hospitality and support of the SSC team from Esrange/Sweden and the CNES team from Aire sur l’Adour/France.
Edited by: H. Kelder
References
Anderson, S. and Mauersberger, K.: Laser measurements of ozone absorption cross sections in the Chappuis band, Geophys. Res. Lett., 19(9), 933–936, 1992.
Bacmeister, J. T., Kuell, V., Offermann, D., Riese, M., and Elkins, J. W.: Intercomparison of satellite and aircraft observations of ozone, CFC-11, and NO(y) using trajectory mapping, J. Geo-phys. Res., 104(D13), 16 379–16 390, 1999.
Bogumil, K., Orphal, J., Voigt, S., Bovensmann, H., Fleischmann, O. C., Hartmann, M., Homann, T., Spietz, P., Vogel, A., and Bur-rows, J. P.: Reference Spectra of Atmospheric Trace Gases Mea-sured by the SCIAMACHY PFM Satellite Spectrometer, Proc. 1st Europ. Sympos. Atmos. Meas. from Space (ESAMS-99), Vol. 2, ISSN 1022-6656, ESA-ESTEC, Noordwijk, 443–447, 1999. Bogumil, K., Orphal, J., Homann, T., Voigt, S., Spietz, P.,
Fleis-chmann, O. C., Vogel, A., Hartmann, M., Bovensmann, H., Frerik, J., and Burrows, J. P.: Measurements of Molecular Ab-sorption Spectra with the SCIAMACHY Pre-Flight Model: In-strument Characterization and Reference Data for Atmospheric Remote-Sensing in the 230-2380 nm Region, J. Photochem. Pho-tobiol. A., 157, 167–184, 2003.
B¨osch, H., Camy-Peyret, C., Chipperfield, M., Fitzenberger, R., Harder, H., Schiller, C., Schneider, M., Trautmann, T., and Pfeil-sticker, K.: Intercomparison of measured and modeled strato-spheric UV/vis actinic fluxes at large solar zenith angles, Geo-phys. Res. Lett., 28, 1179–1182, 2001.
B¨osch, H., Camy-Peyret, C., Chipperfield, M. P., Fitzenberger, R., Harder, H., Platt, U., and Pfeilsticker, K.: Upper limits of strato-spheric IO and OIO inferred from center-to-limb-darkening-corrected balloon-borne solar occultation visible spectra: Impli-cations for total gaseous iodine and stratospheric ozone, J. Geo-phys. Res., 108(D15), 4455, doi:10.1029/2002JD003078, 2003. Bracher, A., Sinnhuber, M., Rozanov, A., and Burrows, J. P.: Using
a photochemical model for the validation of NO2satellite mea-surements at different solar zenith angles, Atmos. Chem. Phys., 5, 393-408, 2005.
Brinksma, E. J., Bracher, A., Lolkema, D. E., Segers, A. J., Boyd, I. S., Bramstedt, K., Claude, H., Godin-Beekmann, S., Hansen, G., Kopp, G., Leblanc, T., McDermid, I. S., Meijer, Y. J., Nakane, H., Parrish, A., von Savigny, C., Strebel, K., Swart, D. P. J., Taha, G., and Piters, A. J. M.: Geophysical validation of SCIA-MACHY Limb Ozone Profiles, Atmos. Chem. Phys., 6, 197– 209, 2006.
Burkholder, J. B. and Talukdar, R. K.: Temperature dependence of the ozone absorption cross section over the wavelength range 410 to 760 nm, Geophys. Res. Lett., 21, 581–584, 1994. Burrows, J. P., H¨olzle, E., Goede, A. P. H., Visser, H., and Fricke,
W.: SCIAMACHY – Scanning Imaging Absorption Spectrom-eter for Atmospheric Chartography, Acta Astronautica, 35(7), 445–451, 1995.
Bovensmann, H., Burrows, J. P., Buchwitz, M., Frerick, J., No¨el, S., Rozanov, V. V., Chance, K. V., and Goede, A. P. H.: SCIA-MACHY: Mission Objectives and Measurement Modes, J. At-mos. Sci., 56, 127–150, 1999.
Camy-Peyret, C., Flaud, J.-M., Perrin, A., Rinsland, C. P., Gold-man, A., and Murcray, F.: Stratospheric N2O5, CH4and N2O profiles from IR solar occultation spectra, J. Atmos. Chem., 16, 31–40, 1993.
Camy-Peyret, C.: Balloon-borne Fourier transform spectroscopy for measurements of atmospheric trace gases, Spectrochim. Acta, 51A, 1143–1152, 1995.
Chipperfield, M. P.: Multiannual simulations with a 3-D CTM, J. Geophys. Res., 1104, 1781–1806, 1999.
Cohen, R. C., Perkins, K. K., Koch, L. C., Stimpfle, R. M., Wennberg, P. O., Hanisco, T. F., Lanzendorf, E. J., Bonne, G. P., Voss, P. B., Salawitch, R. J., Del Negro, L. A., Wilson, J. C., McElroy, C. T., and Bui, T. B.: Quantitative constraints on the atmospheric chemistry of nitrogen oxides: An analy-sis along chemical coordinates, J. Geophys. Res., 105, 24 283-24 304, 2000.
Connor, B. J., Siskind, D. E., Tsou, J. J., Parrish, A., and Remsberg, E. E.: Ground-based microwave observations of ozone in the upper stratosphere and mesosphere, J. Geophys. Res., 99(D8), 16 757-16 770, 1994.
Crutzen, P. J.: The influence of nitrogen oxides on the atmospheric ozone content, Q. J. R. Meteorol. Soc., 96, 320–325, 1970. Danilin, M. Y., Ko, M. K. W., Froidevaux, L., Santee, M. L., Lyjak,
L. V., Bevilacqua, R. M., Zawodny, J. M., Sasano, Y., Irie, H., Kondo, Y., Russell, J. M., Scott, C. J., and Read, W. G.: Trajec-tory hunting as an effective technique to validate multiplatform measurements: Analysis of the MLS, HALOE, SAGE-II, ILAS, and POAM-II data in October–November 1996, J. Geophy. Res., 107(D20), 4420, doi:10.1029/2001JD002012, 2002a.