Model-based Traction Force Microscopy
Reveals Differential Tension in Cellular Actin
Bundles
Jérôme R. D. Soiné1‡, Christoph A. Brand1‡, Jonathan Stricker2, Patrick W. Oakes2, Margaret L. Gardel2, Ulrich S. Schwarz1
*
1Institute for Theoretical Physics and BioQuant, Heidelberg University, Heidelberg, Germany,2Institute for Biophysical Dynamics, Department of Physics, and The James Franck Institute, University of Chicago, Chicago, United States of America
‡These authors contributed equally to this work. *[email protected]
Abstract
Adherent cells use forces at the cell-substrate interface to sense and respond to the physi-cal properties of their environment. These cell forces can be measured with traction force microscopy which inverts the equations of elasticity theory to calculate them from the defor-mations of soft polymer substrates. We introduce a new type of traction force microscopy that in contrast to traditional methods uses additional image data for cytoskeleton and adhe-sion structures and a biophysical model to improve the robustness of the inverse procedure and abolishes the need for regularization. We use this method to demonstrate that ventral stress fibers of U2OS-cells are typically under higher mechanical tension than dorsal stress fibers or transverse arcs.
Author Summary
Adherent cells respond very sensitively not only to biochemical, but also to physical prop-erties of their environment. For example, it has been shown that stem cell differentiation can be guided by substrate rigidity, which is sensed by cells by actively pulling on their en-vironment with actomyosin-generated forces. A commonly used method to measure cell forces during essential biological processes is traction force microscopy, which uses the de-formations of a soft elastic substrate to calculate cell forces. However, the standard setup for traction force microscopy suffers from mathematical limitations in calculating forces from displacements. In order to improve this method, we combine image data and bio-physical modelling to arrive at a procedure which is more robust and in addition allows us to make statements about the force distribution not only at the cell-substrate interface, but also inside the cell. Here we demonstrate this approach for the contractility of actin stress fibers, which we investigate experimentally with U2OS-cells and theoretically with an ac-tive cable network model.
OPEN ACCESS
Citation:Soiné JRD, Brand CA, Stricker J, Oakes PW, Gardel ML, Schwarz US (2015) Model-based Traction Force Microscopy Reveals Differential Tension in Cellular Actin Bundles. PLoS Comput Biol 11(3): e1004076. doi:10.1371/journal.pcbi.1004076
Editor:Deshpande Vikram, Cambridge University, UNITED KINGDOM
Received:September 30, 2014
Accepted:December 8, 2014
Published:March 6, 2015
Copyright:© 2015 Soiné et al. This is an open access article distributed under the terms of the
Creative Commons Attribution License, which permits unrestricted use, distribution, and reproduction in any medium, provided the original author and source are credited.
Data Availability Statement:All relevant data are within the paper and its Supporting Information files. Our image processing software SOFAST is available athttps://code.google.com/p/sofast-imagej-plugin/ source/browse/. Our MBTFM optimization code is available athttps://code.google.com/p/mbtfm/source/ browse/.
Introduction
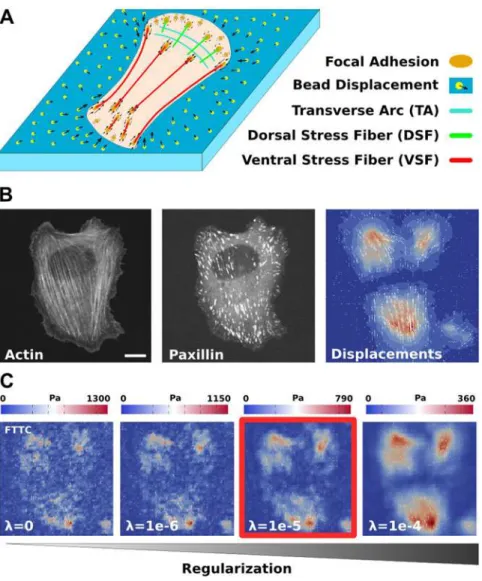
Adherent cells continuously probe the mechanical properties of their environment by exerting forces through integrin-based sites of adhesions (focal adhesions, FAs) [1,2]. These cellular forces are mainly generated by myosin II motors that interact with different types of actin net-works and bundles [3,4]. The most prominent actin structures in cells cultured on flat surfaces are stress fibers (SFs), which have been further classified into different subclasses (Fig 1A) [5,6]. Transverse arcs (TAs) run parallel to the cell periphery and are connected to FAs only in-directly through dorsal stress fibers (DSFs), which emanate radially from peripheral FAs and run parallel to the dorsal membrane. Ventral stress fibers (VSFs) are connected at both ends to FAs and run parallel to the ventral membrane. Additionally the actin cortex and distributed actin networks contribute to force generation due to myosin II activity and actin polymeriza-tion. Together, the system built of FAs, SFs and actin networks regulates cell shape and the dis-tribution of stresses on the substrate, thereby mediating the mechanical interactions of the cell with the extracellular environment [1,3,7]. Thus it is essential to develop methods to measure cellular forces and to associate them with individual components of this system in order to un-derstand how cells precisely control force generation.
Different experimental methods have been developed before to measure cellular forces and to relate them to the structural organization of the cell. Forces at FAs have been measured with traction force microscopy (TFM) on soft elastic substrates [8–10], pillar arrays [11,12], and fluo-rescent force sensors [13–18]. TFM is the most direct and convenient method because it requires only small changes to standard cell culture protocols. Cells are plated on a soft polymer film (usually a polyacrylamide gel) with embedded marker beads (Fig 1A). An appropriate cell type for the study of stress fibers are U2OS-cells [6], which typically show a well-developed system of SFs and FAs (Fig 1B,S1). Taking a reference image with the cell removed from the substrate, the relaxation of the fluorescent marker beads can be used to extract substrate deformations (vector field inFig 1B, combined with a contour plot for the magnitude). From this information the traction force field can be reconstructed (Fig 1C) and correlated with the internal actin structure, including actin retrograde flow and SFs [19,20]. In particular, it has been found that mature (μm-sized) FAs are often connected to stress fibers, which act as growth templates and force
transducers at the same time, and transmit a typical force of a few nN [21,22].
Measuring forces inside the cell is much more challenging than measuring them at the cell-substrate interface. The contractile tension of a single SF can be estimated by laser cutting of in-dividual stress fibers [20,23–25]. However, no experimental technique has been developed yet to measure forces inside the whole set of SFs in a cell. The mean force contribution of the actin cortex and distributed networks can be assessed by fitting whole cell contraction models to traction maps reconstructed in TFM experiments as shown first for small cell colonies [26–28] and recently also for single cells [29,30]. These measurements have revealed that the effective cortical tension is of the order of nN/μm [26,31].
From a mathematical point of view, the reconstruction of traction forces from bead displace-ments is an inverse problem of elasticity theory. Due to experimental noise in the displacement data, it is ill-posed and requires additional information to lead to a unique force estimate. To re-solve this issue, one typically complements the reconstruction by a regularization scheme. This process amounts to making a priori assumptions on the expected force scale and the spatial dis-tribution of cellular traction [8,32,33]. Typically, high local tractions and steep traction gradients are repressed, and the repression is adjusted by regularization parameters. This strategy has been shown to effectively reduce the effects of experimental uncertainties and to achieve unique solutions which however are influenced by the regularization procedure. A rigorous way to
uni-hd.de, to JTDS and USS) and the Konrad Adenauer Foundation (http://www.kas.de, to CAB). Packard Foundation and Burroughs Wellcome Career Award at the Scientific Interface to MLG. The funders had no role in study design, data collection and analysis, decision to publish, or preparation of the manuscript.
determine the optimal regularization parameter is missing. Usually one attempts to achieve op-timal noise reduction by using the so-called L-curve criterion [34] or by force scale estimations using Bayesian theory [33,35]. The choice of the regularization parameter has a strong influence on the reconstructed traction distribution, seeFig 1C(the solution marked in red is the standard choice based on a Bayesian argument). If it is chosen too small, the calculated forces are domi-nated by noise rather than by cellular processes. If it is chosen too large, the details of the force field are smoothed out and the overall force magnitude is too small. Moreover the noise condi-tions, and thereby the optimal parameter values, may also vary within a set of experiments.
In order to improve the standard procedures in traction force microscopy, here we introduce model-based traction force microscopy (MBTFM). The main idea is to complement the traction reconstruction process with more information beyond the displacement data, including a
Fig 1. Actin cytoskeleton and traction force microscopy.(A) Schematics of a cell cultured on a soft elastic substrate with embedded fluorescent marker beads. Three different kinds of stress fibers and the actin network result in forces being transmitted to the substrate through focal adhesions. (B) Experimental data for a representative U2OS-cell. Actin and paxillin images show stress fibers and focal adhesions, respectively. Displacement data is extracted form the movement of the marker beads. Scale bar 10 microns. (C) Reconstruction of the traction forces with regularized Fourier Transform Traction Cytometry depends on the choice of a regularization parameter. The standard choice based on a Bayesian estimate is marked by the red box.
biophysical model that represents the essential features of interest. Therefore the model choice can be variable and might be different when e.g. studying migration of rapidly moving cells ver-sus mature adhesion of immobile or slowly migrating cells. In any case, image processing can be used to extract prominent features of the cell type under investigation and to augment the biophysical model with this information. Here we implement this approach for U2OS-cells that show mature adhesions and whose contractile machinery is strongly dominated by actin SFs. Image processing is used to segment FAs and SFs, and this information is utilized for building a cell model. By supplementing TFM with a specific whole cell model, one creates a better defined inverse procedure based on biophysical arguments that allows one to improve standard regular-ization techniques. In particular, an appropriate choice of the biophysical model might allow one to abolish the need for regularization because the model might be sufficiently constraining to exclude unreasonable solutions. Once established, the cell model can be interrogated for bio-logically relevant questions. In the context of the maturely adhering U2OS-cell studied here, we ask how force is distributed statistically over the ensemble of different SFs and how much actin network contraction contributes to the overall amount of cell tension.
In this study we chose an active cable network as a minimal model to represent the two main features of actomyosin contractility in U2OS-cells, namely the constant pull by the myosin II mo-tors and the asymmetry between stretching and compression dominating the mechanical response of an actin bundle [36] (S2 Fig). We give a detailed description of the method and demonstrate the application to experimental data. In particular we show that for U2OS-cells, actin SFs represent the main source of cellular traction forces while contraction of actin networks have a minor influence. Further we found that ventral SFs are significantly more contractile than dorsal SFs and transverse arcs, in agreement with earlier work on the molecular composition of the different structures.
Methods
Cell culture
U2OS human osteosarcoma cells (ATCC) were cultured in McCoy's 5A media (Sigma) supple-mented with 10% fetal bovine serum (HyClone), 2 mM L-glutamine (Gibco) and penicillin-streptomycin (Gibco). U2OS-cells were transfected with plasmid DNA constructs encoding for GFP-actin (gift of the Gary Borisy Lab, Northwestern University) and mApple-paxillin using the transfection reagent FuGENE 6 (Roche). Cells were plated and allowed to attach and spread for approximately 16 hours prior to imaging.
Polyacrylamide substrates for traction force microscopy
Polyacrylamide (PAA) substrates containing far-red fluorescent microbeads (Invitrogen, d = 40 nm) were prepared on glass coverslips using previously published methods10,37. Briefly, PAA gels with 7.5%/0.1% weight percentage of acrylamide/bis-acrylamide was used to create a gel with a shear elastic moduli of 8.4 kPa [37,38]. Fibronectin (Millipore) was coupled to the surface of the PAA gels by means of hydrazine hydrate [22,37,39] as previously described. PAA gels were incu-bated for at least 2 hours in undiluted hydrazine, followed by a 1 hour incubation in 5% acetic acid and then washed. A 10μg/mL fibronectin solution was prepared in sodium acetate buffer (pH 4.5),
and oxidized by addition of 40μg/mL sodium meta-periodate prior to a 30 min incubation on the
PAA gel at room temperature. The PAA gels were then rinsed repeatedly and plated with cells.
Microscopy
642 nm laser lines (Spectral Applied Research) and an HQ2 cooled CCD camera (Roper Scien-tific). All hardware was controlled via Metamorph acquisition software (MDS Analytical Tech-nologies). Traction force data was obtained at 37°C in a perfusion chamber (Warner
Instruments) using a 60x 1.2 NA Plan Apo WI objective (Nikon). Cells were maintained in cul-ture media supplemented with 10 mM HEPES and 30μl/ml Oxyrase (Oxyrase, Inc.).
Displacement analysis and FTTC force reconstruction
Methods for traction force microscopy have been previously described [10,22,37]. Briefly, images of fluorescent beads embedded in the PAA gel were aligned to compensate for experimental drift and the bead displacement field was calculated between pairs of images by comparing the unstrained bead images obtained after the cell had been removed to images obtained with an attached cell. Dis-placement fields were calculated using Particle Imaging Velocimetry (PIV) software in MATLAB (available athttp://www.oceanwave.jp/softwares/mpiv/), using the Minimum Quadratic Differ-ences (MQD) algorithm which calculates the shift necessary to produce the minimum cross-correlation coefficient between a small region of the experiment image and the reference image. Displacement vectors were filtered and interpolated using the kriging interpolation method. We used a displacement grid size of 0.86μm for these measurements. From the displacement data,
Fourier transform traction cytometry (FTTC) [9] was then used to estimate traction stress [10]. Traction stresses were reconstructed with zeroth-order regularization, which has been shown to yield traction force measurements consistent with the boundary element method [10].
Model choice
In this study we correlate cellular forces with SFs and FAs. For this purpose we need to utilize a mechanical model for the entire cell that allows us to describe its force generating and transmit-ting behavior. Several models describing forces of adherent cells have been developed over the past decade. Contour models have been shown to give reasonable estimates for cell forces and shapes if there are no prominent internal structures [29,36]. Continuum mechanics models focus on the elastic properties of the bulk cell material [40–42]. In a recent study, these ap-proaches have been combined in a continuum mechanics model with line tension [30]. Howev-er, all of these models have a continuum character and none of them can easily implement differential tensions in discrete stress fibers. For pillar assays, truss models have been used to estimate tension in internal stress fibers from post displacements [43,44], but these models did not consider the effect of the cell body and work only for a small number of adhesion sites.
For our model choice, we were guided by the following four principles. (1) U2OS-cells are a cell type characterized by prominent stress fibers that have to be modeled as discrete elements. (2) Stress fibers are under tension and the tension may vary between individual SFs. (3) There is a homogeneous contractile tension in the cell resulting from various distributed actomyosin networks not visible with the standard optical microscope. (4) Forces are transmitted to the ex-tracellular space mainly via focal adhesions. A suitable framework to implement these assump-tions is a network of active cables [45]. A cable responds like a Hookean spring to extension while it does not resist compression, and an active cable additionally features a constant con-tractile tension. Each link of the network is therefore associated with the energy Ei= liTi+k
(li-li,0)2/2 for li>li,0and Ei= liTifor lili,0, where li, li,0represent the actual and the rest length
of link i, respectively, Tiis its active tension, and k is the spring constant for the elastic regime.
exchanged with the third dimension. The constant contractile tension arises from myosin II motors that work in the stall regime. Active cable models have been shown to correctly predict shapes of adherent cells on micpatterned substrates and yield force distributions that are ro-bust with respect to local changes in network geometry or topography [45]. Note that this dif-fers remarkably from networks of Hookean springs. Springs in particular propagate
compressive force modes over long distances, which do not appear in cables by definition. In order to achieve a close relation to experiments, the model is built directly from image data.
Image processing and model generation
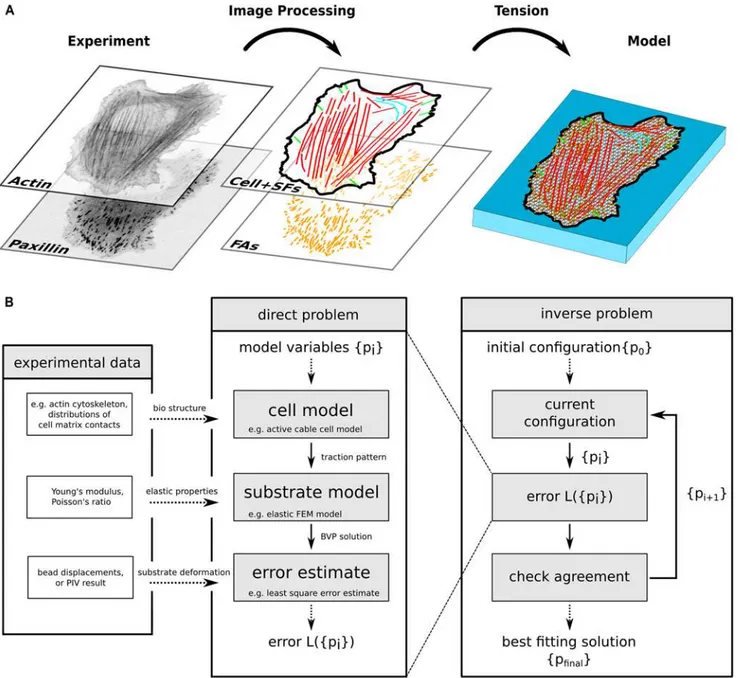
To generate the biophysical model for a specific cell, we wrote a new plugin SoFAST (Segmen-tation of Focal Adhesions and Stress Fibers) for the image processing suite ImageJ [47] and proceed as follows (Fig 2A). First we segment FAs and stress fibers from paxillin and actin fluo-rescence images, respectively. Here it is important to avoid undersegmentation (cf. results sec-tion). Second, we classify SFs following the definitions of Hotulainen et al. [6], where we also utilize information about FA locations. Third, a mechanical network of nodes and links is fitted into the cell shape as segmented from the actin image. SFs are embedded into the network as lines, irrespective of their type. While these lines are fixed, we use the Distmesh algorithm [48] to achieve a homogeneous mesh size. We then fix nodes in the proximity of FAs.
Now the network can be contracted by assigning a global tension to the network and one tension value to each individual SF, resulting in less than 100 degrees of freedom (com-pared to many thousands of degrees of freedom in traditional TFM). The resulting force at each fixed node is calculated and mapped to the closest FA. Note that there can be more than one node fixed for a single FA, depending on its area. Finally, cellular traction spots are defined by the shape and area of an ellipse fitted to the FA, and the force vector sum of all fixed nodes mapped to the particular FA.
Model for the soft elastic substrate
Displacement fields can be obtained from cellular tractions with a material model of the soft elastic substrate. Substrates used in our experiments are isotropic with a Young's modulus of several kPa. Since cellular traction stresses are on the order of several hundred Pa, deformations are small (fewμm). Moreover the deformation gradients are always
smaller than 1 (maximal value 0.15). Therefore substrate deformations can be calculated in the framework of linear elasticity theory. Several analytic solutions exist for specifically shaped traction spots on the surface of an elastic half space, e. g. for circular spots or the Boussinesq solution for point forces [49]. In order to be able to also treat FAs with non-circular (elliptical) shape, here we use a finite element method (FEM) approach.
The elastic problem is stated as a boundary value problem (BVP), where cellular traction stress defines the boundary condition at the substrate’s top surface. The bottom surface is rigid-ly fixed to a glass cover slip, and therefore all displacements have to vanish there. The free boundaries at the sides are assumed to be stress free. To ensure that the latter is a justified as-sumption, the substrate model is extended in lateral direction on each side by 30μm (compared
to the visible region of the image data, which is ca. 100x100μm2). Our software uses the public
Optimization
With the cell and substrate models described above, we are now able to calculate a simulated displacement field for a given set of model parameters. The intention of MBTFM is, however, to solve the inverse problem of finding the optimal set of model parameters (and thereby the reconstructed tractions) for a given cellular displacement field (Fig 2B). To define optimality, we need to specify an error estimate for the deviation of the experimentally measured field and one that is simulated for a given set of model parameters. This is achieved by the least squares estimator L2= (1/N)∑x(de,x-ds,x)2(L2-norm), where the sum runs over all locations of
Fig 2. Computational workflow of MBTFM.(A) Actin and paxillin images are segmented and converted into a whole cell model, with an individual tension value assigned to each stress fiber and one global tension value assigned to the actin networks of the cell. (B) Each set of model parameters leads to an error estimate which is then minimized to estimate the best fit to the experimentally measured displacement field. In contrast to standard traction force microscopy, no regularization scheme is required for MBTFM.
displacement measurements for the discrete experimental displacement field, N is the number of data points, and de, dsare the experimental and simulated displacements. We can then
uti-lize standard optimization techniques to find an optimal solution.
For the active cable network, we apply an adapted version of the conjugated gradients algo-rithm. Since the change in tension in a single stress fiber affects the traction distribution more locally than an alteration in the global background tension, we separate the optimization into blocks. We perform repeated optimizations of the fiber tensions, before we adjust the back-ground tension. This prevents the algorithm from stalling and leads to reasonable convergence at ~ 200 optimization steps. Note that every minimization iteration involves several calcula-tions of both cellular network contraction and FEM substrate deformation. As this is expensive in terms of computation time, the numerical work is parallelized using the boost thread library [50]. In this way, multiple points of the L2-landscape with varying stress fiber tensions can be
explored at the same time, leading to faster calculations of the high-dimensional gradients and quicker line minimizations. The computation time on 8 cores of current Intel i7 processors is on the order of 15 minutes per iteration step.
For later analysis, we define two instructive measures for whole cell contractility obtained by our optimization approach. After contraction with the optimal set of stress fiber tensions and the additional background tension, the sum of absolute resulting forces at all focal adhe-sions is called the total force. The network force on the other hand is determined by setting all stress fiber tensions to the background tension.
Results
MBTFM workflow
We started by segmenting fluorescent images for SFs and FAs and constructing a cell-specific active cable model that spans the whole cell (Fig 2,S2 Fig). We combined this model with a FEM-representation of the soft elastic substrate in order to be able to directly compare pre-dicted and measured displacements. Starting from all tensions set to zero, we optimized for the model parameter set with the best agreement of the two displacement fields. Although not di-rectly part of the optimization process, traction forces then could be didi-rectly inferred from the active cable network.
Distribution of focal adhesions and stress fibers
In order to study the influence of actin SFs to the measured substrate deformations and their correlation with FA orientation and shape, we analyzed the alignment of FAs, SFs, and local displacement directions at anchoring points of SFs to the substrate. For this task we segmented all SFs and FAs from a data set of 16 U2OS-cells. We fitted an ellipse to each segmented FA and evaluated the direction of the main axis and the corresponding area. We found that FAs connected to a SF are highly aligned with them (Fig 3A). Further we could also observe an alignment of SF direction and local substrate displacement at the anchoring points SF end at-tached to a FA, seeFig 3B. These alignment distributions become even more peaked when given a stronger weight to larger deformations. The derived angular distributions indicates a strong influence of actin stress fibers on both the maturation of FA and the force transmission to the extracellular environment. Additionally we found that the size distributions of FAs with and without attached SF significantly differ (Fig 3C). The possibility of a FA to be larger than 1μm is considerably larger for FAs with attached SF than for FAs without. Together these
Robustness of the method
Because MBTFM does not include a regularization scheme, we investigated how it performs in the presence of noise. The spatial resolution of TFM is mainly constrained by experimental un-certainties in measuring bead displacements, which originate from limited optical resolution of the microscopy setup, uncertainties in the image processing procedures and heterogeneities in the substrate material with its embedded marker beads. The uncertainty in a given data set can be determined by analyzing the distribution of absolute displacement magnitudes at cell-free re-gions of the substrate image. Such evaluations led to Gaussian-shaped distributions in our data set, as reported earlier [33]. We therefore summarize the possible uncertainties under the term
displacement noise, for which we find a typical value of 5–10%. In order to test the performance of MBTFM in an experimental context, we first simulated its ability to reconstruct a given trac-tion pattern in the presence of such displacement noise (Fig 4A-C). The deviation between the theoretical prediction and experimental measurement is represented by the relative L2-norm
that ranges between 0 for perfect agreement and 1 for a vanishing force field. We sampled 10 different displacement fields for each noise level and averaged over the reconstruction results. While the L2-norm naturally approaches 1 for higher noise levels (Fig 4A), we find that
MBTFM still performs very well in the experimentally relevant range of displacement noise from 5–10% (Fig 4B+C). Interestingly, the reconstructed total force remains almost constant over the entire range of simulated noise levels, which confirms the robustness of the method
(Fig 4B). In a second evaluation of simulated data, we checked the influence of erroneous
seg-mentation (S3 Fig). We find that segmenting too few SFs leads to a force shifting to neighboring fibers. Because cable networks do not propagate compression, this remains a local effect [45], which is also verified in our test reconstructions. On the other hand, segmenting too many stress fibers barely affects the reconstruction result as these additional degrees of freedom do not have to be used by the optimal solution. We conclude that it is important to avoid undersegmentation rather than oversegmentation of SFs and that MBTFM performs very well in the presence of dis-placement noise despite the fact that it does not use any regularization scheme. This shows that our biophysical model is a reasonable assumption that leads to well-defined solutions.
In general, we cannot rigorously prove that the results of our method are unique. However, we performed several types of simulations to demonstrate that under realistic conditions our re-construction method comes close to the global minimum. First, we used different initial tension configurations for the reconstruction of simulated data. They all converged to the same correct L2minimum for the examined test cell geometries. If there were many local minima other than
Fig 3. Orientation analysis of focal adhesions, stress fibers, and local displacements for U2OS-cells.(A) Relative angular distribution of FAs and attached SFs (top, n = 1305). (B) Relative angular distribution of local displacements at anchoring points of SFs (middle, n = 1297). (C) Area distribution of mature FAs with (blue) and without attached SFs (green) (bottom,n = 3612). The distributions are based on a data set of 16 U2OS-cells on soft elastic substrates (Young's modulus E = 8.4kPa).
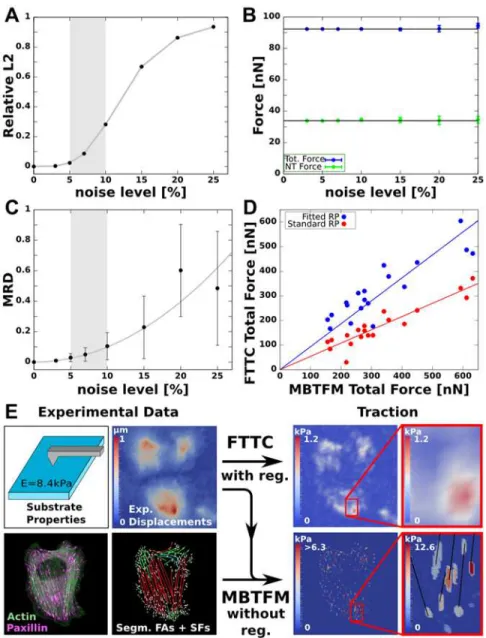
Fig 4. Robustness of MBTFM and comparison with FTTC.(A) Realistic traction patterns are generated by calculating the direct problem for a known test tension distribution. Gaussian noise is added to the resulting displacement vectors. The noise level is defined with respect to the largest displacement in the whole field. With increasing noise level the L2error estimate increases continuously as expected. (B) Total forces and network forces reconstructed with MBTFM are not affected by the noise level in the simulations, in marked contrast to standard reconstruction methods like FTTC. (C) The precision of tension predictions for individual stress fibers decreases for higher noise level (MRD: mean relative deviation). By evaluating experimental displacement data for noise in traction-free regions, we find a typical experimental noise level between 5–10%. In this region (gray), the MRD does not exceed 10%, which we thus identify with the accuracy of our tension reconstruction for stress fibers. (D) Direct comparison of the total force obtained with FTTC and MBTFM reveals a linear relationship (red). The slope of the linear fit line here depends on the regularization parameter alone. By fitting the regularization parameter to a one-to-one relationship (blue), FTTC can be calibrated based on the biophysical model input instead of traditional noise optimization (red). (E)
Comparison of the standard TFM method FTTC and MBTFM. Based on the additional experimental data, the model can achieve a more detailed traction map. Further it allows us to directly map tensions in single stress fibers (black lines in inset) to experimental displacements.
the correct minimum in the L2-landscape, one would expect the optimization to stall in a local
minimum for some initial configuration instead. Second, when we explored the effect of dis-placement noise, we observed that the final stress fiber configuration deviated only slightly from the correct solution for small noise levels. This also points to the existence and identification of a single global minimum, albeit this is slightly shifted due to non-vanishing noise.
Comparison with FTTC
One of the most common techniques to reconstruct traction force based on TFM data is Fourier Transform Traction Cytometry (FTTC) [9,10]. In addition to the substrate-related information that is used in FTTC, MBTFM also uses fluorescence image data of the cell and a biophysical model (Fig 4E). Together this enables MBTFM to dispense with regularization. In order to quan-titatively validate and compare our method with this well-established approach, we systematical-ly anasystematical-lyzed experimental data using both methods. We find that the resulting total forces are linearly correlated between MBTFM and FTTC reconstructions (red symbols inFig 4D). In con-trast to MBTFM the results of FTTC depend on a regularization parameter and are systematical-ly smaller when based on optimal noise reduction (red line has a slope smaller than 1). By fitting the regularization parameter, we can achieve good agreement between the two methods (blue symbols, now the blue line has slope 1). From this we conclude that MBTFM represents an alter-native way to calibrate the regularization scheme independent of standard optimal noise reduc-tion [34] or force scale arguments [33] and based on biophysical model considerations alone.
Estimating tensions in individual SFs
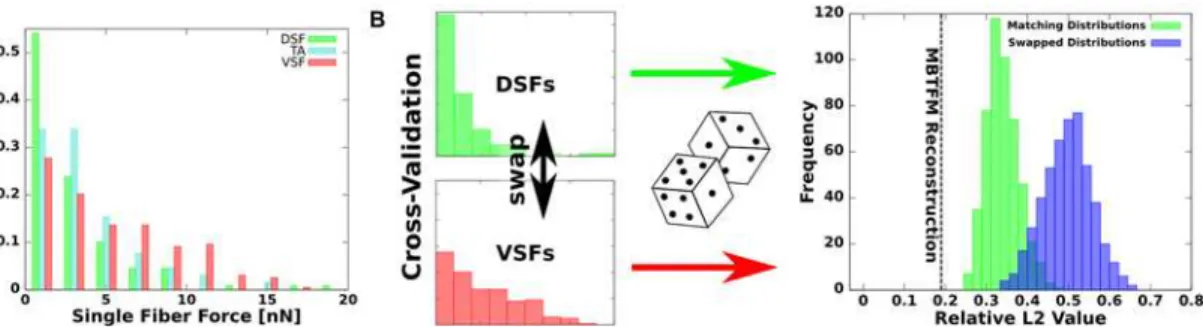
A further substantial feature of MBTFM is its capability to directly associate measured substrate deformation with a certain configuration of intracellular tension. Note that the displacements and not tractions constitute the experimental data in TFM. As our model yields contractile forces for all SFs in the cell, we can assess their statistical distribution. We have analyzed a data set of 16 U2OS-cell with 369 segmented SFs in total. We found that the distributed actin net-works never carry more than 20% of the overall force. We further derived a statistical distribu-tion of non-vanishing tension values over the different types of SFs (Fig 5A). As a result we found a broad statistical distribution of tension among the various stress fiber types, with VSFs being the most likely type of stress fiber to be under high levels of tension, followed by TAs and DSFs. These findings agree with the experimental observation that VSFs typically show myosin II striation and pull against FAs at both ends, while DSFs do not contain myosin II [6,51]. TAs seem to adopt an intermediate state with myosin II striation but no clear attachment to FAs. In order to demonstrate the significance of the extracted distributions, we performed the following consistency check. One cell was selected and new tension values were attributed to each fiber by drawing from statistical distributions. When drawing from the extracted distributions (green), we found a L2-norm that is close to the optimal value (result from the minimization procedure,
dashed line). When drawing from scrambled distributions (ventral and dorsal SF distributions swapped, TA distribution unchanged, blue), the L2-norm is clearly much worse. This shows
that the details of the distributions matters, despite the fact that they are relatively broad, and that ventral SFs are indeed the strongest types of contractile elements.
Discussion
models can find application in MBTFM, depending on the cell type and the scope of the study. In this article we focused the analysis on a cell contraction model based on active cables, which facilitates the analysis of actin stress fiber structures as they typically occur in U2OS-cells.
Compared to simpler models like contour models [29,31] or continuum mechanics models [30,40], our approach is particularly suited to analyze discrete elements of the actin cytoskele-ton. Compared to earlier studies that used truss models to evaluate a few stress fiber tensions on pillar arrays [43,44], we have implemented this procedure for cells on flat elastic substrates with hundreds of FAs. In particular, we are able to estimate for the first time the intracellular distribution of contractile tension over a large ensemble of many different fibers. By using the active cable network model, we assumed that cellular forces are generated by contraction of the actin CSK and that actin networks behave mechanically like cables under application of con-tractile tension [45]. Another crucial assumption is that forces are exclusively applied via focal adhesions. Both assumptions seem reasonable for U2OS-cell. However, these are not applicable for arbitrary cell types and cell states. The main reason is a variety of force generation processes are known to take place in the cell besides myosin-based contractility, including actin polymer-ization and membrane blebbing. Moreover force might be transmitted also through other ad-hesion structures than mature FAs, e.g. through nascent adad-hesion in spreading and migrating cells [52–54] or through podosomes and invadopodia in a variety of cell types [55] (but not the U2OS-cells studied here). While we cannot exclude that small structures invisible under the fluorescence microscope transmit some of the traction forces of U2OS-cells, we observed that the occurrence of prominent FAs strongly coincides with high stress transmission as confirmed by traditional regularized TFM and our orientation analysis (Fig 3).
Compared with traditional TFM approaches like FTTC, MBTFM allows us to obtain unique results independent of any regularization parameter. In the context of TFM, the active cable network should not be interpreted as a detailed biophysical model of the cell, but rather as a reasonable reduction of parameter space that restricts the set of possible solutions based on bio-physical relevance. This of course like traditional regularization biases the results towards a pri-ori assumptions. However, the solution target is compared to traditional methods not
motivated by simple noise reduction considerations but by a more detailed knowledge about the force generating biological system. Note that at the same time, MBTFM can be more robust to experimental noise than traditional TFM. We also showed an alternative way to calibrate
Fig 5. Statistical distribution of stress fiber tensions in U2OS-cells.(A) Histogram of single stress fiber tension values sorted by fiber types (16 U2OS-cells, N = 369 SFs). All three segmented types show a broad distribution due to biological variability, but VSFs are on average under the highest tension. (B) The statistical significance of the different distributions is verified by performing a consistency check in which the distributions are scrambled. We swap the distributions for the tensions of dorsal and ventral SFs (the tension distribution for transverse arcs is left unchanged) and then assign new tension values for a specific cell by drawing from these distributions. Because the new tension values are generated by random, none of them is as good as the optimal set (dashed line). However, repeated simulation with matching distributions (green) lead to significantly better error estimate values than using a swap of DSF and VSF distributions (blue).
standard reconstruction techniques by fitting the regularization parameter towards a best agreement with exemplary MBTFM results.
An additional advantage of the MBTFM approach is the inherent coupling of calculated sub-strate deformations with cellular mechanics. This allowed us to correlate the intracellular distri-bution of model tension with common TFM data. In this first application of the described method, we analyzed a data set of 16 U2OS-cells with N = 369 segmented SFs in total with the goal to investigate non-invasively the distribution of tension over the actin network and different types of SFs. As result of this evaluation we found that ventral SFs seem to be statistically stronger than other SF types. This is in good agreement with the distinct molecular structure of these fiber types as reported by various published studies [6,51]. We further successfully cross-checked the validity of this important result by simulations in which we scrambled the tension histograms.
MBTFM as introduced here strongly depends on very good image quality for building the biophysical model. Unfortunately, many common perturbations of the force-generating pro-cesses (e.g. pharmacological inhibitors like blebbistatin or latrunculin, or siRNA-knockdowns) lead to reduced contrast of the paxillin and actin images used here. In this case, our approach based on segmentation of prominent actin and adhesion structures can not be used and tradi-tional TFM has to be preferred. Thus our approach is best suited to study cells with mature cy-toskeletal and adhesion structures, like the wildtype U2OS-cells studied here.
In the future, our method can be used to dissect out the different mechanisms leading to the measured tensions, including myosin II contractility and retrograde flow. Because the method requires good contrast in the fluorescent data, one appropriate avenue for future progress seems to be the study of dynamical responses in wildtype cells, as they can be probed for example by laser cutting [20,23–25]. Using an appropriately adapted model, such an approach should allow us to dissect the details of stress fiber crosslinking in adherent cells. Another possible subject of large biological interest would be the extension to three-dimensional situations [56,57]. For a complete 3D-setup in the spirit of MBTFM, one had to track bead displacements, cell contour and internal cell structures in 3D, which is a large challenge to current microscopic techniques. If accomplished, however, such studies then will yield new mechanical insight into the mecha-nisms of global force transmission and sensing in the actin cytoskeleton of adherent cells.
Supporting Information
S1 Fig. Data for three representative U2OS-cells on soft elastic polyacrylamide substrates (E = 8.4 kPa).Cell 1 has also been used forFig 1. For each cell, the following data is shown: raw images of actin and paxillin fluorescence, segmented stress fibers, segemented focal adhe-sions, generated active cable network (link length 1 micron) and resulting MBTFM traction re-construction. Stress fiber color code: dorsal stress fibers (green), transverse arcs (turquoise) and ventral stress fibers (red). Red dots in the network indicate locations of focal adhesions, which are treated as fixed points during model network contraction. Scale bar 10 microns. (EPS)
S2 Fig. Active cable networks.(Top) Force-extension curve for a single active cable. In the ex-tension regime, L>L0, the cable responds linearly elastic, i.e. like a Hookean spring. In the
com-pression regime, L<L0, the cable does not resist deformation and the curve is flat. In addition,
the cable is assumed to experience an active contractile tension, T, which shifts the passive force-extension curve up by a fixed amount. This tension is assumed to break down if the length drops below a critical length LC= 0.01 L0). (Bottom) Snapshot of a representative active
the right. (TIFF)
S3 Fig. Effect of segmentation procedures.In order to explore the effect of our segmentation procedures on the force predictions, we considered three typical situations. (A) As an example for oversegmentation, we introduced three arbitrary additional VSFs (yellow arrowheads). Scale bar 10 microns. (B) As an example of undersegmentation, we removed two DSFs (yellow arrow-heads). (C) As another example of undersegmentation, we removed one VSF (yellow arrowhead). (D) L2-optimization with the conjugated gradient method as a function of the perturbations
(A-C). The result is changed only little by the oversegmentation (A). In marked contrast, the two undersegmentations (B,C) lead to much worse results as shown by the large L2-norm. (E) Detailed
analysis of the two undersegmentations. Stress fibers close to the missing ones (red arrowheads) try to compensate for the missing information and thus show very large deviations (more than 50%). (F) Effect on total and network force. Again oversegmentation does not change the result, while undersegmentation leads to a larger network force compensating for the reduced possibility to contract. The overall force nevertheless decreases because the anisotropic elements are missing. In summary, our procedure works well as long as the image data is not undersegmented.
(EPS)
Author Contributions
Conceived and designed the experiments: MLG USS. Performed the experiments: JRDS CAB JS PWO. Analyzed the data: JRDS CAB JS PWO MLG USS. Wrote the paper: JRDS CAB USS.
References
1. Geiger B., Spatz J. P. & Bershadsky A. D. Environmental sensing through focal adhesions.Nat.Rev.
Mol.Cell Biol. 10, 21–33 (2009). doi:10.1038/nrm2593PMID:19197329
2. Hoffman B. D., Grashoff C. & Schwartz M. a. Dynamic molecular processes mediate cellular mechano-transduction.Nature475, 316–23 (2011). doi:10.1038/nature10316PMID:21776077
3. Schwarz U. S. & Gardel M. L. United we stand—integrating the actin cytoskeleton and cell-matrix adhe-sions in cellular mechanotransduction.J.Cell Sci. (2012). doi:10.1242/jcs.093716PMID:22797913 4. Blanchoin L., Boujemaa-Paterski R., Sykes C. & Plastino J. Actin dynamics, architecture, and
mechan-ics in cell motility.Physiol.Rev. 94, 235–63 (2014). doi:10.1152/physrev.00018.2013PMID:24382887 5. Small J. V., Rottner K., Kaverina I. & Anderson K. I. Assembling an actin cytoskeleton for cell
attach-ment and moveattach-ment. 1404, 271–281 (1998). doi:10.1016/S0167-4889(98)00080-9PMID:9739149 6. Hotulainen P. & Lappalainen P. Stress fibers are generated by two distinct actin assembly mechanisms
in motile cells.J.Cell Biol. 173, 383–94 (2006). doi:10.1083/jcb.200511093PMID:16651381 7. Oakes P. W. & Gardel M. L. Stressing the limits of focal adhesion mechanosensitivity.Curr.Opin.Cell
Biol. 30C, 68–73 (2014). doi:10.1016/j.ceb.2014.06.003PMID:24998185
8. Dembo M. & Wang Y. L. Stresses at the cell-to-substrate interface during locomotion of fibroblasts. Bio-phys.J. 76, 2307–16 (1999). doi:10.1016/S0006-3495(99)77386-8PMID:10096925
9. Butler J. P., Tolić-Nørrelykke I. M., Fabry B. & Fredberg J. J. Traction fields, moments, and strain ener-gy that cells exert on their surroundings.Am.J.Physiol.Cell Physiol. 282, C595–605 (2002). doi:10. 1152/ajpcell.00270.2001PMID:11832345
10. Sabass B., Gardel M. L., Waterman C. M. & Schwarz U. S. High resolution traction force microscopy based on experimental and computational advances.Biophys.J. 94, 207–20 (2008). doi:10.1529/ biophysj.107.113670PMID:17827246
11. Tan J. L. et al. Cells lying on a bed of microneedles: an approach to isolate mechanical force.Proc.
Natl.Acad.Sci.U.S.A. 100, 1484–1489 (2003). doi:10.1073/pnas.0235407100PMID:12552122 12. Du Roure O. et al. Force mapping in epithelial cell migration.Proc.Natl.Acad.Sci.U.S.A. 102, 2390–
2395 (2005). doi:10.1073/pnas.0408482102PMID:15695588
14. Stabley D. R., Jurchenko C., Marshall S. S. & Salaita K. S. Visualizing mechanical tension across mem-brane receptors with a fluorescent sensor.Nat.Methods9, (2012).
15. Morimatsu M., Mekhdjian A. H., Adhikari A. S. & Dunn A. R. Molecular tension sensors report forces generated by single integrin molecules in living cells.Nano Lett. 13, 3985–9 (2013). doi:10.1021/ nl4005145PMID:23859772
16. Blakely B. L. et al. A DNA-based molecular probe for optically reporting cellular traction forces.Nat.
Methods11: 1229–32 (2014). doi:10.1038/nmeth.3145PMID:25306545
17. Liu Y. et al. Nanoparticle Tension Probes Patterned at the Nanoscale: Impact of Integrin Clustering on Force Transmission.Nano Lett. 14, 5539–46 (2014). doi:10.1021/nl501912gPMID:25238229 18. Zhang Y., Ge C., Zhu C. & Salaita K. DNA-based digital tension probes reveal integrin forces during
early cell adhesion.Nat.Commun. 5, 5167 (2014). doi:10.1038/ncomms6167PMID:25342432 19. Gardel M. L. et al. Traction stress in focal adhesions correlates biphasically with actin retrograde flow
speed.J.Cell Biol. 183, 999–1005 (2008). doi:10.1083/jcb.200810060PMID:19075110
20. Kumar S. et al. Viscoelastic retraction of single living stress fibers and its impact on cell shape, cytoskel-etal organization, and extracellular matrix mechanics.Biophys.J. 90, 3762–3773 (2006). doi:10.1529/ biophysj.105.071506PMID:16500961
21. Balaban N. Q. et al. Force and focal adhesion assembly: a close relationship studied using elastic micropatterned substrates.Nat.Cell Biol. 3, 466–72 (2001). PMID:11331874
22. Stricker J., Sabass B., Schwarz U. S. & Gardel M. L. Optimization of traction force microscopy for mi-cron-sized focal adhesions.J.Phys.Condens.Matter22, 194104 (2010). doi:10.1088/0953-8984/22/ 19/194104PMID:20523913
23. Colombelli J. et al. Mechanosensing in actin stress fibers revealed by a close correlation between force and protein localization.J.Cell Sci. 122, 1665–1679 (2009). doi:10.1242/jcs.042986PMID:19401336 24. Tanner K., Boudreau A., Bissell M. J. & Kumar S. Dissecting regional variations in stress fiber mechan-ics in living cells with laser nanosurgery.Biophys.J. 99, 2775–83 (2010). doi:10.1016/j.bpj.2010.08. 071PMID:21044574
25. Chang C.-W. & Kumar S. Vinculin tension distributions of individual stress fibers within cell-matrix adhe-sions.J.Cell Sci. 126, 3021–30 (2013). doi:10.1242/jcs.119032PMID:23687380
26. Mertz A. et al. Scaling of Traction Forces with the Size of Cohesive Cell Colonies.Phys.Rev.Lett. 108, 1–5 (2012). doi:10.1103/PhysRevLett.108.198101PMID:23003091
27. Rausch S. et al. Polarizing cytoskeletal tension to induce leader cell formation during collective cell mi-gration.Biointerphases 8, 32 (2013). doi:10.1186/1559-4106-8-32PMID:24706149
28. Tambe D. T. et al. Collective cell guidance by cooperative intercellular forces.Nat.Mater. 10, 469–475 (2011). doi:10.1038/nmat3025PMID:21602808
29. Albert P. J. & Schwarz U. S. Dynamics of cell shape and forces on micropatterned substrates predicted by a cellular Potts model.Biophys.J. 106, 2340–52 (2014). doi:10.1016/j.bpj.2014.04.036PMID:
24896113
30. Oakes P. W., Banerjee S., Marchetti M. C. & Gardel M. L. Geometry Regulates Traction Stresses in Ad-herent Cells.Biophys.J. 107, 825–833 (2014). doi:10.1016/j.bpj.2014.06.045PMID:25140417 31. Bischofs I., Schmidt S. & Schwarz U. Effect of Adhesion Geometry and Rigidity on Cellular Force
Distri-butions.Phys.Rev.Lett. 103, 048101 (2009). doi:10.1103/PhysRevLett.103.048101PMID:19659402 32. Schwarz U. S. et al. Calculation of forces at focal adhesions from elastic substrate data: the effect of
lo-calized force and the need for regularization.Biophys.J. 83, 1380–94 (2002). doi: 10.1016/S0006-3495(02)73909-XPMID:12202364
33. Plotnikov S. V, Sabass B., Schwarz U. S. & Waterman C. M. High-resolution traction force microscopy.
Methods Cell Biol. 123, 367–94 (Elsevier Inc., 2014). doi:10.1016/B978-0-12-420138-5.00020-3
PMID:24974038
34. Hansen P. C. Analysis of discrete ill-posed problems by means of the L-curve.SIAM34, 561–580 (1992). doi:10.1137/1034115
35. Dembo M. & Oliver T. Imaging the Traction Stresses Exerted by Locomoting Cells with the Elastic Sub-stratum Method.Biophys.J. 70, 2008–2022 (1996). doi:10.1016/S0006-3495(96)79767-9PMID:
8785360
36. Bischofs I. B., Klein F., Lehnert D., Bastmeyer M. & Schwarz U. S. Filamentous network mechanics and active contractility determine cell and tissue shape.Biophys.J. 95, 3488–96 (2008). doi:10.1529/ biophysj.108.134296PMID:18599642
38. Yeung T. et al. Effects of substrate stiffness on cell morphology, cytoskeletal structure, and adhesion.
Cell Motil.Cytoskeleton 60, 24–34 (2005). doi:10.1002/cm.20041PMID:15573414
39. Stricker J., Aratyn-Schaus Y., Oakes P. W. & Gardel M. L. Spatiotemporal constraints on the force-de-pendent growth of focal adhesions.Biophys.J. 100, 2883–93 (2011). doi:10.1016/j.bpj.2011.05.023
PMID:21689521
40. Deshpande V. S., McMeeking R. M. & Evans A. G. A bio-chemo-mechanical model for cell contractility.
Proc.Natl.Acad.Sci.U.S.A. 103, 14015–20 (2006). doi:10.1073/pnas.0605837103PMID:
16959880
41. Deshpande V. S., McMeeking R. M. & Evans A. G. A model for the contractility of the cytoskeleton in-cluding the effects of stress-fibre formation and dissociation.Proc.R.Soc.A Math.Phys.Eng.Sci. 463, 787–815 (2007). doi:10.1098/rspa.2006.1793
42. Pathak A., Deshpande V. S., McMeeking R. M. & Evans A. G. The simulation of stress fibre and focal adhesion development in cells on patterned substrates.J.R.Soc.Interface5, 507–524 (2008). doi:10. 1098/rsif.2007.1182PMID:17939980
43. Mohrdieck C. et al. A theoretical description of elastic pillar substrates in biophysical experiments.
Chemphyschem6, 1492–8 (2005). doi:10.1002/cphc.200500109PMID:16082672
44. Pathak A., Chen C. S., Evans A. G. & McMeeking R. M. Structural Mechanics Based Model for the Force-Bearing Elements Within the Cytoskeleton of a Cell Adhered on a Bed of Posts.J.Appl.Mech. 79, 061020 (2012). doi:10.1115/1.4006452
45. Guthardt Torres P., Bischofs I. B. & Schwarz U. S. Contractile network models for adherent cells.Phys.
Rev.E 85, 011913 (2012). doi:10.1103/PhysRevE.85.011913PMID:22400597
46. Thoresen T., Lenz M. & Gardel M. L. Reconstitution of contractile actomyosin bundles.Biophys.J. 100, 2698–705 (2011). doi:10.1016/j.bpj.2011.04.031PMID:21641315
47. Schneider C. a, Rasband W. S. & Eliceiri K. W. NIH Image to ImageJ: 25 years of image analysis.Nat.
Methods9, 671–675 (2012). doi:10.1038/nmeth.2089PMID:22930834
48. Persson P. & Strang G. A Simple Mesh Generator in MATLAB. 46, 329–345 (2004). doi:10.1137/ S0036144503429121
49. Johnson K. L.Contact Mechanics. ( Cambridge University Press, 2003).
50. Dawes B., Abrahams D. & Rivera R. Boost C++ Libraries.
51. Kovac B., Teo J. L., Mäkelä T. P. & Vallenius T. Assembly of non-contractile dorsal stress fibers re-quiresα-actinin-1 and Rac1 in migrating and spreading cells.J.Cell Sci. 126, 263–273 (2013). doi:10.
1242/jcs.115063PMID:23132927
52. Beningo K. a & Wang Y.-L. Flexible substrata for the detection of cellular traction forces.Trends Cell Biol. 12, 79–84 (2002). doi:10.1016/S0962-8924(01)02205-XPMID:11849971
53. Galbraith C. G., Yamada K. M. & Sheetz M. P. The relationship between force and focal complex devel-opment.J.Cell Biol. 159, 695–705 (2002). doi:10.1083/jcb.200204153PMID:12446745
54. Dubin-Thaler B. J. et al. Quantification of cell edge velocities and traction forces reveals distinct motility modules during cell spreading.PLoS One3, e3735 (2008). doi:10.1371/journal.pone.0003735PMID:
19011687
55. Collin O. et al. Self-organized podosomes are dynamic mechanosensors.Curr.Biol. 18, 1288–94 (2008). doi:10.1016/j.cub.2008.07.046PMID:18760605
56. Legant W. R. et al. Measurement of mechanical tractions exerted by cells in three-dimensional matri-ces.Nat.Methods7, 969–71 (2010). doi:10.1038/nmeth.1531PMID:21076420
57. Legant W. R. et al. Multidimensional traction force microscopy reveals out-of-plane rotational moments about focal adhesions.Proc.Natl.Acad.Sci.U.S.A. 110, 881–6 (2013). doi:10.1073/pnas.