Efficient Way to Improve Subgrade Property of Pavement by
Chemical Stabilization
Rajshekhar G Rathod
Assistant Professor Maharashtra Institute of technology College of Engineering, Kothrud, Pune, India
ABSTRACT
There are numerous soil stabilization techniques for improving the strength of the in-situ soil especially in road construction, and one of the techniques is using chemical additive. Chemical improvement is a time saving method that enables subgrade or sub-base layer and otherwise unsatisfactory materials in-situ to obtain higher density and strength, obviating the need for costly excavation and replacement with borrow material. This paper presents some results of the preliminary stages of research program carried out to explicate the mechanism and behavior between the liquid chemical and the engineering properties of three natural residual soils at laboratory scale. Liquid-formed chemical was selected in this research due to scarcity of such findings instead of the prevalent solid chemical additive such as lime, cement or fly ash. The focus on this research is on the improvement of engineering properties of two natural residual soils and mixed with different proportions of liquid chemical. Series of laboratory test on engineering properties, such as Modified Proctor Test, Consistency limits, moisture-density relationship (compaction) and California Bearing Ratio was undertaken to evaluate the effectiveness and performances of this chemical as soil stabilizing agent.
I.
INTRODUCTION
1.1 GeneralOver the past few decades several factors have led to an increase in the number of people migrating to large cities. Consequently these large cities are getting over populated and quite expectedly necessity of business, residential construction has increased the civil engineering projects located in areas with unsuitable soil is one of the most common problems in many parts of the world. The unsuitable soil (Black cotton Soil) can be stabilized by performing soil stabilization. In India black soil is the most problematic soil when it comes to construction. In rainy season black cotton soil swells and become sticky. Whereas in summers the moisture present in the soil evaporates and soil shrinks resulting in the crack of approximate 10 to 15 cm wide and up to 1 meter deep. The percentage covered by black cotton soil in geotechnical areas of India is 16.6%, which says huge amount of soil in India needs stabilization. Mechanical, chemical, electrical, thermal and other methods are in practice to improve the engineering properties of soil.
In developing countries like India the biggest handicap to provide a complete network of road system is the limited finances available to build road by the conventional methods. Therefore there is a need for low cost road construction to meet the growing needs of the road traffic. The construction cost can be considerably decreased by selecting local materials including local soils for the construction of the lower layers of the
pavement such as the embankment and sub-base course. If the stability of the local soil is not adequate for supporting wheel loads, the properties are improved by soil stabilization techniques. Thus the principle of soil stabilized road construction involves the effective utilization of local soils and other suitable stabilizing agents.
1.2 Project Undertaken
The work presented in this paper is a contribution to the application of chemical and conventional stabilization techniques, by adding terrasil and river sand for two different soil i.e. red soil and black cotton soil. Initially, the chemical, physical and geotechnical properties of the untreated soils were determined. These tests were complemented by direct measurements of the properties of both the soil i.e. consistency limits, heavy compaction, specific gravity and California bearing ratio. Secondly, the study examined the effects of different types of stabilization on the physical properties of both the soils.
II.
MATERIAL AND
METHODOLOGY
2.1 IntroductionSoil has various meaning, depending upon the general professional field in which it is being considered in general soil mean the top layer of the earth surface in which plants can grow consisting of rocks and minerals particles mixed with decayed organic matter and having the capability of
retaining water. And thus stabilizing soil gives better bearing capacity.
2.2 Types of Soil a. Black cotton soil
In this study, the soil under scrutiny was gathered from the vicinity of Flora Institute Of Technology, Khopi, Pune. At first, so as to distinguish the wide soil sorts in the field with no research facility testing, a visual characterization is done, which demonstrates that soil under scrutiny is brown in shading, further examination is completed with water to make a paste and rubbed in middle of fingers leaves a stain which is not watched for residues. When it is wet it doesn't get to be dry soon. In like way, display swelling and shrinkage and are described by a typical shrinkage pattern. The soil has an expansive surface zone because of level and lengthened molecule shapes that stick together when wet, avoiding typical waste procedures. When it is wet it doesn't get to be dry soon. In like way, when completely dry, it is not soon wetted and shrinks causing breaks.
b. Red soil
Red soil is derived from weathering of ancient metamorphic rock of the Deccan plateau. Red soil is any of a group of soil that grow in a humid temperature, moist climate under deciduous and mix forests and that have raw mineral. Thin organic layers overlying a yellowish brown leached deposit resting on an alluvial. Their colour is mostly ferric oxides occurring a slight coatings on the soil particle through the iron oxide arise as hematite as hydrous ferric oxide, the colour is red and when it happen in the hydrate system as limonite the soil become to be yellow colour. Generally the surface soils are red while the horizon under gets yellowish colour.
c. River sand
Sand is natural occurring granular material composed of finely divided rock & mineral particles. It is defined by size, being finer than gravel & coarser than silt. Sand can also refer toward textural class of soil or soil type that is a soil containing more than 85% sand size particles (by mass).
The composition of sand varies, depending on the local rock sources and conditions, but the most common constituent of sand in inland continental settings and non-tropical coastal settings is silica (silicon dioxide, or SiO2), usually in the form of quartz. The second most common type of sand is calcium carbonate, for example aragonite, which has mostly been created, over the past half billion years, by various forms of life,
like coral and shellfish. It is, for example, the primary form of sand apparent in areas where reefs have dominated the ecosystem for millions of years like the Caribbean.
2.3 Tests On Soil
Test to know the engineering properties of soil can be carried out on site as well laboratory. On-site test are as follows:
1.Standard Penetration Test. 2.Cone Penetration Test, etc.
laboratory test are as follows: 1. Atterberg Limits Test. 2. California Bearing Ratio. 3. Direct Shear Test. 4. Expansion Index Test. 5. Soil Compaction Test.
6. Unconfined Compression Test etc.
2.4 Types of stabilization 1. Mechanical stabilization 2. Lime stabilization. 3. Cement stabilization. 4. Lime-fly ash stabilization. 5. Using Bitumen.
6. Other chemicals like Stabling, RBI-81, Soil fix and Zydex etc.
2.5 Type of Chemical a. Terrasil
Table 1 Chemical composition of terrasil.
Chemical Compound Value in Range(%)
Hydroxyalkyl-alkoxy-alkylsilyl 65-70%
Benzyl Alcohol 25-27%
Ethylene Glycol 3-5%
2.6 Engineering Property of Soil
Table 2 General properties of soil.
Properties Black cotton soil Red soil
Liquid limit 75% 41%
Plastic limits 35% 20.15%
Plasticity index 40 19.85%
Free swelling index 17.50% 0
Specific gravity 2.51 2.64
Dry density gm/cc 1.34 1.775
Moisture content 25.54% 15%
III.
LABORATORY WORK
3.1 GeneralPerformed various laboratory test on soil i.e Red and Black cotton soil to find out their basic properties such as liquid limit, plastic limit, specific gravity, modified proctor & CBR tests.And soil stabilization by using conventional stabilisation for both red and black cotton soil by using natural river sand(10%) & chemical stabilisation for both red &
black cotton soil by using Terrasil(0.041%) from Zydex Industries.
3.2 Conventional Method Engineering Properties
In conventional method 10% of natural river sand is used as an additives to the soil i.e. both red and black cotton soil by weight of soil. All the test such as liquid limit, plastic limit, specific gravity, modified proctor & C.B.R test were performed on respective soils.
Red soil Liquid limit
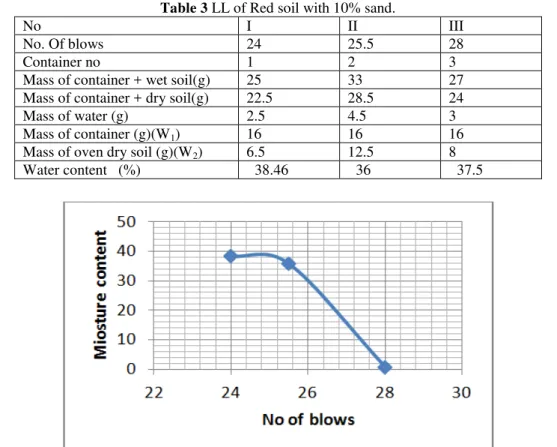
Table 3 LL of Red soil with 10% sand.
No I II III
No. Of blows 24 25.5 28
Container no 1 2 3
Mass of container + wet soil(g) 25 33 27
Mass of container + dry soil(g) 22.5 28.5 24
Mass of water (g) 2.5 4.5 3
Mass of container (g)(W1) 16 16 16
Mass of oven dry soil (g)(W2) 6.5 12.5 8
Water content (%) 38.46 36 37.5
Liquid Limit:- 38.5 Plastic limit
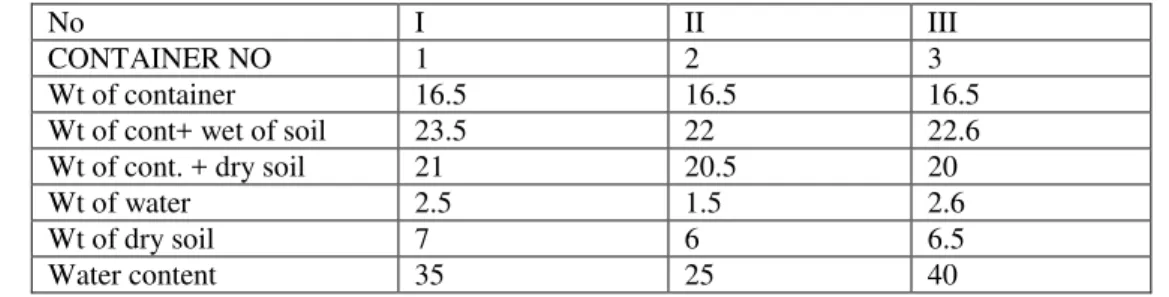
Table 4 PL of Red soil with 10% sand.
No I II III
CONTAINER NO 1 2 3
Wt of container 16.5 16.5 16.5
Wt of cont+ wet of soil 23.5 22 22.6
Wt of cont. + dry soil 21 20.5 20
Wt of water 2.5 1.5 2.6
Wt of dry soil 7 6 6.5
Water content 35 25 40
Plastic Limit:-33.33
Specific gravity [IS: 2720 (Part-III/SEC-I)]
Table 5 Specific Gravity Test for Red soil with 10% sand.
Determination I II III
Density bottle no 1 (250gm) 2 (350 gm) 3 (300 gm)
Mass of density bottle 681 681 681
Mass of density bottle + dry soil 932 1032 982
Mass of density bottle + soil + water 1653 1684 1668
Mass of bottle +water 1506 1506 1506
Specific gravity 2.41 2.02 2
Average Specific Gravity=2.14
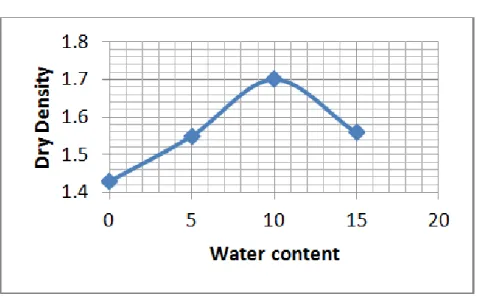
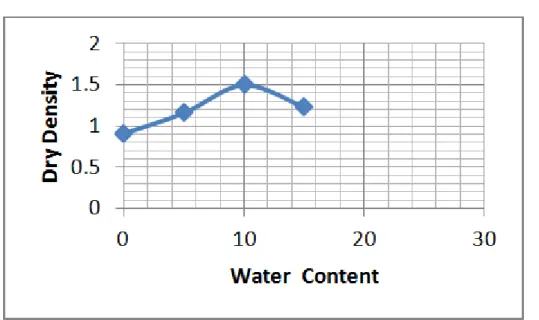
Modified proctor test (Heavy Compaction)
Table 6 Proctor Test for Red soil with 10% sand.
Determination no I II III IV V
Wt of mould + compacted soil 5136 9096 10560 10120 9560
Wt of mould 5546 5546 5546 5546 5546
Volume of mould 2250 2250 2250 2250 2250
Wt of compacted soil 2567 3550 5014 4574 4014
bulk density 1.4 1.57 1.80 2.032 1.784
Dry density 1.29 1.42 1.56 1.722 1.48
Percentage of water use 6 10 15 18 20
OMC: - 15% and MDD:- 1.7125 g/cm3 CBR
Table 7 Standard load used in C.B.R test.
Penetration Unit std. Load (kgf/cm2) Total std. Load (kgf)
2.5mm 70 1370
5mm 105 2055
7.5mm 134 2630
10mm 162 3180
12.5mm 183 3600
Table 8 C.B.R test of red soil with 10% sand.
Soil type Penetration CBR
Native 10% sand
Red soil @ 2.5 mm 6.5 8.37
@ 5.0 mm 7.99 9.47
Fig. 3 Load Penetration Curve for C.B.R test of Red soil with 10% Sand
Black cotton soil Liquid limit
Table 9 LL B.C soil with 10% sand.
N0 I II III
No. Of blows 21 26 31
Container no 1 2 3
Mass of container + wet soil(g) 26 27.5 27
Mass of container + dry soil(g) 22.5 23.5 23
Mass of water (g) 3.5 4 4
Mass of container (g)(W1) 16.5 16.5 16.5
Mass of oven dry soil (g)(W2) 6 6 6.5
Fig. 4 Flow curve for B.C soil with 10% sand.
Liquid Limit:-60.9 Plastic limit
Table 10 PL for B.C soil with 10% sand.
NO I II III
CONTAINER NO 1 2 3
Wt of container 16.5 16.5 16.5
Wt of cont+ wet of soil 24.5 23.5 23
Wt of cont. + dry soil 23 22 21.5
Wt of water 1.5 1.5 1.5
Wt of dry soil 8 7 7.5
Water content 18.75 21.14 20
Plastic Limit:- 19.96
Specific gravity [IS: 2720 (Part-III/SEC-I)]
Table 11 Specific gravity test for B.C soil with 10% sand.
Determination I II III
Density bottle no 1 2 3
Mass of density bottle 681 681 681
Mass of density bottle + dry soil 932 1033 980
Mass of density bottle + soil + water 1640 1714 1677
Mass of bottle +water 1506 1506 1506
Specific gravity 2.14 2.44 2.33
Average Specific Gravity:-2.30
Modified proctor test(Heavy Compaction)
Table 12 Proctor Test for B.C soil with 10% of Sand.
Determination no I II III IV
Wt of mould + compacted soil 8966 9331 9790 9565
Wt of mould 5546 5546 5546 5546
Volume of mould 2250 2250 2250 2250
Wt of compacted soil 3420 3785 4244 5546
bulk density 1.52 1.68 1.88 1.78
Dry density 1.43 1.55 1.70 1.56
Fig. 5 Compaction Curve for B.C soil with 10% Sand.
OMC:- 10.125% and MDD:- 1.7 g/cm3 CBR
Table13 Standard load used in C.B.R test.
Penetration Unit std. Load (kgf/cm2) Total std. Load (kgf)
2.5mm 70 1370
5mm 105 2055
7.5mm 134 2630
10mm 162 3180
12.5mm 183 3600
Table 14 C.B.R Test for B.C Soil with 10% sand.
Soil type Penetration CBR
Native 10% Sand
Black cotton soil @ 2.5 mm 1.64 2.05
@ 5.0 mm 1.42 1.8
Fig. 6 Load Penetration Curve for C.B.R Test of B.C soil with 10% sand.
4.3 Chemical Method Engineering Properties In chemical method 0.041% of Terrasil is used as an additive to the red & black cotton soil by weight
Red soil Liquid limit
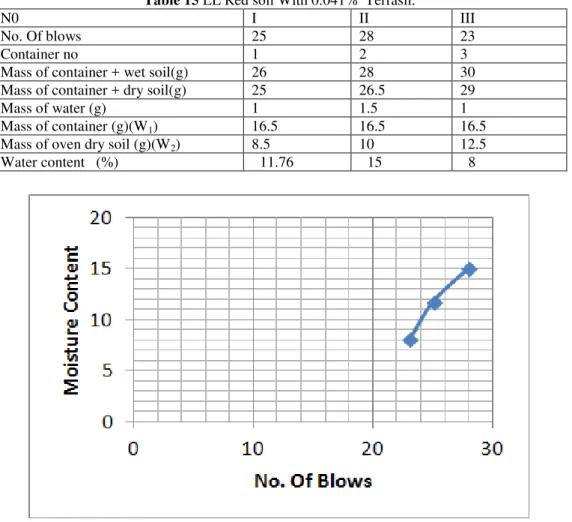
Table 15 LL Red soil With 0.041% Terrasil.
N0 I II III
No. Of blows 25 28 23
Container no 1 2 3
Mass of container + wet soil(g) 26 28 30
Mass of container + dry soil(g) 25 26.5 29
Mass of water (g) 1 1.5 1
Mass of container (g)(W1) 16.5 16.5 16.5
Mass of oven dry soil (g)(W2) 8.5 10 12.5
Water content (%) 11.76 15 8
Fig. 7 Flow curve for Red Soil with 0.041% Terrasil. Liquid Limit:-11.7
Plastic limit
Table 16 Plastic Limit of Red Soil with 0.041% Terrasil.
NO I II III
CONTAINER NO 1 2 3
Wt of container 16.5 16.5 16.5
Wt of cont+ wet of soil 33.5 32.5 31.2
Wt of cont. + dry soil 30 29.5 28
Wt of water 3.5 3 3.2
Wt of dry soil 13.5 13 11.5
Water content 25.9 23.07 27.8
Plastic Limit:-25.59
Modified proctor test(Heavy Compaction)
Table 17 Proctor Test Compaction Test of Red soil with 0.041% Terrasil
Determination no I II III IV V
Wt of mould + compacted soil 7707 8446 9458 8458 5671
Wt of mould 5546 5546 5546 5546 5546
Volume of mould 2250 2250 2250 2250 2250
Wt of compacted soil 2161 2900 3912 3125 2912
bulk density 0.96 1.28 1.73 1.38 1.29
Dry density 0.91 1.16 1.50 1.16 1.075
Fig. 8 Compaction Curve for Red Soil with 0.041% Terrasil.
OMC:-10.18% and MDD:-1.91g/cm3 CBR
Table 18 Standard Load used in C.B.R Test.
Penetration Unit std. Load
(kgf/cm2)
Total std. Load (kgf)
2.5mm 70 1370
5mm 105 2055
7.5mm 134 2630
10mm 162 3180
12.5mm 183 3600
Table 19 C.B.R test of Red soil with 0.041% Terrasil.
Soil Type Penetration C.B.R
Native 0.041% Terrasil
Red Soil @2.5 mm 1.64 2.79
@5 mm 1.42 2.46
Black cotton soil Liquid limit
Table 20 LL B.C Soil with 0.041% Terrasil.
N0 I II III
No. Of blows 25 22 28
Container no 1 2 3
Mass of container + wet soil(g) 29 32 26
Mass of container + dry soil(g) 25 26.5 23
Mass of water (g) 4 5.5 3
Mass of container (g)(W1) 16.5 16.5 16.5
Mass of oven dry soil (g)(W2) 8.5 10 6.5
Water content (%) 47 55 46
Fig. 10 Flow Curve for B.C soil with 0.041% Terrasil. Liquid Limit:- 51.14
Plastic limit
Table 21 PL B.C soil with 0.041% Terrasil.
NO I II III
CONTAINER NO 1 2 3
Wt of container 16.5 16.5 16.5
Wt of cont+ wet of soil 25 26 26.5
Wt of cont. + dry soil 23.5 24.5 24.3
Wt of water 1.5 1.5 1.5
Wt of dry soil 7 8 6.3
Water content 21.42 `18.75 23.80
Plastic Limit:-21.32
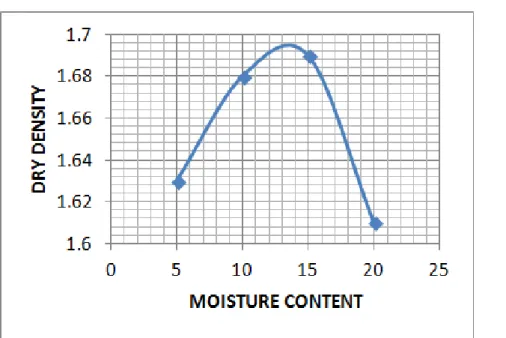
Modified proctor test(Heavy Compaction)
Table 22 Compaction Test of B.C soil with 0.041% Terrasil.
Determination no I II III IV
Wt of mould + compacted soil 9543 9728 9941 9812
Wt of mould 5546 5546 5546 5546
Volume of mould 2250 2250 2250 2250
Wt of compacted soil 3997 4182 4395 4266
bulk density 1.77 1.85 1.95 1.89
Dry density 1.63 1.68 1.69 1.61
Fig. 11 Compaction Curve of B.C soil with 0.041% of Terrasil.
OMC:- 14.5 and MDD:-1.692 CBR
Table 23 Standard Load Used in C.B.R Test.
Penetration Unit std. Load
(kgf/cm2)
Total std. Load (kgf)
2.5mm 70 1370
5mm 105 2055
7.5mm 134 2630
10mm 162 3180
12.5mm 183 3600
Table 24 C.B.R test of B.C soil with 0.041% Terrasil.
Soil Type Penetration C.B.R
Native 0.041% Terrasil
Black Cotton Soil
@2.5 mm 1.64 10.641
@5 mm 1.42 20.175
IV.
RESULTS AND DISCUSSION
4.1 GeneralThis chapter includes the comparison between conventional and chemical stabilisation for both
red and black cotton soil and all the comparison are shown in the form of tables and graph.
4.2 Red Soil Liquid limit
Table 25 Comparison Between Conventional & Chemically Treated Red soil For LL.
Red soil Liquid limit Conventional 38.5% Chemical 11.7%
Fig. 13 Comparison Of Flow Curves Between Conventional & Chemically Treated Red soil For
LL.
Plastic limit
Table 26 Comparison Between Conventional & Chemically Treated Red soil For PL.
Red soil Plastic limit Conventional 33.5% Chemical 25.59%
Modified proctor test (Heavy Compaction) Table 27 Comparison Between Conventional &
Chemically Treated Red soil For Proctor Test.
Red soil OMC MDD
Conventional 15.5% 1.17 gm/cm3 Chemical 10.18% 1.91
gm/cm3
Fig. 14 Comparison of Compaction Curves between Conventional & Chemically Treated Red
soil for Proctor Test. CBR
Table 28 Comparison Between Conventional & Chemically Treated Red soil For C.B.R.
Red soil C.B.R Conventional
@2.5mm 8.37%
@5mm 9.47%
Chemical C.B.R
@2.5mm 16.1%
@5mm 21.6%
Fig. 15 Comparison of Load Penetration Curves between Conventional & Chemically Treated Red
soil For C.B.R. Black Cotton Soil
Liquid limit
Table 29 Comparison Between Conventional & Chemically Treated B.C soil For LL.
Black cotton soil
Fig. 16 Comparison of Flow Curves Between Conventional & Chemically Treated B.C soil For
LL.
Plastic limit
Table 30 Comparison Between Conventional & Chemically Treated B.C soil For PL.
Red soil Plastic limit Conventional 19.96% Chemical 21.39%
Modified proctor test (Heavy Compaction) Table 31 Comparision between Conventional &
Chemically Treated soil for Proctor Test. Black cotton
soil
OMC MDD
Conventional 10.25% 1.7 gm/cm3 Chemical 14.5% 1.692
gm/cm3
Fig. 17 Comparison of Compaction Curve between Conventional & Chemically Treated B.C soil for
Proctor Test.
C.B.R
Table 32 Comparison Between Conventional & Chemically Treated B.C. soil For C.B.R.
`Black cotton soil
C.B.R
Conventional
@2.5mm 8.69%
@5mm 7.78%
Chemical C.B.R
@2.5mm 10.84%
@5mm 20.17%
Fig. 18 Comparison of Load Penetration Curves between Conventional & Chemically Treated B.C
soil for C.B.R.
V.
CONCLUSIONS
From laboratory results it was concluded that 1. Chemical stabilization had more CBR valuethan conventional method of soil stabilization. 2. Chemical stabilization required lesser
thickness of subgrade in comparison with conventional stabilization.
3. By adding terresil plasticity index reduced and dry density increases.
4. Chemical stabilization was more economical than conventional stabilization.
REFERENCES
[1]. P. Venkaramuthyalu et al “ study on performance of chemically stabilized expensive soil „‟ IJAET jan 2012
[2]. R. saravan et al “A study on soil stabilization of clay soil using flyash „‟ International Journal of research in civil engineering architecture & Design „‟ vol. 1 Issue 2 oct -dec 2013 pp 333
[3]. Ankit negi et al “Soil stabilization using lime ,International Journal of Innovative in Science Engineering & Technology vol. 2 Issue -2 feb. 2013
927 geotech const. mat. & Envirnonment ISSN 2186 -2982(P) 2186-2990 . Japan [5]. Nandan A. Patel, Prof.C. B. Mishra, Mr.
Vasu V. Pancholi, “Scientifically Surveying the usage of terrasil chemical for soil
stabilization”, International Journal of Research in Advent Technology, Vol.3, No.6, June 2015
[6]. Monika Malhotra et al “ stabilization of expansive soil using low cost material‟‟, International Journal of engineering & Innovative Technology (IJEIT) VOL. 2 Issue 11 may 2013
[7]. Olanlyan et al “ soil stabilization techniques using sodium hydroxide additives „‟ International Journal of Civil & Environment engineering IJCEE vol . 2 No. 6
[8]. M. K. Gueddouda et al “ Chemical stabilization of expansive days from Algeria „‟ Global journal of researches in engineering vol. II Issue 5 july 2011 [9]. Onyelowe ken c‟ et al “ A Comparitive
review of soil modification Method „‟ A PRN journal of Earth sciences vol. 1 no. 2 nov. 2012
[10]. Faisal ali “ stabilization of Residual soil using Liquid chemical” EJGW volume 17 (2012) bund -B